Wind Turbine Pitch and Yaw Drive Market Size & Growth:
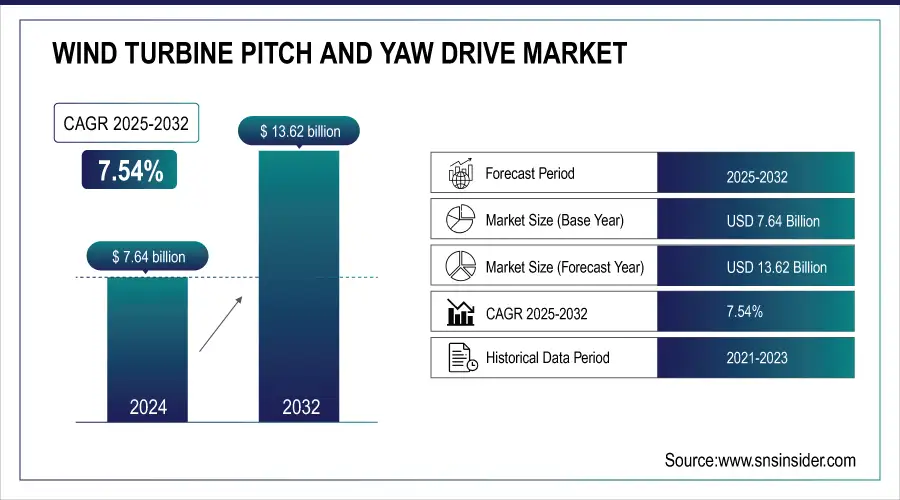
The Wind Turbine Pitch and Yaw Drive Market size was valued at USD 7.64 billion in 2024 and is expected to reach USD 13.62 billion by 2032, growing at a CAGR of 7.54% over the forecast period of 2025-2032. The key factors fuelling the market growth are the global move towards renewable energy, leading to wind power penetration mainly in offshore sites, which require innovative systems to ensure optimum efficiency, safety, and performance of the pitch and yaw drives.
To Get more information on Wind Turbine Pitch and Yaw Drive Market - Request Free Sample Report
Wind Turbine Pitch and Yaw Drive Market Size and Forecast:
-
Market Size in 2024: USD 7.64 Billion
-
Market Size by 2032: USD 13.62 Billion
-
CAGR: 7.54% from 2025 to 2032
-
Base Year: 2024
-
Forecast Period: 2025–2032
-
Historical Data: 2020–2022
In 2024, global wind turbine installations reached a record 121.6 GW, with China contributing 86.7 GW, accounting for 72% of new global capacity. This surge underscores the increasing emphasis on renewable energy worldwide
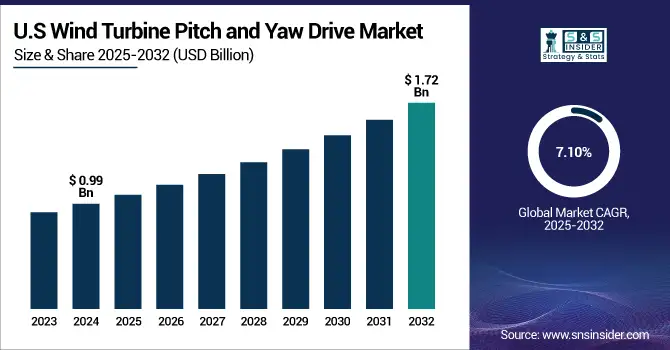
The U.S. Wind turbine pitch and yaw drive market size is estimated to be valued at USD 0.99 billion in 2024 and is projected to grow at a CAGR of 7.10%, reaching USD 1.72 billion by 2032. Older turbine replacements, grid modernization, drive system technology upgrades, and robust supportive policies at both the federal and state levels for decarbonization and large-scale wind energy deployment are fueling the U.S. market.
Wind Turbine Pitch and Yaw Drive Market Key Drivers:
-
Global Wind Drive Market Grows as Nations Embrace Clean Energy with Advanced Electric Pitch Systems
As the world strives to eliminate carbon emissions, wind energy projects are being deployed throughout the world to meet these targets, contributing to growth in the global Wind turbine pitch and yaw drive market. Various governments across the region are adopting attractive policies, tax incentives, and renewable energy targets, driving offshore and onshore wind turbine installations. Wind turbine pitch and yaw drive market trends highlight that electric drives are now the main focus for pitch and yaw systems in next-generation turbines, as improvements in reliability, efficiency, and overall turbine safety are becoming technologically feasible.
-
The U.S. Inflation Reduction Act extends the Investment Tax Credit (ITC) and Production Tax Credit (PTC) for wind energy projects, providing substantial financial support for both onshore and offshore developments
Wind Turbine Pitch and Yaw Drive Market Restraints:
-
Rising Turbine Demands Challenge Wind Drive Systems Amid Material Shortages and Evolving Technological Needs
The technological complexity associated with developing high-performance dependable systems is a dominant restraint. Pitch and yaw drive systems need to continue to adapt and evolve as turbines increase in size and power, to be able to withstand the extremes that are seen on modern wind farms. Furthermore, supply chain disruptions, as well as the availability of crucial materials, including rare-earth metals, may prolong manufacturing and project timelines.
Wind Turbine Pitch and Yaw Drive Market Opportunities:
-
Global Wind Market Surges with Policy Support, Ageing Infrastructure, and Offshore Drive Technology Advancements
Vigorous demand in the market is also being driven by governmental programs, such as tax credits, renewable energy targets, and grid policies. In well-established regions, on the other hand, the rapid ageing of wind infrastructure offers compelling aftermarket retrofit or drive system upgrade opportunities. New investment opportunities in renewable infrastructure are also found in Asian, Latin American, and African emerging markets, where much higher levels of growth are expected. The growing emphasis on offshore wind farms will, over the next years, provide more scope for high-end and rugged drive technologies, which just need to be weather-proof.
-
The UK's Crown Estate has approved an expansion of offshore wind capacity, aiming to generate up to 50 GW of offshore wind energy by 2030. Similarly, South Korea plans to install 14.3 GW of offshore wind capacity by 2030, with significant projects like the 8.2 GW Sinan and the 6 GW Ulsan floating wind projects underway.
Wind Turbine Pitch and Yaw Drive Market Challenges:
-
Wind Industry Faces Challenges Integrating New Drive Systems Into Ageing Infrastructure and Harsh Offshore Conditions
The major hurdle is the integration of new technologies into the ageing infrastructure in many wind farms. Replacing turbines with modern drive systems is complex and energy-intensive. Environmental conditions, especially for offshore wind farms where the components must survive the harsh marine environment, are a major obstacle, demanding reliability concerns.
Wind Turbine Pitch and Yaw Drive Market Segmentation Analysis:
By End Use, Onshore Wind Farms Lead Market, Offshore Segment Set for Rapid Expansion
In 2024, Onshore wind farms possess the largest share in the Wind turbine pitch and yaw drive market with 71.5 %. This is because onshore wind farms are far cheaper to build and run than offshore ones. Onshore turbines are the most common type of wind turbine that work on land where at that point land is accessible as well as space for the breeze. These features are responsible for wind turbines being the most widely used in low-cost, large, and small-scale renewable energy projects due to affordability and scale.
Offshore wind farms are estimated to grow highest CAGR from 2025 to 2032. The higher capacity of offshore wind farms is primarily due to the higher and more consistent wind speeds available offshore, resulting in greater energy generation potential. Technological advancements, including offshore turbines at low costs and long-term efficient operations out of a smaller footprint, combined with the continuous pressure by the governments to meet decarbonization targets, are likely to boost the investment in offshore wind energy projects, which will subsequently increase the demand for advanced pitch and yaw drive systems for offshore installations.

By Type, >3000 W Turbines Lead Market Share While 1000–3000 W Segment Shows Fastest Growth
The Wind turbine pitch and yaw drive market was dominated by the >3000 W segment within 2024, holding a 67.2% market share. This dominance is fueled by the higher deployment of larger capacity turbines, especially for offshore wind farms and large capacity onshore installations. This has seen the near ubiquity of such turbines in utility-scale projects because their pitch and yaw drive systems are significantly different and require cutting-edge solutions to operate in optimal conditions with both performance and safety in mind.
The 1000 W – 3000 W CAGR from 2025 to 2032 segment is projected to exhibit the most rapid growth. The increase is driven by a surge in demand for affordable medium-sized turbines, which are well-suited to onshore wind farms and new markets. Medium-sized turbines represent a more realistic and scalable answer to the demands being placed on governments and corporations to achieve renewable energy targets and drive capability diversity in the grid, which in turn is pushing the appetite for more advanced pitch and yaw control systems in this sector.
By Pitch System, Electric Pitch and Yaw Drive Systems Dominate Market and Set to Grow Fastest
In 2024, the market share of electric pitch and yaw drive systems was 57.4%, and it is expected to grow at the highest CAGR from 2025 to 2032. The market share for these has mainly been due to the growing penetration of electric systems that provide advantages over hydraulic and mechanical systems, such as enhanced efficiency, reliability, and reduced maintenance costs. As turbine technology continues to advance, electric drive systems are becoming the preferred choice for next-generation turbines, offering enhanced performance in variable wind regimes and increasing operational availability. And the switch offshore and to high-power turbines continues to drive electric solutions. Supply will cater for increasing demand for sophisticated, cost-effective, and environmentally sustainable wind energy solutions worldwide, with the continuous development of electric pitch and yaw drives.
By Size, Medium-Sized Turbines Hold Largest Share, Large Turbines Projected for Highest Growth
In 2024, medium-sized turbines held 46.6% market share in the Wind turbine pitch and yaw drive market. Such dominance is largely fuelled by the continuously growing demand for turbines offering maximum efficiency with the least cost and installation possibilities. Medium turbines are suited domestically, for onshore wind farms, and offshore at smaller installations due to their design making sense for energy capturing in areas where the wind is moderate.
It is projected that large turbines will show the highest CAGR growth from 2025 to 2032. This growth is due to the increasing transition to offshore wind farms and large renewable energy projects. In high-capacity wind installations, large turbines that can yield greater energy output are becoming increasingly more common. The trend towards large turbines is set to continue in the next few years, as expanding turbine design and technology continue to use the benefits of increased capacity and energy efficiency.
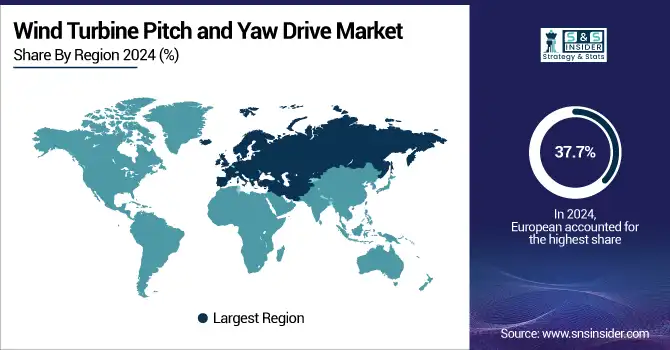
Europe Dominates Wind Turbine Pitch and Yaw Drive Market in 2024
In 2024, Europe commands an estimated 37.7% share of the Wind Turbine Pitch and Yaw Drive Market, solidifying its leadership position. The region’s dominance is fueled by large-scale offshore and onshore wind farm developments, supportive EU renewable energy policies, and technological advancements in turbine control systems. Government subsidies, decarbonization mandates, and investments in advanced electric pitch and yaw drives accelerate adoption. With Europe focusing on carbon neutrality and energy security, the region continues to lead global demand for high-efficiency wind turbines.
Get Customized Report as per Your Business Requirement - Enquiry Now
Germany Leads Europe’s Wind Turbine Pitch and Yaw Drive Market
Germany dominates due to its leadership in renewable energy integration, extensive offshore and onshore wind capacity, and strong R&D in turbine technologies. Supportive policies, such as subsidies for large-scale wind farms and incentives for electric pitch and yaw systems, drive adoption. Germany’s coastal geography enables efficient offshore wind projects, while its industrial and technological base ensures deployment of advanced turbines. Continuous innovation in turbine control systems, coupled with EU sustainability mandates, positions Germany as the central driver of Europe’s Wind Turbine Pitch and Yaw Drive Market in 2024.
Asia Pacific is the Fastest-Growing Region in Wind Turbine Pitch and Yaw Drive Market in 2024
The Asia Pacific Wind Turbine Pitch and Yaw Drive Market is projected to grow at a robust CAGR of 8.4% from 2025 to 2032. Rapid industrialization, government-backed renewable energy policies, and expanding onshore and offshore wind installations drive this growth. Increasing adoption of medium- and large-capacity turbines in emerging economies boosts demand for advanced pitch and yaw drive systems. Investments in turbine efficiency and grid integration further strengthen the market. Countries like China, Japan, and South Korea are making large-scale investments in wind energy infrastructure, positioning Asia Pacific as a key driver of global market expansion.
China Leads Asia Pacific’s Wind Turbine Pitch and Yaw Drive Market
China dominates due to its ambitious renewable energy roadmap, extensive wind capacity, and strong government support for clean energy deployment. Large-scale offshore and onshore projects, combined with subsidies and renewable targets, drive adoption of advanced pitch and yaw drives. China’s manufacturing capabilities, technological innovation, and grid infrastructure enable cost-effective, high-performance turbines. Aggressive investments in turbine R&D, offshore wind farms, and renewable integration reinforce China as the central driver of the Asia Pacific Wind Turbine Pitch and Yaw Drive Market in 2024.
North America Wind Turbine Pitch and Yaw Drive Market Insights, 2024
In 2024, North America held a significant share of the Wind Turbine Pitch and Yaw Drive Market, supported by extensive onshore wind farms and emerging offshore projects. Strong federal and state policies, renewable energy mandates, and private sector investments drive turbine deployment. Utility-scale wind projects demand advanced pitch and yaw drive systems to improve efficiency and reliability.
United States Leads North America’s Market
The United States dominates due to extensive onshore and offshore capacity and federal renewable incentives. Government programs and private investments drive turbine installations, increasing demand for advanced pitch and yaw systems. Germany’s leadership in Europe serves as a benchmark for turbine innovation and technology adoption.
Middle East & Africa and Latin America Wind Turbine Pitch and Yaw Drive Market Insights, 2024
The Wind Turbine Pitch and Yaw Drive Market in the Middle East & Africa and Latin America is witnessing gradual growth in 2024. In the Middle East, Saudi Arabia and the UAE are investing in renewable energy infrastructure, while South Africa is expanding wind capacity for industrial and energy use. Latin American countries, led by Brazil and Chile, are developing onshore and medium-capacity turbines. Government policies, decarbonization initiatives, and renewable energy availability support adoption, driving increased demand for advanced pitch and yaw drive systems across these regions.
Wind Turbine Pitch and Yaw Drive Companies are:
-
Vestas Wind Systems A/S
-
General Electric (GE) Renewable Energy
-
Nordex SE
-
Mitsubishi Heavy Industries (MHI)
-
Enercon GmbH
-
Senvion (now part of Siemens Gamesa)
-
Goldwind
-
Envision Energy
-
Doosan Heavy Industries & Construction
-
Dongfang Electric Corporation (DEC)
-
REpower Systems (part of Siemens Gamesa)
-
Bharat Heavy Electricals Limited (BHEL)
-
ABB Ltd. (wind drive systems supplier)
-
Bonfiglioli Riduttori S.p.A.
-
NGC (Nordic Gear Company)
-
Winergy (Daimler subsidiary)
-
ZF Friedrichshafen AG (wind gear and drive systems)
-
Vensys Energy AG
Competitive landscape for the wind turbine pitch and yaw drive market:
Siemens Gamesa Renewable Energy
Siemens Gamesa Renewable Energy is a Spain-based leader in wind turbine manufacturing, specializing in onshore and offshore turbines and advanced pitch and yaw drive systems. With decades of experience, the company designs, engineers, and supplies cutting-edge electric and hydraulic drive solutions, optimizing turbine performance, reliability, and safety. Siemens Gamesa operates globally, supporting installation, maintenance, and service for utility-scale wind projects. Its role in the Wind Turbine Pitch and Yaw Drive Market is vital, as it provides high-capacity turbines with integrated control systems that maximize energy output and operational efficiency, ensuring strong adoption worldwide.
-
In 2025, Siemens Gamesa previewed its next-generation offshore turbine lineup, highlighting enhanced electric pitch and yaw drives with improved efficiency, lower maintenance requirements, and robust grid integration capabilities.
Vestas Wind Systems A/S
Vestas Wind Systems A/S is a Denmark-based global leader in wind turbine solutions, offering a broad portfolio of onshore and offshore turbines equipped with advanced pitch and yaw drive technologies. With extensive engineering expertise, the company delivers highly efficient turbines optimized for variable wind conditions. Vestas manages project design, installation, and lifecycle service worldwide. Its role in the market is crucial, providing reliable and scalable turbine solutions that meet renewable energy targets and enhance operational performance for diverse clients globally.
-
In 2025, Vestas launched an upgraded turbine platform featuring modular electric pitch and yaw drives, designed to support higher energy yields and reduce downtime in large-scale wind farms.
General Electric (GE) Renewable Energy
GE Renewable Energy, based in the U.S., is a global innovator in wind energy solutions, focusing on both onshore and offshore turbines with state-of-the-art pitch and yaw drive systems. The company integrates digital monitoring, electric drive systems, and predictive maintenance to maximize turbine efficiency and availability. GE operates across multiple continents, providing turnkey solutions and aftersales support for utility-scale installations. Its role in the market is critical, driving technological advancements and ensuring turbines operate safely and efficiently under diverse wind conditions.
-
In 2025, GE Renewable Energy introduced an advanced offshore turbine series with next-generation electric pitch and yaw drives, improving energy capture and operational reliability.
Nordex SE
Nordex SE, headquartered in Germany, is a key player in onshore wind turbine manufacturing, specializing in medium- and high-capacity turbines with sophisticated pitch and yaw drive systems. With a strong engineering and service network, Nordex provides turbines optimized for efficiency, durability, and grid compliance. Its role in the Wind Turbine Pitch and Yaw Drive Market is significant, delivering solutions that balance cost-effectiveness with high performance for renewable energy projects across Europe, Asia-Pacific, and the Americas.
-
In 2025, Nordex SE unveiled new turbine models with enhanced electric pitch and yaw systems, designed to increase operational efficiency, minimize maintenance, and meet growing renewable energy targets globally.
| Report Attributes | Details |
|---|---|
| Market Size in 2024 | USD 7.64 Billion |
| Market Size by 2032 | USD 13.62 Billion |
| CAGR | CAGR of 7.54% From 2025 to 2032 |
| Base Year | 2024 |
| Forecast Period | 2025-2032 |
| Historical Data | 2020-2022 |
| Report Scope & Coverage | Market Size, Segments Analysis, Competitive Landscape, Regional Analysis, DROC & SWOT Analysis, Forecast Outlook |
| Key Segments | • By Type (1000 W, 1000 W - 3000 W, and >3000 W) • BY Pitch System (Electric, Mechanical, and Hydraulic) • By Size (Small, Medium, and Large) • By End Use (Onshore and Offshore) |
| Regional Analysis/Coverage | North America (US, Canada, Mexico), Europe (Eastern Europe [Poland, Romania, Hungary, Turkey, Rest of Eastern Europe] Western Europe] Germany, France, UK, Italy, Spain, Netherlands, Switzerland, Austria, Rest of Western Europe]), Asia Pacific (China, India, Japan, South Korea, Vietnam, Singapore, Australia, Rest of Asia Pacific), Middle East & Africa (Middle East [UAE, Egypt, Saudi Arabia, Qatar, Rest of Middle East], Africa [Nigeria, South Africa, Rest of Africa], Latin America (Brazil, Argentina, Colombia, Rest of Latin America) |
| Company Profiles | Siemens Gamesa Renewable Energy, Vestas Wind Systems A/S, General Electric (GE) Renewable Energy, Nordex SE, Suzlon Energy Limited, Mitsubishi Heavy Industries (MHI), Enercon GmbH, Senvion (part of Siemens Gamesa), Goldwind, Envision Energy, Doosan Heavy Industries & Construction, Dongfang Electric Corporation (DEC), REpower Systems (part of Siemens Gamesa), Bharat Heavy Electricals Limited (BHEL), ABB Ltd., Bonfiglioli Riduttori S.p.A., NGC (Nordic Gear Company), Winergy (Daimler subsidiary), ZF Friedrichshafen AG, Vensys Energy AG. |
