image

3D Printing Elastomers Market Report Scope & Overview:

The 3D Printing Elastomers Market was valued at USD 274.69 million in 2023 and is supposed to reach USD 2095.24 million by 2031.  It is expected to grow at a CAGR of 28.9% over the forecast period 2024-2031.

The growth of the 3D printing elastomers market is primarily driven by increasing demand across various industries such as automotive, healthcare, and consumer goods due to their unique properties like flexibility and durability. Technological advancements in 3D printing technologies, enabling precise and efficient printing of elastomers, also contribute to market growth. Moreover, the expanding applications of elastomers in prototyping, customization, and product development further fuel market expansion. Additionally, growing investments in research and development to enhance material properties and printing processes are propelling market growth. The adoption of 3D printing elastomers for manufacturing complex and customized parts with reduced lead times and costs serves as a significant growth factor.

3D Printing Elastomers Market Revenue Analysis

Get More Information on 3D Printing Elastomers Market - Request Sample Report

Market Dynamics

Drivers

  • Expanding applications in prototyping, customization, and product development.

  • Growing R&D investments to enhance material properties and printing processes.

  • Increasing demand across industries like automotive, healthcare, and consumer goods due to unique properties such as flexibility and durability.

The surge in demand for 3D printing elastomers across automotive, healthcare, and consumer goods industries is propelled by their exceptional properties, including flexibility and durability. In automotive applications, elastomers offer solutions for prototyping intricate parts and producing customized components with superior resilience. Similarly, in the healthcare and consumer goods sectors, the ability to fabricate flexible and durable products tailored to specific needs drives the adoption of 3D printing elastomers, revolutionizing product development and customization processes.

Restraint

  • Limited material options and challenges in achieving desired material properties.

  • High initial setup costs associated with 3D printing equipment and materials.

Opportunities

  • Increasing focus on sustainable manufacturing practices driving demand for bio-based elastomers.

  • Adoption for manufacturing complex and customized parts with reduced lead times and costs.

The utilization of 3D printing elastomers offers a notable opportunity in manufacturing by facilitating the production of intricate and personalized components. This approach substantially cuts down on lead times and expenses traditionally associated with tooling and prototyping. By enabling rapid iteration and customization without compromising quality, 3D printing elastomers empower industries to swiftly meet diverse market demands while enhancing operational efficiency and cost-effectiveness.

Challenges

  • Regulatory hurdles related to material safety and compliance

Impact of Russia-Ukraine War:

The Russia-Ukraine war disrupts the 3D printing elastomers market through a domino effect.  Firstly, both countries are key suppliers of raw materials like butyl rubber, SBR, and carbon black, crucial for elastomer production. Finding alternative sources is difficult due to limited capacity elsewhere and the need for materials with matching performance.  Secondly, the war inflates energy costs, impacting production costs for manufacturers.  Labor shortages due to the conflict could further hinder manufacturing in the region.  Market dynamics are also affected, with some industries potentially shifting focus away from non-essential applications of 3D-printed elastomers.  Research and development of new materials and technologies could also be disrupted.

Impact of Economic Downturn:

During the period of economic downturn, tightened budgets led to some companies delaying or canceling projects using these materials, and overall investment in new technologies like 3D printing likely dipped. But here's the flip side: the focus on cost-effectiveness during the downturn made 3D printing's advantages like reduced waste and design flexibility more attractive. The impact wasn't uniform across industries though. Sectors reliant on discretionary spending, like high-end consumer products, might have seen a sharper decline, while those where 3D printing offers clear functional benefits, like healthcare, might have been more resilient. Overall, the economic downturn presented a complex situation for the 3D printing elastomers market, with both challenges and opportunities for companies that could effectively showcase the technology's cost-saving and innovative potential.

Market segmentation

By Form

  • Powder

  • Liquid

  • Filament

The powder form segment held the largest revenue share of more than 40% in the 3D printing elastomers market in 2023 due to its suitability for a wide array of applications. Powder-based elastomers offer precise control over material properties and can be utilized in various additive manufacturing processes like Selective Laser Sintering (SLS) and Powder Bed Fusion (PBF). Furthermore, advancements in powder-based 3D printing technologies have enhanced process efficiency and material performance, driving the dominance of the segment in the market.

By Material

  • Thermoplastic elastomer (TPE)

  • TPU (Thermoplastic polyurethane)

  • TPV (Thermoplastic vulcanizate)

  • Styrene-Butadiene Rubber (SBR) & Styrene-Butadiene-Styrene (SBS)

  • Others

  • Silicone

  • EPDM

  • Thermoplastic Copolyester

In 2023, the TPE segment led the material segment of the 3D printing elastomers market with the highest revenue share in 2023 attributed to its versatility, offering a balance of flexibility, durability, and ease of processing. TPEs are favored for their ability to be repeatedly melted and reshaped, making them ideal for various 3D printing applications. Furthermore, advancements in TPE formulations, providing enhanced properties such as chemical resistance and impact strength, have further propelled its adoption in diverse industries.

By Technology

  • FDM/FFF

  • SLS

  • SLA

  • DLP

  • Others

SLS technology dominated the technology segment of the 3D printing elastomers market with the highest revenue share of more than 37% in 2023 due to the capability of SLS to produce high-quality elastomer parts. SLS technology allows for the direct printing of elastomers from powdered materials, enabling intricate designs and complex geometries without the need for support structures. Additionally, advancements in SLS systems have improved printing speeds and material options, further enhancing its attractiveness for various industrial applications, thus solidifying its leading position in the technology segment.

By End-use Industry

  • Consumer Electronics

  • Industrial

  • Aerospace & Defense

  • Automotive

  • Healthcare

  • Others

3D-Printing-Elastomers-Market-Trend-By-End-use-Industry

Get Customized Report as per Your Business Requirement - Request For Customized Report

Regional Analysis

North America dominated the 3D Printing Elastomers Market with the highest revenue share of more than 32% in 2023. The region’s robust infrastructure supports technological advancements and innovation in 3D printing which drives the 3D printing elastomers market in this region. A strong presence of key players and established industries, particularly in automotive, healthcare, and aerospace, drives demand for elastomers in manufacturing customized and high-performance parts. Favorable government initiatives and investments in research and development further propel market growth.

Asia Pacific is predicted to grow at the highest CAGR in the 3D Printing Elastomers Market during the forecast period. Asia Pacific's anticipated leading CAGR is primarily attributable to the region's burgeoning manufacturing sector and rapid industrialization. Additionally, increasing investments in additive manufacturing technologies, coupled with government initiatives promoting innovation and technological adoption, are significant drivers. Moreover, the region's expanding consumer base and rising disposable incomes are fueling demand for customized products, further propelling market growth in Asia Pacific.

3D-Printing-Elastomers-Market-Trend-By-Region

REGIONAL COVERAGE:

North America

  • US

  • Canada

  • Mexico

Europe

  • Eastern Europe

    • Poland

    • Romania

    • Hungary

    • Turkey

    • Rest of Eastern Europe

  • Western Europe

    • Germany

    • France

    • UK

    • Italy

    • Spain

    • Netherlands

    • Switzerland

    • Austria

    • Rest of Western Europe

Asia Pacific

  • China

  • India

  • Japan

  • South Korea

  • Vietnam

  • Singapore

  • Australia

  • Rest of Asia Pacific

Middle East & Africa

  • Middle East

    • UAE

    • Egypt

    • Saudi Arabia

    • Qatar

    • Rest of the Middle East

  • Africa

    • Nigeria

    • South Africa

    • Rest of Africa

Latin America

  • Brazil

  • Argentina

  • Colombia

  • Rest of Latin America

 Key Players:

The major key players are Carbon Inc, Henkel, BASF SE, Dow Chemical Company, Formlabs, 3D Systems Inc, Stratasys Ltd, Proto Labs Inc, Materialise NV, EOS, Evonik Industries AG, Arkema SA, Sinterit, EnvisionTEC, The Lubrizol Corporation, ExOne, Zortrax, HP Development Company L.P., LANXESS, Impossible Objects, and Voxeljet AG.

Carbon Inc-Company Financial Analysis

Recent Development:

  • In Oct 2023, Evonik expanded its portfolio of elastomeric materials for powder bed In October 2023, Evonik expanded its range of elastomeric materials for powder bed fusion 3D printing technologies by introducing INFINAM® TPA 4006 P, a new powder grade specifically optimized for all types of open-source SLS 3D printing machines.

  • In September 2023, Carbon unveiled its latest elastomer material, EPU 46, boasting high-performance properties, exceptional durability, and a variety of color options. This versatile material is suitable for a wide range of applications including saddles, footwear, and grips.

  • Also in September 2023, Formlabs introduced Alumina 4N Resin, a pure ceramic material that enables the cost-effective production of 3D printed ceramics for aerospace, automotive, and industrial casting applications, offering a significant cost advantage over leading alternatives.

  • In April 2023, Arkema launched "EASY3D," an online on-demand additive manufacturing platform developed in collaboration with 3YourMind. This innovative platform is designed to streamline on-demand production for part manufacturers within an optimized ecosystem.

  • In October 2021, BASF Forward AM introduced its Ultrafuse Flexible Filament portfolio of materials for extrusion-based polymer 3D printers, expanding its range of innovative solutions for additive manufacturing.


3D Printing Elastomers Market Report Scope
Report Attributes Details
Market Size in 2023 US$ 274.69 Million
Market Size by 2031 US$ 2095.24 Million
CAGR CAGR of 28.9% From 2024 to 2031
Base Year 2023
Forecast Period 2024-2031
Historical Data 2020-2022
Report Scope & Coverage Market Size, Segments Analysis, Competitive  Landscape, Regional Analysis, DROC & SWOT Analysis, Forecast Outlook
Key Segments • By Form (Powder, Liquid, and Filament)
• By Material (TPE, SBR & SBS, and Others)
• By Technology (FDM/FFF, SLS, SLA, DLP, and Others)
• By End-use Industry (Consumer Electronics, Industrial, Aerospace & Defense, Automotive, Healthcare, and Others)
Regional Analysis/Coverage North America (US, Canada, Mexico), Europe (Eastern Europe [Poland, Romania, Hungary, Turkey, Rest of Eastern Europe] Western Europe] Germany, France, UK, Italy, Spain, Netherlands, Switzerland, Austria, Rest of Western Europe]), Asia Pacific (China, India, Japan, South Korea, Vietnam, Singapore, Australia, Rest of Asia Pacific), Middle East & Africa (Middle East [UAE, Egypt, Saudi Arabia, Qatar, Rest of Middle East], Africa [Nigeria, South Africa, Rest of Africa], Latin America (Brazil, Argentina, Colombia, Rest of Latin America)
Company Profiles
Carbon Inc, Henkel, BASF SE, Dow Chemical Company, Formlabs, 3D Systems Inc, Stratasys Ltd, Proto Labs Inc, Materialise NV, EOS, Evonik Industries AG, Arkema SA, Sinterit, EnvisionTEC, The Lubrizol Corporation, ExOne, Zortrax, HP Development Company L.P., LANXESS, Impossible Objects, and Voxeljet AG
Market Drivers • Expanding applications in prototyping, customization, and product development.
• Growing R&D investments to enhance material properties and printing processes.
• Increasing demand across industries like automotive, healthcare, and consumer goods due to unique properties such as flexibility and durability.
Market Restraints • Limited material options and challenges in achieving desired material properties.
• High initial setup costs associated with 3D printing equipment and materials.
 

Frequently Asked Questions

Ans: The 3D Printing Elastomers Market was valued at USD 274.69 million in 2023.

Ans: The expected CAGR of the global 3D Printing Elastomers Market during the forecast period is 28.9%.

Ans: The primary factors driving the 3D Printing Elastomers Market include increasing demand across industries for customized and complex parts and technological advancements enhancing material properties and printing processes.

Ans: Challenges hindering the growth of the 3D Printing Elastomers Market include limited material options with desired properties and high initial setup costs associated with 3D printing equipment and materials.

Ans: Consumer Electronics led the End-use Industry segment of the 3D Printing Elastomers Market in 2023.

TABLE OF CONTENTS


1. Introduction
1.1 Market Definition
1.2 Scope
1.3 Research Assumptions


2. Industry Flowchart


3. Research Methodology


4. Market Dynamics
4.1 Drivers
4.2 Restraints
4.3 Opportunities
4.4 Challenges


5. Impact Analysis
5.1 Impact of Russia-Ukraine Crisis
5.2 Impact of Economic Slowdown on Major Countries
5.2.1 Introduction
5.2.2 United States
5.2.3 Canada
5.2.4 Germany
5.2.5 France
5.2.6 UK
5.2.7 China
5.2.8 Japan
5.2.9 South Korea
5.2.10 India


6. Value Chain Analysis


7. Porter’s 5 Forces Model


8.  Pest Analysis


9. Average Selling Price
9.1 North America
9.2 Europe
9.3 Asia Pacific
9.4 Latin America
9.5 Middle East & Africa


10. 3D Printing Elastomers Market, By Form
10.1 Introduction
10.2 Trend Analysis
10.3 Powder
10.4 Liquid
10.5 Filament


11. 3D Printing Elastomers Market, By Material
11.1 Introduction
11.2 Trend Analysis
11.3 Thermoplastic elastomer (TPE)
11.3.1 TPU (Thermoplastic polyurethane)
11.3.2 TPV (Thermoplastic vulcanizate)
11.4 Styrene-Butadiene Rubber (SBR) & Styrene-Butadiene-Styrene (SBS)
11.5 Others
11.5.1 Silicone
11.5.2 EPDM
11.5.3 Thermoplastic Copolyester


12. 3D Printing Elastomers Market, By Technology
12.1 Introduction
12.2 Trend Analysis
12.3 FDM/FFF
12.4 SLS
12.5 SLA
12.6 DLP
12.7 Others


13. 3D Printing Elastomers Market, By End-use Industry
13.1 Introduction
13.2 Trend Analysis
13.3 Consumer Electronics
13.4 Industrial
13.5 Aerospace & Defense
13.6 Automotive
13.7 Healthcare
13.8 Others


14. Regional Analysis
14.1 Introduction
14.2 North America
14.2.1 USA
14.2.2 Canada
14.2.3 Mexico
14.3 Europe
14.3.1 Eastern Europe

14.3.1.1 Poland
14.3.1.2 Romania
14.3.1.3 Hungary
14.3.1.4 Turkey
14.3.1.5 Rest of Eastern Europe
14.3.2 Western Europe
14.3.2.1 Germany
14.3.2.2 France
14.3.2.3 UK
14.3.2.4 Italy
14.3.2.5 Spain
14.3.2.6 Netherlands
14.3.2.7 Switzerland
14.3.2.8 Austria
14.3.2.9 Rest of Western Europe
14.4 Asia-Pacific
14.4.1 China
14.4.2 India
14.4.3 Japan
14.4.4 South Korea
14.4.5 Vietnam
14.4.6 Singapore
14.4.7 Australia
14.4.8 Rest of Asia Pacific
14.5 The Middle East & Africa
14.5.1 Middle East

14.5.1.1 UAE
14.5.1.2 Egypt
14.5.1.3 Saudi Arabia
14.5.1.4 Qatar
14.5.1.5 Rest of the Middle East
14.5.2 Africa
14.5.2.1 Nigeria
14.5.2.2 South Africa
14.5.2.3 Rest of Africa
14.6 Latin America
14.6.1 Brazil
14.6.2 Argentina
14.6.3 Colombia
14.6.4 Rest of Latin America


15. Company Profiles
15.1 Carbon Inc.
15.1.1 Company Overview
15.1.2 Financials
15.1.3 Products/ Services Offered
15.1.4 SWOT Analysis
15.1.5 The SNS View
15.2 Henkel
15.2.1 Company Overview
15.2.2 Financials
15.2.3 Products/ Services Offered
15.2.4 SWOT Analysis
15.2.5 The SNS View
15.3 BASF SE
15.3.1 Company Overview
15.3.2 Financials
15.3.3 Products/ Services Offered
15.3.4 SWOT Analysis
15.3.5 The SNS View
15.4 Dow Chemical Company
15.4 Company Overview
15.4.2 Financials
15.4.3 Products/ Services Offered
15.4.4 SWOT Analysis
15.4.5 The SNS View
15.5 Formlabs.
15.5.1 Company Overview
15.5.2 Financials
15.5.3 Products/ Services Offered
15.5.4 SWOT Analysis
15.5.5 The SNS View
15.6 3D Systems Inc.
15.6.1 Company Overview
15.6.2 Financials
15.6.3 Products/ Services Offered
15.6.4 SWOT Analysis
15.6.5 The SNS View
15.7 Stratasys Ltd.
15.7.1 Company Overview
15.7.2 Financials
15.7.3 Products/ Services Offered
15.7.4 SWOT Analysis
15.7.5 The SNS View
15.8 Proto Labs Inc.
15.8.1 Company Overview
15.8.2 Financials
15.8.3 Products/ Services Offered
15.8.4 SWOT Analysis
15.8.5 The SNS View
15.9 Materialise NV
15.9.1 Company Overview
15.9.2 Financials
15.9.3 Products/ Services Offered
15.9.4 SWOT Analysis
15.9.5 The SNS View
15.10 EOS
15.10.1 Company Overview
15.10.2 Financials
15.10.3 Products/ Services Offered
15.10.4 SWOT Analysis
15.10.5 The SNS View
15.11 Evonik Industries AG
15.11.1 Company Overview
15.11.2 Financials
15.11.3 Products/ Services Offered
15.11.4 SWOT Analysis
15.11.5 The SNS View
15.12 Arkema SA
15.12.1 Company Overview
15.12.2 Financials
15.12.3 Products/ Services Offered
15.12.4 SWOT Analysis
15.12.5 The SNS View
15.13 Sinterit
15.13.1 Company Overview
15.13.2 Financials
15.13.3 Products/ Services Offered
15.13.4 SWOT Analysis
15.13.5 The SNS View
15.14 EnvisionTEC
15.14.1 Company Overview
15.14.2 Financials
15.14.3 Products/ Services Offered
15.14.4 SWOT Analysis
15.14.5 The SNS View
15.15 The Lubrizol Corporation
15.15.1 Company Overview
15.15.2 Financials
15.15.3 Products/ Services Offered
15.15.4 SWOT Analysis
15.15.5 The SNS View
15.16 ExOne
15.16.1 Company Overview
15.16.2 Financials
15.16.3 Products/ Services Offered
15.16.4 SWOT Analysis
15.16.5 The SNS View
15.17 Zortrax
15.17.1 Company Overview
15.17.2 Financials
15.17.3 Products/ Services Offered
15.17.4 SWOT Analysis
15.17.5 The SNS View
15.18 HP Development Company L.P.
15.18.1 Company Overview
15.18.2 Financials
15.18.3 Products/ Services Offered
15.18.4 SWOT Analysis
15.18.5 The SNS View
15.19 LANXESS
15.19.1 Company Overview
15.19.2 Financials
15.19.3 Products/ Services Offered
15.19.4 SWOT Analysis
15.19.5 The SNS View
15.20 Impossible Objects
15.20.1 Company Overview
15.20.2 Financials
15.20.3 Products/ Services Offered
15.20.4 SWOT Analysis
15.20.5 The SNS View
15.21 Voxeljet AG
15.21.1 Company Overview
15.21.2 Financials
15.21.3 Products/ Services Offered
15.21.4 SWOT Analysis
15.21.5 The SNS View


16. Competitive Landscape
16.1 Competitive Benchmarking
16.2 Market Share Analysis
16.3 Recent Developments
16.3.1 Industry News
16.3.2 Company News
16.3.3 Mergers & Acquisitions


17. USE Cases and Best Practices


18. Conclusion

An accurate research report requires proper strategizing as well as implementation. There are multiple factors involved in the completion of good and accurate research report and selecting the best methodology to compete the research is the toughest part. Since the research reports we provide play a crucial role in any company’s decision-making process, therefore we at SNS Insider always believe that we should choose the best method which gives us results closer to reality. This allows us to reach at a stage wherein we can provide our clients best and accurate investment to output ratio.

Each report that we prepare takes a timeframe of 350-400 business hours for production. Starting from the selection of titles through a couple of in-depth brain storming session to the final QC process before uploading our titles on our website we dedicate around 350 working hours. The titles are selected based on their current market cap and the foreseen CAGR and growth.


The 5 steps process:

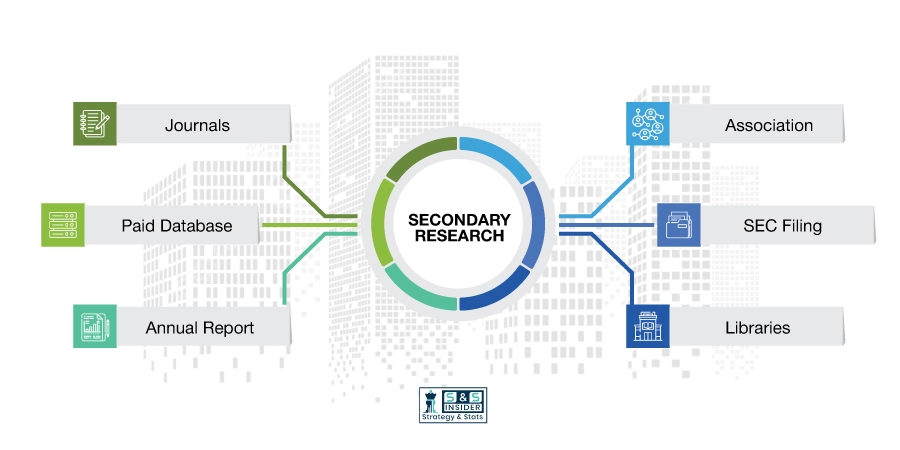
Step 1: Secondary Research:

Secondary Research or Desk Research is as the name suggests is a research process wherein, we collect data through the readily available information. In this process we use various paid and unpaid databases which our team has access to and gather data through the same. This includes examining of listed companies’ annual reports, Journals, SEC filling etc. Apart from this our team has access to various associations across the globe across different industries. Lastly, we have exchange relationships with various university as well as individual libraries.

Secondary Research

Step 2: Primary Research

When we talk about primary research, it is a type of study in which the researchers collect relevant data samples directly, rather than relying on previously collected data.  This type of research is focused on gaining content specific facts that can be sued to solve specific problems. Since the collected data is fresh and first hand therefore it makes the study more accurate and genuine.

We at SNS Insider have divided Primary Research into 2 parts.

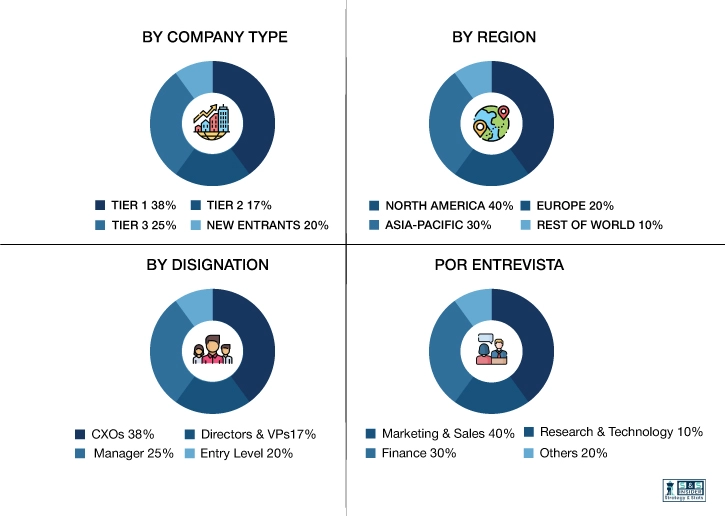
Part 1 wherein we interview the KOLs of major players as well as the upcoming ones across various geographic regions. This allows us to have their view over the market scenario and acts as an important tool to come closer to the accurate market numbers. As many as 45 paid and unpaid primary interviews are taken from both the demand and supply side of the industry to make sure we land at an accurate judgement and analysis of the market.

This step involves the triangulation of data wherein our team analyses the interview transcripts, online survey responses and observation of on filed participants. The below mentioned chart should give a better understanding of the part 1 of the primary interview.

Primary Research

Part 2: In this part of primary research the data collected via secondary research and the part 1 of the primary research is validated with the interviews from individual consultants and subject matter experts.

Consultants are those set of people who have at least 12 years of experience and expertise within the industry whereas Subject Matter Experts are those with at least 15 years of experience behind their back within the same space. The data with the help of two main processes i.e., FGDs (Focused Group Discussions) and IDs (Individual Discussions). This gives us a 3rd party nonbiased primary view of the market scenario making it a more dependable one while collation of the data pointers.

Step 3: Data Bank Validation

Once all the information is collected via primary and secondary sources, we run that information for data validation. At our intelligence centre our research heads track a lot of information related to the market which includes the quarterly reports, the daily stock prices, and other relevant information. Our data bank server gets updated every fortnight and that is how the information which we collected using our primary and secondary information is revalidated in real time.

Data Bank Validation

Step 4: QA/QC Process

After all the data collection and validation our team does a final level of quality check and quality assurance to get rid of any unwanted or undesired mistakes. This might include but not limited to getting rid of the any typos, duplication of numbers or missing of any important information. The people involved in this process include technical content writers, research heads and graphics people. Once this process is completed the title gets uploader on our platform for our clients to read it.

Step 5: Final QC/QA Process:

This is the last process and comes when the client has ordered the study. In this process a final QA/QC is done before the study is emailed to the client. Since we believe in giving our clients a good experience of our research studies, therefore, to make sure that we do not lack at our end in any way humanly possible we do a final round of quality check and then dispatch the study to the client.

Start a Conversation

Hi! Click one of our member below to chat on Phone