image

Automotive Simulation Market Report Scope & Overview:

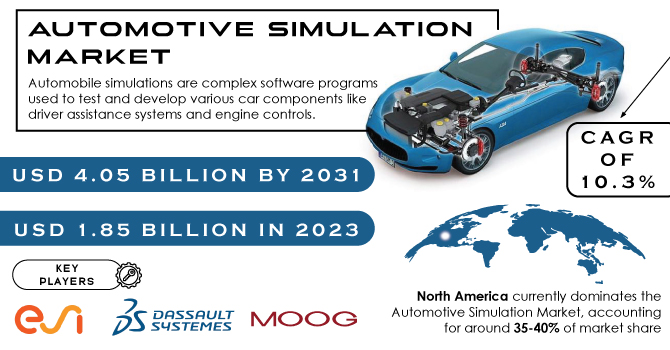
The Automotive Simulation Market  Size was valued at USD 1.85 billion in 2023 and is expected to reach USD 4.05 billion by 2031 and grow at a CAGR of  10.3% over the forecast period 2024-2031.

Automobile simulations are complex software programs used to test and develop various car components like driver assistance systems and engine controls.  These simulations are crucial for the automotive industry as they allow for safe and controlled testing,  leading to better product quality and reduced development time. Originally used for training purposes,  automotive simulations have evolved to play a vital role in research, development, and even production.  In the production phase, simulations can identify defects in components before they are installed in the car, saving time and money.  Simulations can be used to train users on new technologies, promoting smoother adoption. Overall, automotive simulation serves as a powerful tool for ensuring a car's functionality and  facilitating the development and implementation of new technologies within the automotive industry.

Automotive-Simulation-Market Revenue Analysis

Get more information on Automotive Simulation Market - Request Free Sample Report

MARKET DYNAMICS:

KEY DRIVERS:

  • Advanced Simulation Techniques Enhance Dependability of Virtual Testing in Automotive Applications

Advancements in simulation tools like CFD, FEA, and real-time simulation are boosting the accuracy and realism of virtual testing in the automotive industry. This translates to more reliable simulations, allowing for better assessment of car components and functionalities before physical prototypes are built.

  • Electric Vehicle Modelling Drives Innovation in Battery Performance, Range, and Charging Infrastructure

RESTRAINTS:

  • High Initial Investment Limits Advanced Simulation Adoption for Smaller Automakers
  • Complex Software Slows Down Integration of Simulation Tools in Car Design

Advanced simulation software offers immense benefits for car design, but its complexity can be a hurdle.  The software often requires specialized training, and engineers may need significant time to become proficient. This learning curve can slow down the integration of simulation tools into the overall car development process.

OPPORTUNITIES:

  • Electric vehicle simulation helps optimize efficiency and predict range.

  • Automotive simulation can help new automakers in emerging markets design affordable cars.

CHALLENGES:

  • Shifting Production & Global Competition Threatens Automotive Simulation Market Growth

IMPACT OF RUSSIA-UKRAINE WAR

The Russia-Ukraine war has disrupted the automotive simulation market, impacting it by an estimated 5-10% in the short term. Disruptions to the global supply chain, particularly for key components like semiconductors, have caused delays and production slowdowns for simulation hardware. Additionally, sanctions on Russia, a significant consumer of automotive technology, have limited market access for some simulation software providers. The war has also exacerbated existing chip shortages, further hindering the development and deployment of new simulation tools. While the long-term impact remains to be seen, the current situation presents challenges for the automotive simulation market, requiring adaptation and innovation to overcome these hurdles.

IMPACT OF ECONOMIC SLOWDOWN

An economic slowdown is expected to dampen the Automotive Simulation Market by an estimated 3-10%. Reduced investments in research and development (R&D) are a primary factor. Automakers tighten their budgets during economic downturns, leading to less spending on advanced technologies like simulation software. Additionally, lower demand for new vehicles translates to a decreased need for rigorous testing and development, further impacting the simulation market.  However, some simulation vendors might see increased interest in cost-effective design solutions as automakers look to optimize spending. The overall impact depends on the severity of the slowdown, but it presents both challenges and potential opportunities for the automotive simulation market.

KEY MARKET SEGMENTS:
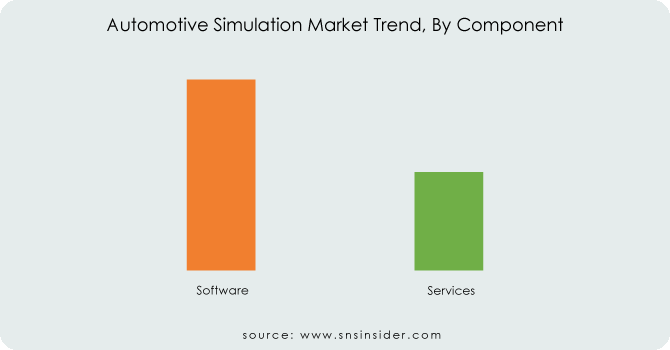
By Component:

  • Software

  • Services

Software is the dominating sub-segment in the Automotive Simulation Market by component, accounting for around 60% of market share. The dominance of software is fueled by the increasing complexity of vehicles and the need for sophisticated virtual testing tools. Software allows for a wider range of simulations at a lower cost compared to physical prototypes.

Automotive-Simulation-Market-Trend-By-Component

Need any customization research on Automotive Simulation Market - Enquiry Now

By Application:

  • Prototyping

  • Testing

Testing is the dominating sub-segment in the Automotive Simulation Market by application holding about 50% of market share. The dominance of testing can be attributed to the critical role simulation plays in ensuring vehicle safety, performance, and compliance with regulations.  Simulations allow for testing various driving scenarios and environmental conditions without real-world risks.

By End-User:

  • OEMs

  • Automotive Component Manufacturers

  • Regulatory Bodies

OEMs (Original Equipment Manufacturers) is the dominating sub-segment in the Automotive Simulation Market holding above 50% of market share. OEMs rely on simulation for various stages of car development, from initial design concepts to final testing and validation.

REGIONAL ANALYSES

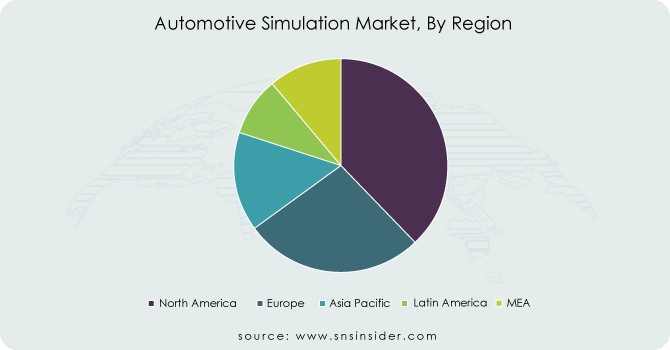
North America currently dominates the Automotive Simulation Market, accounting for around 35-40% of market share This dominance is driven by the presence of major automotive manufacturers and a strong focus on investigate and improvement in the region. Europe is the second highest region in this market holding 30-35% of the share, boasting a well-established automotive industry and stringent security controls that require advanced simulation tools. The Asia Pacific region is expected to witness the fastest growth with an estimated growth rate of approximately 12-15%. This quick rise is fueled by variables like developing automotive industry, expanding government investments in R&D, and a growing demand for electric vehicles.

Automotive-Simulation-Market-By-Region

REGIONAL COVERAGE:

North America

  • US

  • Canada

  • Mexico

Europe

  • Eastern Europe

    • Poland

    • Romania

    • Hungary

    • Turkey

    • Rest of Eastern Europe

  • Western Europe

    • Germany

    • France

    • UK

    • Italy

    • Spain

    • Netherlands

    • Switzerland

    • Austria

    • Rest of Western Europe

Asia Pacific

  • China

  • India

  • Japan

  • South Korea

  • Vietnam

  • Singapore

  • Australia

  • Rest of Asia Pacific

Middle East & Africa

  • Middle East

    • UAE

    • Egypt

    • Saudi Arabia

    • Qatar

    • Rest of the Middle East

  • Africa

    • Nigeria

    • South Africa

    • Rest of Africa

Latin America

  • Brazil

  • Argentina

  • Colombia

  • Rest of Latin America

KEY PLAYERS

The major key players are ESI Group (Germany), PG Automotive GmbH (Germany), dSPACE GmbH (Germany), ANSYS, Inc. (US), MOOG INC. (US), Dassault Systèmes (France), TESIS GmbH (Germany), Siemens PLM (US) and other key players.

Dassault Systèmes (France)-Company Financial Analysis

RECENT DEVELOPMENTS:

  • In June 2022 - NI acquired monoDrive, a leader in ADAS simulation software, to boost its presence in the autonomous driving sector. This will help carmakers streamline development, testing, and deployment of safer self-driving systems by bridging the gap between simulation and real-world testing, currently hampered by fragmented tools and inefficient processes.

Automotive Simulation Market Report Scope:

Report Attributes Details
Market Size in 2023 US$ 1.85 Billion
Market Size by 2031 US$ 4.05 Billion
CAGR CAGR of 10.3% From 2024 to 2031
Base Year 2023
Forecast Period 2024-2031
Historical Data 2020-2022
Report Scope & Coverage Market Size, Segments Analysis, Competitive  Landscape, Regional Analysis, DROC & SWOT Analysis, Forecast Outlook
Key Segments • by Component (Software, Services)
• by Application (Prototyping, Testing)
• by End-User (OEMs, Automotive Component Manufacturers, Regulatory Bodies)
Regional Analysis/Coverage North America (US, Canada, Mexico), Europe (Eastern Europe [Poland, Romania, Hungary, Turkey, Rest of Eastern Europe] Western Europe] Germany, France, UK, Italy, Spain, Netherlands, Switzerland, Austria, Rest of Western Europe]), Asia Pacific (China, India, Japan, South Korea, Vietnam, Singapore, Australia, Rest of Asia Pacific), Middle East & Africa (Middle East [UAE, Egypt, Saudi Arabia, Qatar, Rest of Middle East], Africa [Nigeria, South Africa, Rest of Africa], Latin America (Brazil, Argentina, Colombia, Rest of Latin America)
Company Profiles ESI Group (Germany), PG Automotive GmbH (Germany), dSPACE GmbH (Germany), ANSYS, Inc. (US), MOOG INC. (US), AImotive, Dassault Systèmes (France), TESIS GmbH (Germany), Siemens PLM (US)
Key Drivers • Advanced Simulation Techniques Enhance Dependability of Virtual Testing in Automotive Applications
RESTRAINTS

• High Initial Investment Limits Advanced Simulation Adoption for Smaller Automakers

• Complex Software Slows Down Integration of Simulation Tools in Car Design

Frequently Asked Questions

Ans:- The expected CAGR of the global Automotive Simulation Market  during the forecast period is 10.3%.

Ans:- ESI Group (Germany), PG Automotive GmbH (Germany), dSPACE GmbH (Germany), ANSYS, Inc. (US), MOOG INC. (US), AImotive, Dassault Systèmes (France), TESIS GmbH (Germany), Siemens PLM (US) are the most prominent players in the market.

Ans:- Real-time control in simulation software complicates and old rules may impede the Market's growth are the primary market restraints for Automotive Simulation Market.

Ans: Software is the dominating sub-segment accounting for around 60% of market share.

Ans:- The study includes a comprehensive analysis of market trends, as well as present and future market forecasts. DROC analysis, as well as impact analysis for the projected period. Porter’s five forces analysis aids in the study of buyer and supplier potential as well as the competitive landscape etc.

TABLE OF CONTENTS

1. Introduction
1.1 Market Definition
1.2 Scope
1.3 Research Assumptions

2. Industry Flowchart

3. Research Methodology

4. Market Dynamics
4.1 Drivers
4.2 Restraints
4.3 Opportunities
4.4 Challenges

5. Impact Analysis
5.1 Impact of Russia-Ukraine Crisis
5.2 Impact of Economic Slowdown on Major Countries
5.2.1 Introduction
5.2.2 United States
5.2.3 Canada
5.2.4 Germany
5.2.5 France
5.2.6 UK
5.2.7 China
5.2.8 Japan
5.2.9 South Korea
5.2.10 India

6. Value Chain Analysis

7. Porter’s 5 Forces Model

8. Pest Analysis

9. Automotive Simulation Market Segmentation, By Component
9.1 Introduction
9.2 Trend Analysis
9.3 Software
9.4 Services

10. Automotive Simulation Market Segmentation, By Application
10.1 Introduction
10.2 Trend Analysis
10.3 Prototyping
10.4 Testing

11. Automotive Simulation Market Segmentation, By End-User
11.1 Introduction
11.2 Trend Analysis
11.3 OEMs
11.4 Automotive Component Manufacturers
11.5 Regulatory Bodies

12. Regional Analysis
12.1 Introduction
12.2 North America
12.2.1 Trend Analysis
12.2.2 North America Automotive Simulation Market Segmentation, By Country
12.2.3 North America Automotive Simulation Market Segmentation, By Component
12.2.4 North America Automotive Simulation Market Segmentation, By Application
12.2.5 North America Automotive Simulation Market Segmentation, By End-User
12.2.6 USA
12.2.6.1 USA Automotive Simulation Market Segmentation, By Component
12.2.6.2 USA Automotive Simulation Market Segmentation, By Application
12.2.6.3 USA Automotive Simulation Market Segmentation, By End-User
12.2.7 Canada
12.2.7.1 Canada Automotive Simulation Market Segmentation, By Component
12.2.7.2 Canada Automotive Simulation Market Segmentation, By Application
12.2.7.3 Canada Automotive Simulation Market Segmentation, By End-User
12.2.8 Mexico
12.2.8.1 Mexico Automotive Simulation Market Segmentation, By Component
12.2.8.2 Mexico Automotive Simulation Market Segmentation, By Application
12.2.8.3 Mexico Automotive Simulation Market Segmentation, By End-User
12.3 Europe
12.3.1 Trend Analysis
12.3.2 Eastern Europe
12.3.2.1 Eastern Europe Automotive Simulation Market Segmentation, by Country
12.3.2.2 Eastern Europe Automotive Simulation Market Segmentation, By Component
12.3.2.3 Eastern Europe Automotive Simulation Market Segmentation, By Application
12.3.2.4 Eastern Europe Automotive Simulation Market Segmentation, By End-User
12.3.2.5 Poland
12.3.2.5.1 Poland Automotive Simulation Market Segmentation, By Component
12.3.2.5.2 Poland Automotive Simulation Market Segmentation, By Application
12.3.2.5.3 Poland Automotive Simulation Market Segmentation, By End-User
12.3.2.6 Romania
12.3.2.6.1 Romania Automotive Simulation Market Segmentation, By Component
12.3.2.6.2 Romania Automotive Simulation Market Segmentation, By Application
12.3.2.6.4 Romania Automotive Simulation Market Segmentation, By End-User
12.3.2.7 Hungary
12.3.2.7.1 Hungary Automotive Simulation Market Segmentation, By Component
12.3.2.7.2 Hungary Automotive Simulation Market Segmentation, By Application
12.3.2.7.3 Hungary Automotive Simulation Market Segmentation, By End-User
12.3.2.8 Turkey
12.3.2.8.1 Turkey Automotive Simulation Market Segmentation, By Component
12.3.2.8.2 Turkey Automotive Simulation Market Segmentation, By Application
12.3.2.8.3 Turkey Automotive Simulation Market Segmentation, By End-User
12.3.2.9 Rest of Eastern Europe
12.3.2.9.1 Rest of Eastern Europe Automotive Simulation Market Segmentation, By Component
12.3.2.9.2 Rest of Eastern Europe Automotive Simulation Market Segmentation, By Application
12.3.2.9.3 Rest of Eastern Europe Automotive Simulation Market Segmentation, By End-User
12.3.3 Western Europe
12.3.3.1 Western Europe Automotive Simulation Market Segmentation, by Country
12.3.3.2 Western Europe Automotive Simulation Market Segmentation, By Component
12.3.3.3 Western Europe Automotive Simulation Market Segmentation, By Application
12.3.3.4 Western Europe Automotive Simulation Market Segmentation, By End-User
12.3.3.5 Germany
12.3.3.5.1 Germany Automotive Simulation Market Segmentation, By Component
12.3.3.5.2 Germany Automotive Simulation Market Segmentation, By Application
12.3.3.5.3 Germany Automotive Simulation Market Segmentation, By End-User
12.3.3.6 France
12.3.3.6.1 France Automotive Simulation Market Segmentation, By Component
12.3.3.6.2 France Automotive Simulation Market Segmentation, By Application
12.3.3.6.3 France Automotive Simulation Market Segmentation, By End-User
12.3.3.7 UK
12.3.3.7.1 UK Automotive Simulation Market Segmentation, By Component
12.3.3.7.2 UK Automotive Simulation Market Segmentation, By Application
12.3.3.7.3 UK Automotive Simulation Market Segmentation, By End-User
12.3.3.8 Italy
12.3.3.8.1 Italy Automotive Simulation Market Segmentation, By Component
12.3.3.8.2 Italy Automotive Simulation Market Segmentation, By Application
12.3.3.8.3 Italy Automotive Simulation Market Segmentation, By End-User
12.3.3.9 Spain
12.3.3.9.1 Spain Automotive Simulation Market Segmentation, By Component
12.3.3.9.2 Spain Automotive Simulation Market Segmentation, By Application
12.3.3.9.3 Spain Automotive Simulation Market Segmentation, By End-User
12.3.3.10 Netherlands
12.3.3.10.1 Netherlands Automotive Simulation Market Segmentation, By Component
12.3.3.10.2 Netherlands Automotive Simulation Market Segmentation, By Application
12.3.3.10.3 Netherlands Automotive Simulation Market Segmentation, By End-User
12.3.3.11 Switzerland
12.3.3.11.1 Switzerland Automotive Simulation Market Segmentation, By Component
12.3.3.11.2 Switzerland Automotive Simulation Market Segmentation, By Application
12.3.3.11.3 Switzerland Automotive Simulation Market Segmentation, By End-User
12.3.3.1.12 Austria
12.3.3.12.1 Austria Automotive Simulation Market Segmentation, By Component
12.3.3.12.2 Austria Automotive Simulation Market Segmentation, By Application
12.3.3.12.3 Austria Automotive Simulation Market Segmentation, By End-User
12.3.3.13 Rest of Western Europe
12.3.3.13.1 Rest of Western Europe Automotive Simulation Market Segmentation, By Component
12.3.3.13.2 Rest of Western Europe Automotive Simulation Market Segmentation, By Application
12.3.3.13.3 Rest of Western Europe Automotive Simulation Market Segmentation, By End-User
12.4 Asia-Pacific
12.4.1 Trend Analysis
12.4.2 Asia-Pacific Automotive Simulation Market Segmentation, by Country
12.4.3 Asia-Pacific Automotive Simulation Market Segmentation, By Component
12.4.4 Asia-Pacific Automotive Simulation Market Segmentation, By Application
12.4.5 Asia-Pacific Automotive Simulation Market Segmentation, By End-User
12.4.6 China
12.4.6.1 China Automotive Simulation Market Segmentation, By Component
12.4.6.2 China Automotive Simulation Market Segmentation, By Application
12.4.6.3 China Automotive Simulation Market Segmentation, By End-User
12.4.7 India
12.4.7.1 India Automotive Simulation Market Segmentation, By Component
12.4.7.2 India Automotive Simulation Market Segmentation, By Application
12.4.7.3 India Automotive Simulation Market Segmentation, By End-User
12.4.8 Japan
12.4.8.1 Japan Automotive Simulation Market Segmentation, By Component
12.4.8.2 Japan Automotive Simulation Market Segmentation, By Application
12.4.8.3 Japan Automotive Simulation Market Segmentation, By End-User
12.4.9 South Korea
12.4.9.1 South Korea Automotive Simulation Market Segmentation, By Component
12.4.9.2 South Korea Automotive Simulation Market Segmentation, By Application
12.4.9.3 South Korea Automotive Simulation Market Segmentation, By End-User
12.4.10 Vietnam
12.4.10.1 Vietnam Automotive Simulation Market Segmentation, By Component
12.4.10.2 Vietnam Automotive Simulation Market Segmentation, By Application
12.4.10.3 Vietnam Automotive Simulation Market Segmentation, By End-User
12.4.11 Singapore
12.4.11.1 Singapore Automotive Simulation Market Segmentation, By Component
12.4.11.2 Singapore Automotive Simulation Market Segmentation, By Application
12.4.11.3 Singapore Automotive Simulation Market Segmentation, By End-User
12.4.12 Australia
12.4.12.1 Australia Automotive Simulation Market Segmentation, By Component
12.4.12.2 Australia Automotive Simulation Market Segmentation, By Application
12.4.12.3 Australia Automotive Simulation Market Segmentation, By End-User
12.4.13 Rest of Asia-Pacific
12.4.13.1 Rest of Asia-Pacific Automotive Simulation Market Segmentation, By Component
12.4.13.2 Rest of Asia-Pacific Automotive Simulation Market Segmentation, By Application
12.4.13.3 Rest of Asia-Pacific Automotive Simulation Market Segmentation, By End-User
12.5 Middle East & Africa
12.5.1 Trend Analysis
12.5.2 Middle East
12.5.2.1 Middle East Automotive Simulation Market Segmentation, by Country
12.5.2.2 Middle East Automotive Simulation Market Segmentation, By Component
12.5.2.3 Middle East Automotive Simulation Market Segmentation, By Application
12.5.2.4 Middle East Automotive Simulation Market Segmentation, By End-User
12.5.2.5 UAE
12.5.2.5.1 UAE Automotive Simulation Market Segmentation, By Component
12.5.2.5.2 UAE Automotive Simulation Market Segmentation, By Application
12.5.2.5.3 UAE Automotive Simulation Market Segmentation, By End-User
12.5.2.6 Egypt
12.5.2.6.1 Egypt Automotive Simulation Market Segmentation, By Component
12.5.2.6.2 Egypt Automotive Simulation Market Segmentation, By Application
12.5.2.6.3 Egypt Automotive Simulation Market Segmentation, By End-User
12.5.2.7 Saudi Arabia
12.5.2.7.1 Saudi Arabia Automotive Simulation Market Segmentation, By Component
12.5.2.7.2 Saudi Arabia Automotive Simulation Market Segmentation, By Application
12.5.2.7.3 Saudi Arabia Automotive Simulation Market Segmentation, By End-User
12.5.2.8 Qatar
12.5.2.8.1 Qatar Automotive Simulation Market Segmentation, By Component
12.5.2.8.2 Qatar Automotive Simulation Market Segmentation, By Application
12.5.2.8.3 Qatar Automotive Simulation Market Segmentation, By End-User
12.5.2.9 Rest of Middle East
12.5.2.9.1 Rest of Middle East Automotive Simulation Market Segmentation, By Component
12.5.2.9.2 Rest of Middle East Automotive Simulation Market Segmentation, By Application
12.5.2.9.3 Rest of Middle East Automotive Simulation Market Segmentation, By End-User
12.5.3 Africa
12.5.3.1 Africa Automotive Simulation Market Segmentation, by Country
12.5.3.2 Africa Automotive Simulation Market Segmentation, By Component
12.5.3.3 Africa Automotive Simulation Market Segmentation, By Application
12.5.3.4 Africa Automotive Simulation Market Segmentation, By End-User
12.5.3.5 Nigeria
12.5.3.5.1 Nigeria Automotive Simulation Market Segmentation, By Component
12.5.3.5.2 Nigeria Automotive Simulation Market Segmentation, By Application
12.5.3.5.3 Nigeria Automotive Simulation Market Segmentation, By End-User
12.5.3.6 South Africa
12.5.3.6.1 South Africa Automotive Simulation Market Segmentation, By Component
12.5.3.6.2 South Africa Automotive Simulation Market Segmentation, By Application
12.5.3.6.3 South Africa Automotive Simulation Market Segmentation, By End-User
12.5.3.7 Rest of Africa
12.5.3.7.1 Rest of Africa Automotive Simulation Market Segmentation, By Component
12.5.3.7.2 Rest of Africa Automotive Simulation Market Segmentation, By Application
12.5.3.7.3 Rest of Africa Automotive Simulation Market Segmentation, By End-User
12.6 Latin America
12.6.1 Trend Analysis
12.6.2 Latin America Automotive Simulation Market Segmentation, by country
12.6.3 Latin America Automotive Simulation Market Segmentation, By Component
12.6.4 Latin America Automotive Simulation Market Segmentation, By Application
12.6.5 Latin America Automotive Simulation Market Segmentation, By End-User
12.6.6 Brazil
12.6.6.1 Brazil Automotive Simulation Market Segmentation, By Component
12.6.6.2 Brazil Automotive Simulation Market Segmentation, By Application
12.6.6.3 Brazil Automotive Simulation Market Segmentation, By End-User
12.6.7 Argentina
12.6.7.1 Argentina Automotive Simulation Market Segmentation, By Component
12.6.7.2 Argentina Automotive Simulation Market Segmentation, By Application
12.6.7.3 Argentina Automotive Simulation Market Segmentation, By End-User
12.6.8 Colombia
12.6.8.1 Colombia Automotive Simulation Market Segmentation, By Component
12.6.8.2 Colombia Automotive Simulation Market Segmentation, By Application
12.6.8.3 Colombia Automotive Simulation Market Segmentation, By End-User
12.6.9 Rest of Latin America
12.6.9.1 Rest of Latin America Automotive Simulation Market Segmentation, By Component
12.6.9.2 Rest of Latin America Automotive Simulation Market Segmentation, By Application
12.6.9.3 Rest of Latin America Automotive Simulation Market Segmentation, By End-User

13. Company Profiles
13.1 ESI Group (Germany)
13.1.1 Company Overview
13.1.2 Financial
13.1.3 Products/ Services Offered
13.1.4 SWOT Analysis
13.1.5 The SNS View
13.2 PG Automotive GmbH (Germany)
13.2.1 Company Overview
13.2.2 Financial
13.2.3 Products/ Services Offered
13.2.4 SWOT Analysis
13.2.5 The SNS View
13.3 dSPACE GmbH (Germany)
13.3.1 Company Overview
13.3.2 Financial
13.3.3 Products/ Services Offered
13.3.4 SWOT Analysis
13.3.5 The SNS View
13.4 ANSYS, Inc. (US)
13.4.1 Company Overview
13.4.2 Financial
13.4.3 Products/ Services Offered
13.4.4 SWOT Analysis
13.4.5 The SNS View
13.5 MOOG INC. (US)
13.5.1 Company Overview
13.5.2 Financial
13.5.3 Products/ Services Offered
13.5.4 SWOT Analysis
13.5.5 The SNS View
13.6 Dassault Systèmes (France)
13.6.1 Company Overview
13.6.2 Financial
13.6.3 Products/ Services Offered
13.6.4 SWOT Analysis
13.6.5 The SNS View
13.7 TESIS GmbH (Germany)
13.7.1 Company Overview
13.7.2 Financial
13.7.3 Products/ Services Offered
13.7.4 SWOT Analysis
13.7.5 The SNS View
13.8 Siemens PLM (US)
13.8.1 Company Overview
13.8.2 Financial
13.8.3 Products/ Services Offered
13.8.4 SWOT Analysis
13.8.5 The SNS View

14. Competitive Landscape
14.1 Competitive Benchmarking
14.2 Market Share Analysis
14.3 Recent Developments
14.3.1 Industry News
14.3.2 Company News
14.3.3 Mergers & Acquisitions

15. Use Case and Best Practices

16. Conclusion

An accurate research report requires proper strategizing as well as implementation. There are multiple factors involved in the completion of good and accurate research report and selecting the best methodology to compete the research is the toughest part. Since the research reports we provide play a crucial role in any company’s decision-making process, therefore we at SNS Insider always believe that we should choose the best method which gives us results closer to reality. This allows us to reach at a stage wherein we can provide our clients best and accurate investment to output ratio.

Each report that we prepare takes a timeframe of 350-400 business hours for production. Starting from the selection of titles through a couple of in-depth brain storming session to the final QC process before uploading our titles on our website we dedicate around 350 working hours. The titles are selected based on their current market cap and the foreseen CAGR and growth.


The 5 steps process:

Step 1: Secondary Research:

Secondary Research or Desk Research is as the name suggests is a research process wherein, we collect data through the readily available information. In this process we use various paid and unpaid databases which our team has access to and gather data through the same. This includes examining of listed companies’ annual reports, Journals, SEC filling etc. Apart from this our team has access to various associations across the globe across different industries. Lastly, we have exchange relationships with various university as well as individual libraries.

Secondary Research

Step 2: Primary Research

When we talk about primary research, it is a type of study in which the researchers collect relevant data samples directly, rather than relying on previously collected data.  This type of research is focused on gaining content specific facts that can be sued to solve specific problems. Since the collected data is fresh and first hand therefore it makes the study more accurate and genuine.

We at SNS Insider have divided Primary Research into 2 parts.

Part 1 wherein we interview the KOLs of major players as well as the upcoming ones across various geographic regions. This allows us to have their view over the market scenario and acts as an important tool to come closer to the accurate market numbers. As many as 45 paid and unpaid primary interviews are taken from both the demand and supply side of the industry to make sure we land at an accurate judgement and analysis of the market.

This step involves the triangulation of data wherein our team analyses the interview transcripts, online survey responses and observation of on filed participants. The below mentioned chart should give a better understanding of the part 1 of the primary interview.

Primary Research

Part 2: In this part of primary research the data collected via secondary research and the part 1 of the primary research is validated with the interviews from individual consultants and subject matter experts.

Consultants are those set of people who have at least 12 years of experience and expertise within the industry whereas Subject Matter Experts are those with at least 15 years of experience behind their back within the same space. The data with the help of two main processes i.e., FGDs (Focused Group Discussions) and IDs (Individual Discussions). This gives us a 3rd party nonbiased primary view of the market scenario making it a more dependable one while collation of the data pointers.

Step 3: Data Bank Validation

Once all the information is collected via primary and secondary sources, we run that information for data validation. At our intelligence centre our research heads track a lot of information related to the market which includes the quarterly reports, the daily stock prices, and other relevant information. Our data bank server gets updated every fortnight and that is how the information which we collected using our primary and secondary information is revalidated in real time.

Data Bank Validation

Step 4: QA/QC Process

After all the data collection and validation our team does a final level of quality check and quality assurance to get rid of any unwanted or undesired mistakes. This might include but not limited to getting rid of the any typos, duplication of numbers or missing of any important information. The people involved in this process include technical content writers, research heads and graphics people. Once this process is completed the title gets uploader on our platform for our clients to read it.

Step 5: Final QC/QA Process:

This is the last process and comes when the client has ordered the study. In this process a final QA/QC is done before the study is emailed to the client. Since we believe in giving our clients a good experience of our research studies, therefore, to make sure that we do not lack at our end in any way humanly possible we do a final round of quality check and then dispatch the study to the client.


  •            5000 (33% Discount)


  •            8950 (40% Discount)


  •            3050 (23% Discount)

Start a Conversation

Hi! Click one of our member below to chat on Phone