image

Bus Seat Market Size & Overview

Bus Seat Market Revenue Analysis

Get More Information on Bus Seat Market - Request Sample Report

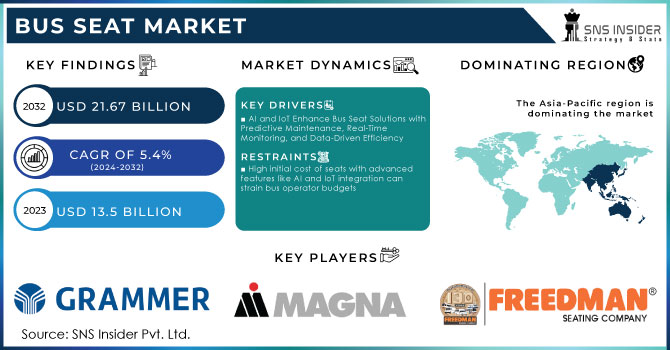
The Bus Seat Market Size was valued at USD 13.5 billion in 2023 and is expected to reach USD 21.67 billion by 2032 and grow at a CAGR of 5.4% by 2024-2032.

The growing global population necessitates efficient transportation solutions, making buses a popular choice due to their frequent operation and reliability. This growing demand for bus travel, encompassing coach, school, transfer, and transit options, fuels the bus seat market. The rising desire for comfortable and luxurious bus journeys, prompting increased production of specialized seats for various bus services.

Additional factors propelling the market growth include population surges, government investments in bus transportation, and the expansion of private and tourism sectors due to rising disposable incomes. Public transportation demand, particularly in urban areas, is a primary driver. As cities become more populated, the need for dependable, affordable, and comfortable public transport options intensifies. This has led to more buses on the road, consequently boosting demand for bus seats. Thus, the rise in disposable income and the growing tourism industry contribute to market growth, with tourists favouring buses for their affordability and convenience.

MARKET DYNAMICS:

KEY DRIVERS:

  • AI and IoT Enhance Bus Seat Solutions with Predictive Maintenance, Real-Time Monitoring, and Data-Driven Efficiency

By integrating artificial intelligence (AI) and Internet of Things (IoT) technologies, bus operators can now predict maintenance needs, monitor seats in real-time, and gather valuable data. This allows them to optimize bus performance and efficiency. Imagine seats that signal potential issues before they become problems, or systems that track passenger occupancy for better resource allocation. This tech-driven approach to bus seats is revolutionizing how we manage and optimize public transportation.

  • Development of innovative bus seat products with advanced technology

RESTRAINTS:

  • High initial cost of seats with advanced features like AI and IoT integration can strain bus operator budgets.

  • Potential for complex maintenance and repairs of tech-integrated bus seats could discourage some operators.

OPPORTUNITIES:

  • Development of lighter, more durable, and eco-friendly bus seat materials can reduce weight and improve fuel efficiency.

Bus seats are undergoing a material revolution. Manufacturers are developing next-generation materials that are lighter, more durable, and environmentally friendly. This shift has the potential to significantly impact both comfort and efficiency. Lighter seats translate to lighter buses, which can lead to improved fuel economy and reduced emissions. Additionally, these new materials can be designed to be more comfortable and last longer, boosting passenger satisfaction and reducing replacement costs.

  • Incorporating features like adjustable settings, temperature control, and in-seat entertainment can enhance passenger comfort and satisfaction.

CHALLENGES:

  • Investing in advanced features like AI and ergonomic designs can be expensive for bus operators.

  • Creating spacious seats for passenger comfort can be difficult on buses with limited capacity.

IMPACT OF RUSSIA-UKRAINE WAR

The ongoing Russia-Ukraine war is impacting the bus seat market in several ways. The supply chain disruptions caused by the conflict can lead to shortages of raw materials needed for bus seat production. This could potentially drive up material costs and delay bus seat deliveries.  The war has exacerbated the global energy crisis, leading to rising fuel prices. As bus manufacturers struggle with more expensive fuel, they may be forced to cut costs elsewhere, potentially impacting bus seat quality or innovation.  Thus, it's important to note the impact might be indirect. A specific value on the impact is difficult to quantify at this stage due to the evolving nature of the conflict.  However, there is a potential 5-10% increase in bus seat material costs in the short term, depending on the material and region. This could lead to a slight rise in bus seat prices for operators.  

IMPACT OF ECONOMIC SLOWDOWN

An economic slowdown can disrupt the bus seat market in a few key ways. It can lead to reduced government spending on public transportation infrastructure, potentially stalling bus fleet expansion and limiting demand for new bus seats. This is further compounded by a decline in ridership as people, facing limited budgets, opt for cheaper travel options or carpool more frequently. There is a potential decline of 5-10% in ridership during economic downturns. This translates to lower revenue for bus operators, making them hesitant to invest in upgrades or new buses, which would require additional bus seats. Additionally, with job cuts and reduced disposable income, consumer demand for features like premium seating or enhanced comfort features may decline. Bus seat manufacturers may look towards developing more cost-effective yet durable materials to cater to budget-conscious operators. They may also focus on solutions that improve operational efficiency, such as seats with easier maintenance or longer lifespans, to help companies navigate financial constraints.

KEY MARKET SEGMENTS:

By Components

  • Frame

  • Upholstery

  • Other Accessories

Frame is the dominating sub-segment in the Bus Seat Market by components holding around 40-45% of market share. The frame is the core component of a bus seat, providing structural support and impacting safety, durability, and weight. It represents the largest market share due to its critical role.
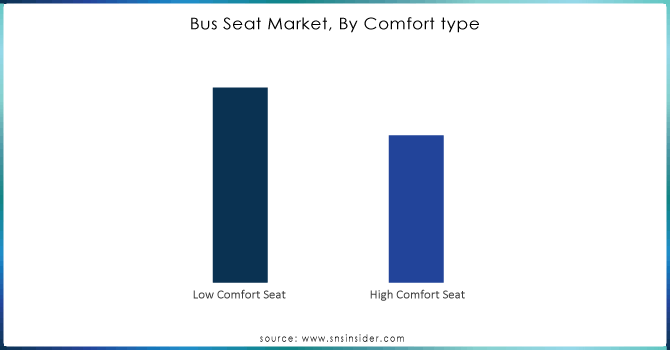
By Comfort type

  • Low Comfort Seat

  • High Comfort Seat

Low Comfort Seat is the dominating sub-segment in the Bus Seat Market by comfort type holding more than 55% of market share. Low-comfort seats are the most common in transit buses and some school buses due to their affordability and space optimization. They cater to shorter trips where basic functionality is prioritized.

Bus-Seat-Market-By-Comfort-type

Get Customized Report as per your Business Requirement - Request For Customized Report

By Seat Type

  • Regular Passenger Seat

  • Recliner Seat

  • Folding Seat

  • Bus Driver Seat

  • Integrated Child Seat

Regular Passenger Seat is the dominating sub-segment in the Bus Seat Market by seat type holding around 65-70% of market share. Regular passenger seats are the most widely used type across various bus categories (transit, coach, transfer) due to their versatility and ability to accommodate a high number of passengers.

By Bus Type

  • Transit bus

  • Coach bus

  • School Bus

  • Transfer Bus

  • Other

Transit Bus is the dominating sub-segment in the Bus Seat Market by bus type. Transit buses operate with high passenger frequency and require seats that are durable, easy to maintain, and optimize space. Regular passenger seats and low-comfort seats are most common in this segment.
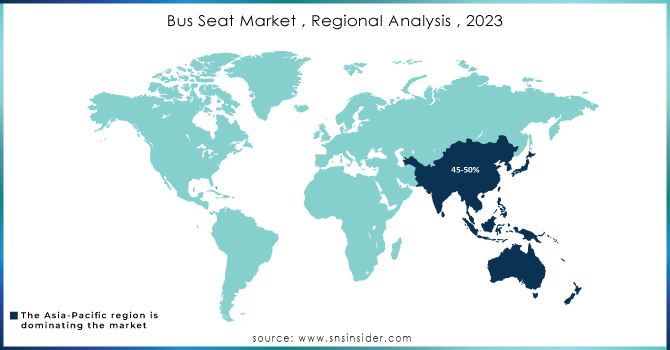
REGIONAL ANALYSES

The Asia Pacific is the dominating region in the Bus Seat Market holding 45-50% of market share, fueled by rapid urbanization, a large population base, and government investments in public transportation. This region's growing economies are also creating a demand for more comfortable bus travel experiences, potentially increasing demand for premium bus seats.

Europe is the second highest region in this market due to its established public transportation infrastructure, focus on sustainability and strict safety regulations.

North America is experiencing the fastest growth with the growth rate of 8-10% is due to rising traffic congestion, air pollution concerns, and advancements in smart bus technology that are making buses more attractive to commuters.

Bus-Seat-Market--Regional-Analysis--2023

REGIONAL COVERAGE:

North America

  • US

  • Canada

  • Mexico

Europe

  • Eastern Europe

    • Poland

    • Romania

    • Hungary

    • Turkey

    • Rest of Eastern Europe

  • Western Europe

    • Germany

    • France

    • UK

    • Italy

    • Spain

    • Netherlands

    • Switzerland

    • Austria

    • Rest of Western Europe

Asia Pacific

  • China

  • India

  • Japan

  • South Korea

  • Vietnam

  • Singapore

  • Australia

  • Rest of Asia Pacific

Middle East & Africa

  • Middle East

    • UAE

    • Egypt

    • Saudi Arabia

    • Qatar

    • Rest of the Middle East

  • Africa

    • Nigeria

    • South Africa

    • Rest of Africa

Latin America

  • Brazil

  • Argentina

  • Colombia

  • Rest of Latin America

KEY PLAYERS

The major key players are GRAMMER AG (Germany), Magna International Inc. (Canada), Freedman Seating Company (US), Faurecia (France), Franz Keil GmbH (Germany), Adient (US), ISRINGHAUSEN GmbH(Germany), NHK Springs (Japan), Toyota Boshoku (Japan), Lear Corporation(US), Tachi-S (Japan), Minda Industries (India), Commercial Vehicle Group(US), Lazzerini SRL (Italy) and other key players.

RECENT DEVELOPMENTS

  • In March 2022: Toyota Boshoku has reached an agreement with Aisin Corporation and Shiroki Corporation. The deal involves acquiring Shiroki's commercial rights for automotive seat frame components and Aisin's seat frame manufacturing unit. This move strengthens Toyota Boshoku's position in the automotive seat supplier market.

Bus Seat Market Report Scope:

Report Attributes Details
Market Size in 2023 US$ 13.5 Billion
Market Size by 2032 US$ 21.67 Billion
CAGR CAGR of 5.4% From 2024 to 2032
Base Year 2023
Forecast Period 2024-2032
Historical Data 2020-2022
Report Scope & Coverage Market Size, Segments Analysis, Competitive  Landscape, Regional Analysis, DROC & SWOT Analysis, Forecast Outlook
Key Segments • By Components (Frame, Upholstery, Other Accessories)
• By Comfort type (Low Comfort Seat, High Comfort Seat)
• By Seat Type (Regular Passenger Seat, Recliner Seat, Folding Seat, Bus Driver Seat, Integrated Child Seat)
• By Bus TypE (Transit bus, Coach bus, School Bus, Transfer Bus, Other)
Regional Analysis/Coverage North America (US, Canada, Mexico), Europe (Eastern Europe [Poland, Romania, Hungary, Turkey, Rest of Eastern Europe] Western Europe] Germany, France, UK, Italy, Spain, Netherlands, Switzerland, Austria, Rest of Western Europe]), Asia Pacific (China, India, Japan, South Korea, Vietnam, Singapore, Australia, Rest of Asia Pacific), Middle East & Africa (Middle East [UAE, Egypt, Saudi Arabia, Qatar, Rest of Middle East], Africa [Nigeria, South Africa, Rest of Africa], Latin America (Brazil, Argentina, Colombia Rest of Latin America
Company Profiles GRAMMER AG (Germany), Magna International Inc. (Canada), Freedman Seating Company (US), Faurecia (France), Franz Keil GmbH (Germany), Adient (US), ISRINGHAUSEN GmbH(Germany), NHK Springs (Japan), Toyota Boshoku (Japan), Lear Corporation(US), Tachi-S (Japan), Minda Industries (India), Commercial Vehicle Group(US), Lazzerini SRL (Italy)
Key Drivers • The use of environmentally friendly and recyclable materials in the creation of seats, as well as recycled metals in the production.
• Governments are urging bus seat producers to adopt environmentally friendly biodegradable materials.
RESTRAINTS • Seat replacement in buses is not a realistic solution for long-term company operations.
• Many bus fleet firms are wary about taking on contracts to replace seats on older buses.

Frequently Asked Questions

Ans:- The Bus Seat Market size is expected to reach USD 20.71 billion by 2031.

Ans:- Low comfort seats are expected to see the most significant growth.

Ans:- Magna International Inc. (Canada), Freedman Seating Company (US), Faurecia (France), NHK Springs (Japan), Toyota Boshoku (Japan), Tachi-S (Japan), Minda Industries (India), and Commercial Vehicle Group(US) are the most prominent players in the market.

Ans:- Yes.

Ans:- Asia pacific region is anticipated to be the primary driver of the market.

TABLE OF CONTENTS

1. Introduction
1.1 Market Definition
1.2 Scope
1.3 Research Assumptions

2. Industry Flowchart

3. Research Methodology

4. Market Dynamics
4.1 Drivers
4.2 Restraints
4.3 Opportunities
4.4 Challenges

5. Impact Analysis
5.1 Impact of Russia-Ukraine Crisis
5.2 Impact of Economic Slowdown on Major Countries
5.2.1 Introduction
5.2.2 United States
5.2.3 Canada
5.2.4 Germany
5.2.5 France
5.2.6 UK
5.2.7 China
5.2.8 Japan
5.2.9 South Korea
5.2.10 India

6. Value Chain Analysis

7. Porter’s 5 Forces Model

8. Pest Analysis

9. Bus Seat Market Segmentation, By Components
9.1 Introduction
9.2 Trend Analysis
9.3 Frame
9.4 Upholstery
9.5 Other Accessories

10. Bus Seat Market Segmentation, By Comfort type
10.1 Introduction
10.2 Trend Analysis
10.3 Low Comfort Seat
10.4 High Comfort Seat

11. Bus Seat Market Segmentation, By Seat Type
11.1 Introduction
11.2 Trend Analysis
11.3 Regular Passenger Seat
11.4 Recliner Seat
11.5 Folding Seat
11.6 Bus Driver Seat
11.7 Integrated Child Seat

12. Bus Seat Market Segmentation, By Bus Type
12.1 Introduction
12.2 Trend Analysis
12.3 Transit bus
12.4 Coach bus
12.5 School Bus
12.6 Transfer Bus
12.7 Other

13. Regional Analysis
13.1 Introduction
13.2 North America
13.2.1 Trend Analysis
13.2.2 North America Bus Seat Market, By Country
13.2.3 North America Bus Seat Market Segmentation, By Components
13.2.4 North America Bus Seat Market Segmentation, By Comfort type
13.2.5 North America Bus Seat Market Segmentation, By Seat Type
13.2.6 North America Bus Seat Market Segmentation, By Bus Type
13.2.7 USA
13.2.7.1 USA Bus Seat Market Segmentation, By Components
13.2.7.2 USA Bus Seat Market Segmentation, By Comfort type
13.2.7.3 USA Bus Seat Market Segmentation, By Seat Type
13.2.7.4 USA Bus Seat Market Segmentation, By Bus Type
13.2.8 Canada
13.2.8.1 Canada Bus Seat Market Segmentation, By Components
13.2.8.2 Canada Bus Seat Market Segmentation, By Comfort type
13.2.8.3 Canada Bus Seat Market Segmentation, By Seat Type
13.2.8.4 Canada Bus Seat Market Segmentation, By Bus Type
13.2.9 Mexico
13.2.9.1 Mexico Bus Seat Market Segmentation, By Components
13.2.9.2 Mexico Bus Seat Market Segmentation, By Comfort type
13.2.9.3 Mexico Bus Seat Market Segmentation, By Seat Type
13.2.9.4 Mexico Bus Seat Market Segmentation, By Bus Type
13.3 Europe
13.3.1 Trend Analysis
13.3.2 Eastern Europe
13.3.2.1 Eastern Europe Bus Seat Market, By Country
13.3.2.2 Eastern Europe Bus Seat Market Segmentation, By Components
13.3.2.3 Eastern Europe Bus Seat Market Segmentation, By Comfort type
13.3.2.4 Eastern Europe Bus Seat Market Segmentation, By Seat Type
13.3.2.5 Eastern Europe Bus Seat Market Segmentation, By Bus Type
13.3.2.6 Poland
13.3.2.6.1 Poland Bus Seat Market Segmentation, By Components
13.3.2.6.2 Poland Bus Seat Market Segmentation, By Comfort type
13.3.2.6.3 Poland Bus Seat Market Segmentation, By Seat Type
13.3.2.6.4 Poland Bus Seat Market Segmentation, By Bus Type
13.3.2.7 Romania
13.3.2.7.1 Romania Bus Seat Market Segmentation, By Components
13.3.2.7.2 Romania Bus Seat Market Segmentation, By Comfort type
13.3.2.7.3 Romania Bus Seat Market Segmentation, By Seat Type
13.3.2.7.4 Romania Bus Seat Market Segmentation, By Bus Type
13.3.2.8 Hungary
13.3.2.8.1 Hungary Bus Seat Market Segmentation, By Components
13.3.2.8.2 Hungary Bus Seat Market Segmentation, By Comfort type
13.3.2.8.3 Hungary Bus Seat Market Segmentation, By Seat Type
13.3.2.8.4 Hungary Bus Seat Market Segmentation, By Bus Type
13.3.2.9 Turkey
13.3.2.9.1 Turkey Bus Seat Market Segmentation, By Components
13.3.2.9.2 Turkey Bus Seat Market Segmentation, By Comfort type
13.3.2.9.3 Turkey Bus Seat Market Segmentation, By Seat Type
13.3.2.9.4 Turkey Bus Seat Market Segmentation, By Bus Type
13.3.2.10 Rest of Eastern Europe
13.3.2.10.1 Rest of Eastern Europe Bus Seat Market Segmentation, By Components
13.3.2.10.2 Rest of Eastern Europe Bus Seat Market Segmentation, By Comfort type
13.3.2.10.3 Rest of Eastern Europe Bus Seat Market Segmentation, By Seat Type
13.3.2.10.4 Rest of Eastern Europe Bus Seat Market Segmentation, By Bus Type
13.3.3 Western Europe
13.3.3.1 Western Europe Bus Seat Market, By Country
13.3.3.2 Western Europe Bus Seat Market Segmentation, By Components
13.3.3.3 Western Europe Bus Seat Market Segmentation, By Comfort type
13.3.3.4 Western Europe Bus Seat Market Segmentation, By Seat Type
13.3.3.5 Western Europe Bus Seat Market Segmentation, By Bus Type
13.3.3.6 Germany
13.3.3.6.1 Germany Bus Seat Market Segmentation, By Components
13.3.3.6.2 Germany Bus Seat Market Segmentation, By Comfort type
13.3.3.6.3 Germany Bus Seat Market Segmentation, By Seat Type
13.3.3.6.4 Germany Bus Seat Market Segmentation, By Bus Type
13.3.3.7 France
13.3.3.7.1 France Bus Seat Market Segmentation, By Components
13.3.3.7.2 France Bus Seat Market Segmentation, By Comfort type
13.3.3.7.3 France Bus Seat Market Segmentation, By Seat Type
13.3.3.7.4 France Bus Seat Market Segmentation, By Bus Type
13.3.3.8 UK
13.3.3.8.1 UK Bus Seat Market Segmentation, By Components
13.3.3.8.2 UK Bus Seat Market Segmentation, By Comfort type
13.3.3.8.3 UK Bus Seat Market Segmentation, By Seat Type
13.3.3.8.4 UK Bus Seat Market Segmentation, By Bus Type
13.3.3.9 Italy
13.3.3.9.1 Italy Bus Seat Market Segmentation, By Components
13.3.3.9.2 Italy Bus Seat Market Segmentation, By Comfort type
13.3.3.9.3 Italy Bus Seat Market Segmentation, By Seat Type
13.3.3.9.4 Italy Bus Seat Market Segmentation, By Bus Type
13.3.3.10 Spain
13.3.3.10.1 Spain Bus Seat Market Segmentation, By Components
13.3.3.10.2 Spain Bus Seat Market Segmentation, By Comfort type
13.3.3.10.3 Spain Bus Seat Market Segmentation, By Seat Type
13.3.3.10.4 Spain Bus Seat Market Segmentation, By Bus Type
13.3.3.11 Netherlands
13.3.3.11.1 Netherlands Bus Seat Market Segmentation, By Components
13.3.3.11.2 Netherlands Bus Seat Market Segmentation, By Comfort type
13.3.3.11.3 Netherlands Bus Seat Market Segmentation, By Seat Type
13.3.3.11.4 Netherlands Bus Seat Market Segmentation, By Bus Type
13.3.3.12 Switzerland
13.3.3.12.1 Switzerland Bus Seat Market Segmentation, By Components
13.3.3.12.2 Switzerland Bus Seat Market Segmentation, By Comfort type
13.3.3.12.3 Switzerland Bus Seat Market Segmentation, By Seat Type
13.3.3.12.4 Switzerland Bus Seat Market Segmentation, By Bus Type
13.3.3.13 Austria
13.3.3.13.1 Austria Bus Seat Market Segmentation, By Components
13.3.3.13.2 Austria Bus Seat Market Segmentation, By Comfort type
13.3.3.13.3 Austria Bus Seat Market Segmentation, By Seat Type
13.3.3.13.4 Austria Bus Seat Market Segmentation, By Bus Type
13.3.3.14 Rest of Western Europe
13.3.3.14.1 Rest of Western Europe Bus Seat Market Segmentation, By Components
13.3.3.14.2 Rest of Western Europe Bus Seat Market Segmentation, By Comfort type
13.3.3.14.3 Rest of Western Europe Bus Seat Market Segmentation, By Seat Type
13.3.3.14.4 Rest of Western Europe Bus Seat Market Segmentation, By Bus Type
13.4 Asia-Pacific
13.4.1 Trend Analysis
13.4.2 Asia-Pacific Bus Seat Market, By Country
13.4.3 Asia-Pacific Bus Seat Market Segmentation, By Components
13.4.4 Asia-Pacific Bus Seat Market Segmentation, By Comfort type
13.4.5 Asia-Pacific Bus Seat Market Segmentation, By Seat Type
13.4.6 Asia-Pacific Bus Seat Market Segmentation, By Bus Type
13.4.7 China
13.4.7.1 China Bus Seat Market Segmentation, By Components
13.4.7.2 China Bus Seat Market Segmentation, By Comfort type
13.4.7.3 China Bus Seat Market Segmentation, By Seat Type
13.4.7.4 China Bus Seat Market Segmentation, By Bus Type
13.4.8 India
13.4.8.1 India Bus Seat Market Segmentation, By Components
13.4.8.2 India Bus Seat Market Segmentation, By Comfort type
13.4.8.3 India Bus Seat Market Segmentation, By Seat Type
13.4.8.4 India Bus Seat Market Segmentation, By Bus Type
13.4.9 Japan
13.4.9.1 Japan Bus Seat Market Segmentation, By Components
13.4.9.2 Japan Bus Seat Market Segmentation, By Comfort type
13.4.9.3 Japan Bus Seat Market Segmentation, By Seat Type
13.4.9.4 Japan Bus Seat Market Segmentation, By Bus Type
13.4.10 South Korea
13.4.10.1 South Korea Bus Seat Market Segmentation, By Components
13.4.10.2 South Korea Bus Seat Market Segmentation, By Comfort type
13.4.10.3 South Korea Bus Seat Market Segmentation, By Seat Type
13.4.10.4 South Korea Bus Seat Market Segmentation, By Bus Type
13.4.11 Vietnam
13.4.11.1 Vietnam Bus Seat Market Segmentation, By Components
13.4.11.2 Vietnam Bus Seat Market Segmentation, By Comfort type
13.4.11.3 Vietnam Bus Seat Market Segmentation, By Seat Type
13.4.11.4 Vietnam Bus Seat Market Segmentation, By Bus Type
13.4.12 Singapore
13.4.12.1 Singapore Bus Seat Market Segmentation, By Components
13.4.12.2 Singapore Bus Seat Market Segmentation, By Comfort type
13.4.12.3 Singapore Bus Seat Market Segmentation, By Seat Type
13.4.12.4 Singapore Bus Seat Market Segmentation, By Bus Type
13.4.13 Australia
13.4.13.1 Australia Bus Seat Market Segmentation, By Components
13.4.13.2 Australia Bus Seat Market Segmentation, By Comfort type
13.4.13.3 Australia Bus Seat Market Segmentation, By Seat Type
13.4.13.4 Australia Bus Seat Market Segmentation, By Bus Type
13.4.14 Rest of Asia-Pacific
13.4.14.1 Rest of Asia-Pacific Bus Seat Market Segmentation, By Components
13.4.14.2 Rest of Asia-Pacific Bus Seat Market Segmentation, By Comfort type
13.4.14.3 Rest of Asia-Pacific Bus Seat Market Segmentation, By Seat Type
13.4.14.4 Rest of Asia-Pacific Bus Seat Market Segmentation, By Bus Type
13.5 Middle East & Africa
13.5.1 Trend Analysis
13.5.2 Middle East
13.5.2.1 Middle East Bus Seat Market, By Country
13.5.2.2 Middle East Bus Seat Market Segmentation, By Components
13.5.2.3 Middle East Bus Seat Market Segmentation, By Comfort type
13.5.2.4 Middle East Bus Seat Market Segmentation, By Seat Type
13.5.2.5 Middle East Bus Seat Market Segmentation, By Bus Type
13.5.2.6 UAE
13.5.2.6.1 UAE Bus Seat Market Segmentation, By Components
13.5.2.6.2 UAE Bus Seat Market Segmentation, By Comfort type
13.5.2.6.3 UAE Bus Seat Market Segmentation, By Seat Type
13.5.2.6.4 UAE Bus Seat Market Segmentation, By Bus Type
13.5.2.7 Egypt
13.5.2.7.1 Egypt Bus Seat Market Segmentation, By Components
13.5.2.7.2 Egypt Bus Seat Market Segmentation, By Comfort type
13.5.2.7.3 Egypt Bus Seat Market Segmentation, By Seat Type
13.5.2.7.4 Egypt Bus Seat Market Segmentation, By Bus Type
13.5.2.8 Saudi Arabia
13.5.2.8.1 Saudi Arabia Bus Seat Market Segmentation, By Components
13.5.2.8.2 Saudi Arabia Bus Seat Market Segmentation, By Comfort type
13.5.2.8.3 Saudi Arabia Bus Seat Market Segmentation, By Seat Type
13.5.2.8.4 Saudi Arabia Bus Seat Market Segmentation, By Bus Type
13.5.2.9 Qatar
13.5.2.9.1 Qatar Bus Seat Market Segmentation, By Components
13.5.2.9.2 Qatar Bus Seat Market Segmentation, By Comfort type
13.5.2.9.3 Qatar Bus Seat Market Segmentation, By Seat Type
13.5.2.9.4 Qatar Bus Seat Market Segmentation, By Bus Type
13.5.2.10 Rest of Middle East
13.5.2.10.1 Rest of Middle East Bus Seat Market Segmentation, By Components
13.5.2.10.2 Rest of Middle East Bus Seat Market Segmentation, By Comfort type
13.5.2.10.3 Rest of Middle East Bus Seat Market Segmentation, By Seat Type
13.5.2.10.4 Rest of Middle East Bus Seat Market Segmentation, By Bus Type
13.5.3 Africa
13.5.3.1 Africa Bus Seat Market, By Country
13.5.3.2 Africa Bus Seat Market Segmentation, By Components
13.5.3.3 Africa Bus Seat Market Segmentation, By Comfort type
13.5.3.4 Africa Bus Seat Market Segmentation, By Seat Type
13.5.3.5 Africa Bus Seat Market Segmentation, By Bus Type
13.5.3.6 Nigeria
13.5.3.6.1 Nigeria Bus Seat Market Segmentation, By Components
13.5.3.6.2 Nigeria Bus Seat Market Segmentation, By Comfort type
13.5.3.6.3 Nigeria Bus Seat Market Segmentation, By Seat Type
13.5.3.6.4 Nigeria Bus Seat Market Segmentation, By Bus Type
13.5.3.7 South Africa
13.5.3.7.1 South Africa Bus Seat Market Segmentation, By Components
13.5.3.7.2 South Africa Bus Seat Market Segmentation, By Comfort type
13.5.3.7.3 South Africa Bus Seat Market Segmentation, By Seat Type
13.5.3.7.4 South Africa Bus Seat Market Segmentation, By Bus Type
13.5.3.8 Rest of Africa
13.5.3.8.1 Rest of Africa Bus Seat Market Segmentation, By Components
13.5.3.8.2 Rest of Africa Bus Seat Market Segmentation, By Comfort type
13.5.3.8.3 Rest of Africa Bus Seat Market Segmentation, By Seat Type
13.5.3.8.4 Rest of Africa Bus Seat Market Segmentation, By Bus Type
13.6 Latin America
13.6.1 Trend Analysis
13.6.2 Latin America Bus Seat Market, By Country
13.6.3 Latin America Bus Seat Market Segmentation, By Components
13.6.4 Latin America Bus Seat Market Segmentation, By Comfort type
13.6.5 Latin America Bus Seat Market Segmentation, By Seat Type
13.6.6 Latin America Bus Seat Market Segmentation, By Bus Type
13.6.7 Brazil
13.6.7.1 Brazil Bus Seat Market Segmentation, By Components
13.6.7.2 Brazil Bus Seat Market Segmentation, By Comfort type
13.6.7.3 Brazil Bus Seat Market Segmentation, By Seat Type
13.6.7.4 Brazil Bus Seat Market Segmentation, By Bus Type
13.6.8 Argentina
13.6.8.1 Argentina Bus Seat Market Segmentation, By Components
13.6.8.2 Argentina Bus Seat Market Segmentation, By Comfort type
13.6.8.3 Argentina Bus Seat Market Segmentation, By Seat Type
13.6.8.4 Argentina Bus Seat Market Segmentation, By Bus Type
13.6.9 Colombia
13.6.9.1 Colombia Bus Seat Market Segmentation, By Components
13.6.9.2 Colombia Bus Seat Market Segmentation, By Comfort type
13.6.9.3 Colombia Bus Seat Market Segmentation, By Seat Type
13.6.9.4 Colombia Bus Seat Market Segmentation, By Bus Type
13.6.10 Rest of Latin America
13.6.10.1 Rest of Latin America Bus Seat Market Segmentation, By Components
13.6.10.2 Rest of Latin America Bus Seat Market Segmentation, By Comfort type
13.6.10.3 Rest of Latin America Bus Seat Market Segmentation, By Seat Type
13.6.10.4 Rest of Latin America Bus Seat Market Segmentation, By Bus Type

14. Company Profiles
14.1 GRAMMER AG (Germany)
14.1.1 Company Overview
14.1.2 Financial
14.1.3 Products/ Services Offered
14.1.4 SWOT Analysis
14.1.5 The SNS View
14.2 Magna International Inc. (Canada)
14.2.1 Company Overview
14.2.2 Financial
14.2.3 Products/ Services Offered
14.2.4 SWOT Analysis
14.2.5 The SNS View
14.3 Freedman Seating Company (US)
14.3.1 Company Overview
14.3.2 Financial
14.3.3 Products/ Services Offered
14.3.4 SWOT Analysis
14.3.5 The SNS View
14.4 Faurecia (France)
14.4.1 Company Overview
14.4.2 Financial
14.4.3 Products/ Services Offered
14.4.4 SWOT Analysis
14.4.5 The SNS View
14.5 Franz Keil GmbH (Germany)
14.5.1 Company Overview
14.5.2 Financial
14.5.3 Products/ Services Offered
14.5.4 SWOT Analysis
14.5.5 The SNS View
14.6 Adient (US)
14.6.1 Company Overview
14.6.2 Financial
14.6.3 Products/ Services Offered
14.6.4 SWOT Analysis
14.6.5 The SNS View
14.7 ISRINGHAUSEN GmbH(Germany)
14.7.1 Company Overview
14.7.2 Financial
14.7.3 Products/ Services Offered
14.7.4 SWOT Analysis
14.7.5 The SNS View
14.8 NHK Springs (Japan)
14.8.1 Company Overview
14.8.2 Financial
14.8.3 Products/ Services Offered
14.8.4 SWOT Analysis
14.8.5 The SNS View
14.9 Toyota Boshoku (Japan)
14.9.1 Company Overview
14.9.2 Financial
14.9.3 Products/ Services Offered
14.9.4 SWOT Analysis
14.9.5 The SNS View
14.10 Lear Corporation(US)
14.10.1 Company Overview
14.10.2 Financial
14.10.3 Products/ Services Offered
14.10.4 SWOT Analysis
14.10.5 The SNS View
14.11 Tachi-S (Japan)
14.11.1 Company Overview
14.11.2 Financial
14.11.3 Products/ Services Offered
14.11.4 SWOT Analysis
14.11.5 The SNS View
14.12 Minda Industries (India)
14.12.1 Company Overview
14.12.2 Financial
14.12.3 Products/ Services Offered
14.12.4 SWOT Analysis
14.12.5 The SNS View
14.13 Commercial Vehicle Group(US)
14.13.1 Company Overview
14.13.2 Financial
14.13.3 Products/ Services Offered
14.13.4 SWOT Analysis
14.13.5 The SNS View
14.14 Lazzerini SRL (Italy)
14.14.1 Company Overview
14.14.2 Financial
14.14.3 Products/ Services Offered
14.14.4 SWOT Analysis
14.14.5 The SNS View

15. Competitive Landscape
15.1 Competitive Benchmarking
15.2 Market Share Analysis
15.3 Recent Developments
15.3.1 Industry News
15.3.2 Company News
15.3.3 Mergers & Acquisitions

16. Use Case and Best Practices

17. Conclusion

An accurate research report requires proper strategizing as well as implementation. There are multiple factors involved in the completion of good and accurate research report and selecting the best methodology to compete the research is the toughest part. Since the research reports we provide play a crucial role in any company’s decision-making process, therefore we at SNS Insider always believe that we should choose the best method which gives us results closer to reality. This allows us to reach at a stage wherein we can provide our clients best and accurate investment to output ratio.

Each report that we prepare takes a timeframe of 350-400 business hours for production. Starting from the selection of titles through a couple of in-depth brain storming session to the final QC process before uploading our titles on our website we dedicate around 350 working hours. The titles are selected based on their current market cap and the foreseen CAGR and growth.


The 5 steps process:

Step 1: Secondary Research:

Secondary Research or Desk Research is as the name suggests is a research process wherein, we collect data through the readily available information. In this process we use various paid and unpaid databases which our team has access to and gather data through the same. This includes examining of listed companies’ annual reports, Journals, SEC filling etc. Apart from this our team has access to various associations across the globe across different industries. Lastly, we have exchange relationships with various university as well as individual libraries.

Secondary Research

Step 2: Primary Research

When we talk about primary research, it is a type of study in which the researchers collect relevant data samples directly, rather than relying on previously collected data.  This type of research is focused on gaining content specific facts that can be sued to solve specific problems. Since the collected data is fresh and first hand therefore it makes the study more accurate and genuine.

We at SNS Insider have divided Primary Research into 2 parts.

Part 1 wherein we interview the KOLs of major players as well as the upcoming ones across various geographic regions. This allows us to have their view over the market scenario and acts as an important tool to come closer to the accurate market numbers. As many as 45 paid and unpaid primary interviews are taken from both the demand and supply side of the industry to make sure we land at an accurate judgement and analysis of the market.

This step involves the triangulation of data wherein our team analyses the interview transcripts, online survey responses and observation of on filed participants. The below mentioned chart should give a better understanding of the part 1 of the primary interview.

Primary Research

Part 2: In this part of primary research the data collected via secondary research and the part 1 of the primary research is validated with the interviews from individual consultants and subject matter experts.

Consultants are those set of people who have at least 12 years of experience and expertise within the industry whereas Subject Matter Experts are those with at least 15 years of experience behind their back within the same space. The data with the help of two main processes i.e., FGDs (Focused Group Discussions) and IDs (Individual Discussions). This gives us a 3rd party nonbiased primary view of the market scenario making it a more dependable one while collation of the data pointers.

Step 3: Data Bank Validation

Once all the information is collected via primary and secondary sources, we run that information for data validation. At our intelligence centre our research heads track a lot of information related to the market which includes the quarterly reports, the daily stock prices, and other relevant information. Our data bank server gets updated every fortnight and that is how the information which we collected using our primary and secondary information is revalidated in real time.

Data Bank Validation

Step 4: QA/QC Process

After all the data collection and validation our team does a final level of quality check and quality assurance to get rid of any unwanted or undesired mistakes. This might include but not limited to getting rid of the any typos, duplication of numbers or missing of any important information. The people involved in this process include technical content writers, research heads and graphics people. Once this process is completed the title gets uploader on our platform for our clients to read it.

Step 5: Final QC/QA Process:

This is the last process and comes when the client has ordered the study. In this process a final QA/QC is done before the study is emailed to the client. Since we believe in giving our clients a good experience of our research studies, therefore, to make sure that we do not lack at our end in any way humanly possible we do a final round of quality check and then dispatch the study to the client.


  •            5000 (33% Discount)


  •            8950 (40% Discount)


  •            3050 (23% Discount)

Start a Conversation

Hi! Click one of our member below to chat on Phone