Digital Holography Market Report Scope & Overview:
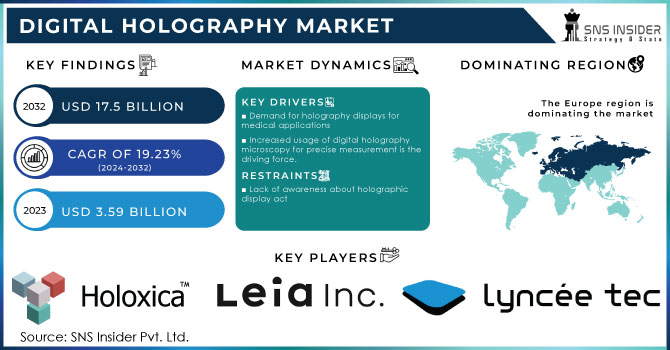
The Digital Holography Market was valued at USD 4.1 Billion in 2023 and is expected to reach USD 21.1 Billion by 2032, growing at a CAGR of 20.09% from 2024-2032. The Mobile Augmented Reality market is driven by semiconductor advancements, with wafer production centered in Asia-Pacific to support increasing AR hardware demand. Chip design has shifted toward AI-powered processors, enhancing performance for 5G and edge computing. Rising fab capacity utilization highlights the growing production of AR-specific components like LiDAR sensors and AI accelerators. Despite ongoing chip shortages, major investments in semiconductor manufacturing aim to stabilize the supply chain. This report also covers the competitive landscape, regulatory frameworks, emerging AR applications, key investments, and technological advancements shaping the future of mobile AR adoption.
Get more information on Digital Holography Market - Request Sample Report
Market Dynamics
Drivers
-
The rising adoption of digital holography in healthcare, industrial inspection, and research is driving market growth.
Growth in the use of Digital Holography in medical images, industrial inspection, microscopy, and other industries are the major factors driving the growth of the digital holographic market. This allows high-resolution, real-time, non-invasive imaging in applications ranging from ophthalmology and cardiology to biomedical research. As a result, in industrial use, digital holography improves defect detection and also quality control in the production process. Moreover, its uses are further extended with increasing applications in education and an advertisement with holographic displays. Ongoing technology developments in lasers, optical components, and AI-based image processing algorithms also provide for further market growth, and digital holography has become an essential tool within several industries.
Restraints
-
Expensive hardware, precision optics, and complex data processing limit widespread adoption.
High-quality hardware required for digital holography, like laser sources, high-resolution sensors, and computational resources, makes it expensive and hence limits its adoption. Precision optics and complex algorithms are needed for advanced setups, which require more investment in research and development. Moreover, digital holography also requires at least some specialized experience for calibration, data processing, and real-time image reconstruction, as well as creating additional entrance barriers. Few people know about it, and with no real standard yet, market penetration fills up slowly. Overcoming these issues through cost-effective solutions and simplified integration of systems is critical for widespread adoption across industries.
Opportunities
-
Integration with AR/VR and innovations in holographic displays create new growth
Digital holography with augmented reality and virtual reality is a potential growth area. Holographic displays are bringing about a new wave of innovation, providing a more immersive experience in gaming, entertainment, and education. The growing demand for holographic telepresence, where users can interact with real-time 3D projection, also allows them new communication strategies. Additionally, research into portable and flexible holography devices is stimulating commercialization. As automotive, retail, and healthcare industries venture into AR-based holography, the market is expected to grow considerably with uninterrupted technological innovation and investment.
Challenges
-
Large data volumes and real-time processing demands pose technical challenges for scalability.
Digital holography produces high-resolution data in considerable volume, and therefore, advanced processing and storage solutions are needed. Especially for real-time applications, the high-speed computing power with efficient compression algorithms and cloud-based infrastructure becomes a challenging task. Furthermore, ensuring smooth data flow and integrating them with existing digital ecosystems is another complication. AI-driven Image Processing, Edge Computing, Scalable Storage Solutions — We have some challenges to overcome here. Scaling this technology for widespread adoption will have to take into consideration the data management constraints necessary for data-heavy applications across sectors, which include real-time holographic imaging capabilities.
Segmentation Analysis
By Offering
The hardware segment dominated the market and accounted for a revenue share of more than 64% of revenue share in 2023 and to rise at a fast CAGR during the forecasting period. The hardware segment of the global market is being propelled by the rising demand for highly complex, high-end hardware components, which allows highly advanced holographic processes. Lately, professionals like Real Fictions and HYPERVSN et al have been enhancing hardware, like high-resolution sensors, displays, strong CPUs, and low-power optical systems.
Software Segment is Expected to Grow with Notable during the Forecast Period 2024 — 2032. This has been made possible by advancements in software supporting visualizations in holographic display technology — such as allowing collaboration with multiple viewers, which is ideal for new product design reviews. Apart from this, software solutions, for example, holographic data processing software are important for processing and analyzing holographic data which serves an important role in various fields including healthcare and research.
By Dimensions
In 2023, the two-dimensional segment held the largest revenue share in the market. 2D digital holography is widely used due to its benefits in medical imaging, especially to view and analyze complicated anatomical structures with high precision. As an example, researchers in South Korea are using artificial intelligence to turn 2D medical imaging into natural 3D holograms that can be viewed without special glasses.
The segment of 3D is projected to achieve the fastest CAGR during the period 2024 to 2032 It is being used in events and concerts in a form called as 3d digital holography. To give you a quick example, in September 2021, ABBA revealed a hologram concert to mark their long-awaited return to the stage again. This creative application of 3D hologram technology shows the capabilities of holographic technologies in the entertainment space, bringing fans an immersive concert experience with their favorite artists, and at the same time showcasing the high versatility and appeal of said holographic performances.
By Application
In 2024, the holographic microscopy segment dominated the market and accounted for a significant revenue share. Such a sensitive particle sizing method is implemented through advanced microscopy and an adaptable microscopy tool, which applies to nanotechnology, material science, and biological research, and enables accurate measurement of size, shape, and surface characteristics. The holographic microscope provides a high-resolution and non-invasive imaging solution, transforming how scientists use this skull to explore and learn about structures inside of it.
The holographic imaging segment is estimated to register the fastest CAGR between 2024 to 2032. Holographic images are capturing the attention of people and researchers because of the low-quality and low-resolution holographic display technologies, which do not offer realistic images like Displays. This has increased the scope of holographic image use cases across industries like healthcare, automotive, entertainment, and education.
By End-Use
In 2023, the healthcare segment dominated the market and held the largest revenue share, which propelled the market forward. Digital holography is an advanced visualization technology, which is used for accurate and detailed examination of anatomical structures. This technology is increasingly used in medical imaging, surgical planning, and education leading to enhanced diagnostic and treatment interventions and patient outcomes.
The education segment is expected to register fastest CAGR during the forecast period. By visualizing complex concepts in 3D, digital holography provides immersive experiences that boost student comprehension, interest, and retention. This has made holography much easier and cheaper and thus available to teachers, so that they can easily leverage these holographic materials in their classes.
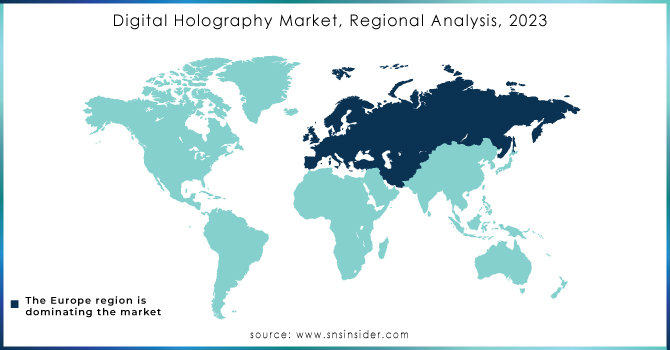
Regional Analysis
In 2024, North America dominated the market and held the leading share in the digital holography market. Some of the key market players from North America are RealView Imaging and EON Reality among others. North America is expected to be the largest market over the next decade owing to the growing investments in research and development activities for holographic displays, and AR and VR technologies. Such investments will improve the quantum, that is, the quality, resolution, and experience of a holographic display, which will increase adoption within advertising, entertainment, and gaming sectors.
Asia Pacific is also projected to experience the fastest compound annual growth rate during the forecast period from 2024 to 2032 in the digital holography market due to growing demand from various industries, high investments in research and development, and the presence of major technology hubs. The huge population, increasing urbanization, and industrialization in the region are magnifying the demand for advanced visualization technologies in industries, such as digital holography.
Need any customization research on Digital Holography Market - Enquiry Now
Key Players
The Major key players along with their products are
-
Lyncee TEC SA– Digital Holographic Microscope (DHM)
-
Holoxica Limited– 3D Holographic Display
-
Eon Reality Inc. – EON-XR Platform
-
RealView Imaging Ltd. – HOLOSCOPE-i
-
Leia Inc. – Lume Pad 2
-
Phase Holographic Imaging AB – HoloMonitor M4
-
Zebra Imaging Inc. – Holographic Print Display
-
Ovizio Imaging Systems – qMod Camera
-
NanoLive SA – CX-A Holographic Microscope
-
TruLife Optics – Holographic Optical Elements
-
MIT Media Lab – HoloVideo System
-
Holografika Kft. – HoloVizio 3D Display
-
Geola Digital Uab– Full-color Holographic Printer
-
Jasper Display Corp. – LCoS Spatial Light Modulator
-
MDH Hologram Ltd. – HoloNet Projection System
Recent developments
-
In June 2024, Phase Holographic Imaging PHI AB Partnered with Kem-En-Tec Nordic A/S to expand HoloMonitor sales across the Nordic region.
-
In June 2024, Leia Inc. Launched Immersity AI, a platform that converts 2D images and videos into immersive 3D content.
-
In September 2024, EON Reality Partnered with Meta to integrate its AI-driven EON-XR platform with Meta's Orion AR glasses and text-to-3D technology.
| Report Attributes | Details |
|---|---|
| Market Size in 2023 | USD 4.1 Billion |
| Market Size by 2032 | USD 21.1 Billion |
| CAGR | CAGR of 20.09% From 2024 to 2032 |
| Base Year | 2023 |
| Forecast Period | 2024-2032 |
| Historical Data | 2020-2022 |
| Report Scope & Coverage | Market Size, Segments Analysis, Competitive Landscape, Regional Analysis, DROC & SWOT Analysis, Forecast Outlook |
| Key Segments | • By Offerings (Hardware, Software) • By Dimensions (Two Dimensional,Three Dimensional) • By Application (Holographic Microscopy, Holographic Imaging, Holographic Telepresence, Others) • By End-Use (Healthcare, Automotive, Aerospace & Defense, Education, Consumer Electronics, Entertainment, Others) |
| Regional Analysis/Coverage | North America (US, Canada, Mexico), Europe (Eastern Europe [Poland, Romania, Hungary, Turkey, Rest of Eastern Europe] Western Europe] Germany, France, UK, Italy, Spain, Netherlands, Switzerland, Austria, Rest of Western Europe]), Asia Pacific (China, India, Japan, South Korea, Vietnam, Singapore, Australia, Rest of Asia Pacific), Middle East & Africa (Middle East [UAE, Egypt, Saudi Arabia, Qatar, Rest of Middle East], Africa [Nigeria, South Africa, Rest of Africa], Latin America (Brazil, Argentina, Colombia, Rest of Latin America) |
| Company Profiles | Lyncee Tec SA, Holoxica Ltd., Eon Reality Inc., RealView Imaging Ltd., Leia Inc., Phase Holographic Imaging AB, Zebra Imaging Inc., Ovizio Imaging Systems, NanoLive SA, TruLife Optics, MIT Media Lab, Holografika Kft., Geola Digital UAB, Jasper Display Corp., MDH Hologram Ltd. |
Frequently Asked Questions
Ans- Large data volumes and real-time processing demands pose technical challenges for scalability.
Ans- The rising adoption of digital holography in healthcare, industrial inspection, and research is driving market growth.
Ans- Asia-Pasific is expected to register the fastest CAGR during the forecast period.
Ans- The CAGR of the Digital Holography Market during the forecast period is 20.09% from 2024-2032.
Ans The Digital Holography Market was valued at USD 4.1 Billion in 2023 and is expected to reach USD 21.1 Billion by 2032.
Get in Touch
