Elastography Imaging Market Report Scope & Overview:

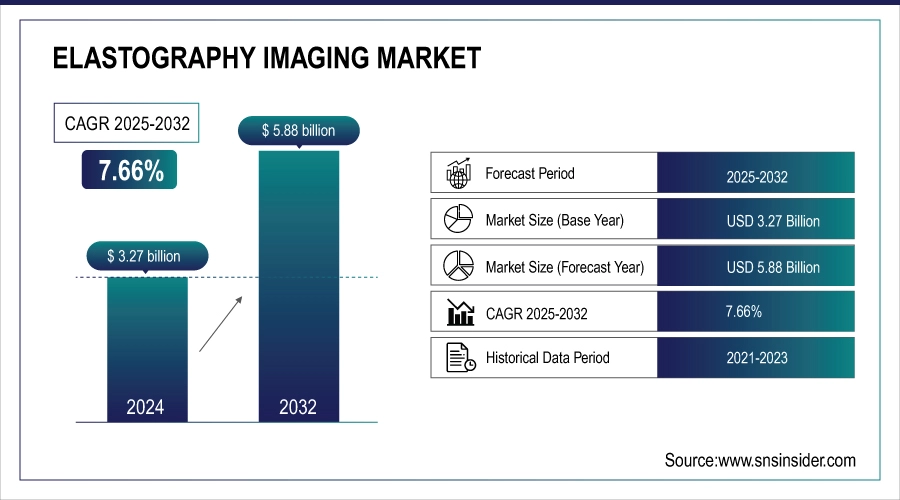
Elastography Imaging Market size was valued at USD 3.27 billion in 2024 and is expected to reach USD 5.88 billion by 2032, growing at a CAGR of 7.66% over the forecast period of 2025-2032. 

The increasing need for non-invasive diagnostics will be a significant driving factor for the elastography imaging market, since conventional techniques like biopsies are invasive, painful, and include risks of bleeding and infection. In contrast, elastography provides risk-free, real-time, and radiation-free ability to measure tissue stiffness, so it is particularly convenient for diagnosing liver diseases, cancer, and musculoskeletal problems. Its instant results without anesthetics and recovery time are a concept well accepted currently, and even in demand from hospitals and diagnostic centers, in tune with the worldwide change that the diagnostic test should be patient-friendly, quick, and with no risk.

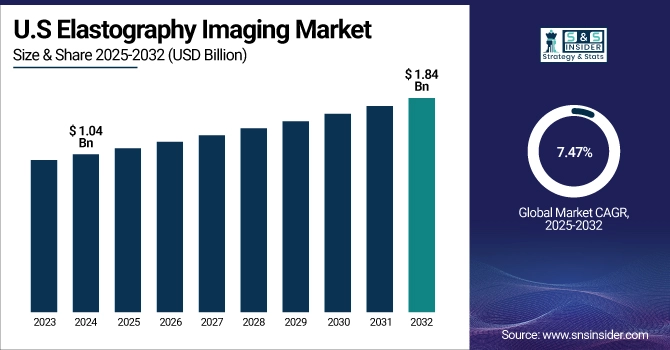
The U.S. Elastography Imaging Market was valued at USD 1.04 billion in 2024 and is expected to reach USD 1.84 billion by 2032, growing at a CAGR of 7.47% from 2025-2032.  

The global elastography imaging market is dominated by the U.S. Elastography is employed in both hospitals and diagnostic centers as a safe and non-invasive method for the diagnosis and follow-up of these diseases. Strong insurance population, high health care spending, and major imaging companies like GE Healthcare and Siemens also fuel its growth.

For instance, the Biden-Harris Administration announced that 21.3 million people selected an Affordable Care Act Health Insurance Marketplace plan during the 2024 Open Enrollment Period.

All these factors together make the United States the biggest and the fastest growing market for elastography imaging.

Market Dynamics:

Drivers

  • Rising Technological Advancements in Imaging Systems are driving the Elastography Imaging Market growth.

Growing improvements in imaging systems are also a key factor driving the elastography imaging market analysis, as advanced shear wave and strain elastography technologies equipped with AI-based algorithms and real-time imaging have been developed lately. They improve the accuracy of diagnosis through a quantitative, repeatable measurement of tissue stiffness, and they are vital for detecting liver fibrosis, cancer, and musculoskeletal diseases. Moreover, the development of portable and point-of-care (POC) elastography devices are revolutionizing clinical practice by providing faster and accessible diagnostics in outpatient clinics, emergency departments, and remote medical centers, and expanding the market out of the hospital toward hospitals.

  • Increasing Investments by Key Players are driving the Elastography Imaging Market growth.

Growing investments by several prominent medical imaging companies, which include GE Healthcare, Philips, Canon Medical, Siemens Healthineers, are a contributing factor to the growth of the elastography imaging market.

For instance, 14 May 2025, Siemens announced a €150 million investment in ultrasound innovation, focusing on strain and shear wave elastography, targeting faster liver and thyroid diagnostics using AI.

 Such companies are consistently developing and introducing new advanced elastography systems, offering better imaging, real-time analysis, and connection with AI for better diagnosis. For instance, GE Healthcare also recently added to its portfolio of ultrasound elastography solutions as demand increases for liver and breast imaging. These developments are lowering the barrier to entry and creating more effective elastography and enabling hospitals and diagnostic centers everywhere to reap the benefits of this technology without being invasive.

Restraints:

  • Shortage of skilled professionals is restraining the Elastography Imaging Market growth.

Lack of skilled professionals is one of the major challenging factors for the growth of the elastography imaging market.

For instance, WHO estimates a projected shortfall of 11 million health workers by 2030, mostly in low- and lower-middle-income countries.

 Accurately interpreting elastography results relies on the skill of trained radiologists and sonographers since the technology assesses tissue stiffness and subtle changes in images that demand clinical precision. Wherever it is practiced, however, most especially in developing countries and rural areas, there are few specialized training programs, and few specialists. Even if these tools are present, the lack of expert users can result in underuse or misdiagnosis, hampering the effectiveness and acceptance of elastography. This training deficit remains a challenge for the expansion of its use in everyday medical practice globally. Consequently, inadequately trained personnel can misapply technology, produce poor-quality images, or render the results incorrectly, all of which dilute the clinical usefulness of the elastography imaging market trend.

Segmentation Analysis:

By modality

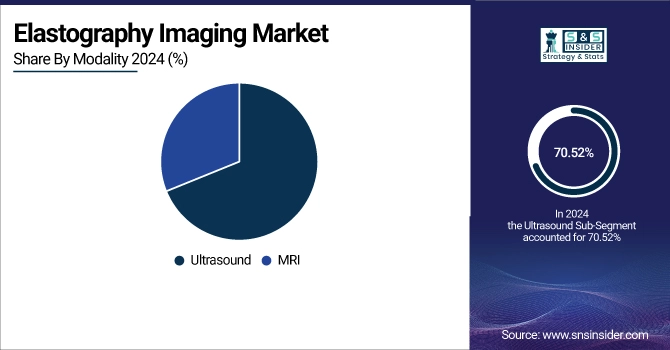
Ultrasound represents the dominant segment in the elastography imaging market, with a 70.52% market share in 2024. Because elastography imaging is cheaper, portable, and easier to use than other imaging tools such as MR elastography, it has the largest share in the elastography imaging market. It avoids radiation and enables real-time imaging, so it is particularly helpful in the staging of liver disease, assessment of breast lesions, and the examination of the thyroid and the prostate. The tool can be adapted for use in large hospitals and small clinics, including in rural and low-resource settings. Moreover, the development of shear wave and strain elastography has resulted in the efficacy of ultrasound surpassing that of many other imaging modalities, leading to its recent widespread use in virtually all medical disciplines. Its low cost, ease-of-use, and prevalence of clinical applications make ultrasound the major modality for elastography imaging around the world.

MRI plays a very important role in the elastography imaging market growth as it is the fastest-growing segment with a CAGR of 8.03%. Magnetic Resonance Imaging (MRI) is the fastest-growing segment in the elastography market because it provides very high diagnostic accuracy and non-invasive deep organ exploration not easily accessible to ultrasonography (US) (e.g., liver, brain, and pancreas) as well. Unlike ultrasound, MRI is not constrained by body habitus (e.g., obesity or ascites) and provides high-resolution, 3D images with quantitative measures that can be consistently monitored over time. This makes it especially invaluable in monitoring liver fibrosis stage in chronic liver disease, such as Non-Alcoholic Fatty Liver Disease (NAFLD) and hepatitis, or in neurological diseases like multiple sclerosis. The increasing uptake of high-end MRI systems in developed nations, along with increasing awareness regarding liver health are stimulating the demand.

By application

In 2024, the General Imaging segment dominated the elastography imaging market share with a 34.80%. General imaging rules over the market of elastography imaging as it can be performed on different body organs, including the liver, thyroid, breast, kidneys, and other soft tissues, and is versatile and always clinically in demand. It is clinically used to evaluate liver stiffness in chronic liver diseases, such as NAFLD, which affects greater than 25% of the world’s population, and to distinguish between benign and malignant masses in the breast or thyroid. General imaging modalities are non-invasive, cheap, and are currently included in routine healthcare checks or screening schemes. Given that many diseases are first or follow-up imaging of elastography, general imaging is the basis of early diagnosis.

Breast elastography is expected to witness the fastest growth during the forecast period as it enables early, accurate, and non-invasive diagnosis of breast tumors through the measurement of tissue stiffness, which is usually higher in malignant lumps than in benign lumps. Considering that breast cancer is the most common female cancer worldwide, with more than 2.3 million new cases diagnosed every year, there is increasing pressure to increase early detection. The technology is a painless, radiation-free, and cost-effective alternative to biopsies and is now available in conjunction with standard mammography and ultrasound.

By end-user

Hospitals are the largest and fastest growing market of the elastography imaging market, with 41.30% of market share and the CAGR of 8.05%. They have well-established facilities, large patient quotas, and the capacity to implement new medical innovations. Hospitals are local centers to diagnose and treat of variety of diseases Ð liver diseases, cancerous diseases, and musculoskeletal systems are to name a few, which enjoys from elastography quantitative imaging. They would generally have established radiology departments,  with skilled personnel and more financial resources, that can afford to purchase both the US and MRI elastography systems. Furthermore, the increasing prevalence of chronic diseases and the need for non-invasive diagnostic tools have led hospitals to include elastography in their practice for early disease detection and follow-up of diseases.

Regional Analysis:

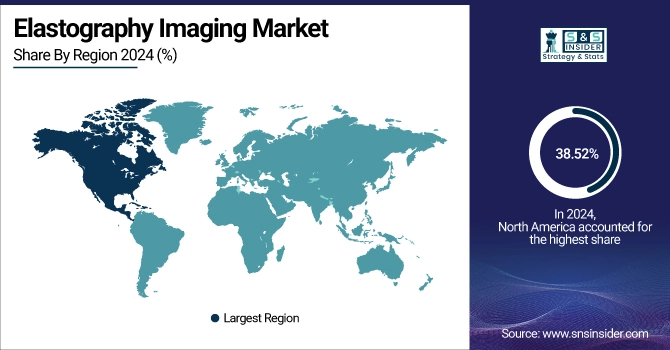
In 2024, the North American region dominated the elastography imaging market and accounted for 38.52% of the overall revenue share. North America dominates the market of elastography imaging, primarily due to the developed health care system with widespread access to novel imaging technologies and high prevalence of chronic diseases (such as liver diseases, breast cancer, and obesity related diseases (ORD)). The U.S. recorded more than USD 1.04 billion revenue in 2024. In the U.S., especially, ultrasound and MR elastography have been adopted broadly in hospitals and diagnostic facilities, aided by favourable reimbursement conditions.

The Asia Pacific region is projected to grow with the fastest CAGR of 8.10% over the forecast period. The elastography imaging market in APAC is expected to grow at the highest CAGR during the forecast period, owing to a large population (including a large patient population due to the high prevalence of chronic diseases such as liver diseases, cancer, and diabetes) and increasing awareness about non-invasive diagnostic tools. Rapidly developing countries such as China, India, and South Korea are increasingly focusing on the modernisation of health care, including the integration of ultrasound and MRI elastography systems into public and private hospitals. Government initiatives in healthcare, easier access to medical insurance, and low manufacturing costs contribute to the overall expansion of global and regional market players in the region. With the increasing need for early and accurate diagnosis, mostly in liver and breast imaging, the elastography market in the Asia-Pacific region is projected to show high growth in the coming years.

The availability of advanced imaging systems, established healthcare infrastructure, and high emphasis on preventive healthcare in Europe ensures a robust share in the elastography imaging market. Ultrasound and MRI elastography are widely adopted in Germany, France, and the UK, especially for liver disease, breast cancer, and musculoskeletal diseases. It benefits from strong public funding of healthcare, a favourable regulatory environment (CE mark), and an increasing focus on non-invasive and non-radiating diagnosis.

Latin America is also showing significant growth in the elastography imaging market due to the development of healthcare infrastructure and large patient pool for chronic diseases, and increasing access to advanced diagnostic technologies in the region, especially Brazil, Mexico, and Argentina. Increasing incidence of liver diseases, breast cancer, and other obesity related diseases is compelling the general population to demand early and non-invasive diagnosis like elastography. There is also growing interest from multinational imaging companies as well as state and local governments, seeking to strengthen their cross-sectional imaging capabilities in both urban and semi-urban territories. The breeze of non-radiation, low-cost imaging techniques are getting to the radiologists, while courses are getting better and better, getting to Elastography in a slow and safe way through Latin America.

Similar to Latin America, the Middle East and Africa also shows steady growth in the elastography imaging market in the Middle East & Africa is driven by a combination of rising healthcare investments, increasing awareness of non-invasive diagnostic methods, and a growing burden of chronic conditions such as liver diseases, cancers, and obesity-related disorders. Countries like Saudi Arabia, the UAE, and South Africa are actively modernizing their healthcare systems, establishing new hospitals, and equipping them with advanced imaging technologies, including elastography. Government initiatives aimed at improving early diagnosis and reducing dependence on invasive procedures are further supporting adoption.

Key Market Players:

Elastography Imaging Market companies include GE Healthcare, Siemens Healthineers, Philips Healthcare, Canon Medical System, Samsung Medison, Hitachi, Shenzhen Mindray, Bio-Medical Electronics, FUJIFILM Holdings, Resoundant Inc, and other players.

Recent Developments:

  • In early 2024, Resoundant expanded MR Elastography clinical collaborations. Resoundant partnered with academic hospitals in the U.S. and Europe to expand MR elastography use in brain and liver diagnostics.

  • In March 2025, Siemens announced enhanced AI-assisted elastography analysis integrated into its ACUSON Sequoia system, improving real-time liver fibrosis staging. The new AI tools offer automated quantification for improved workflow in large-volume hospital settings.

Elastography Imaging Market Report Scope

Report Attributes Details
Market Size in 2024 USD 3.27 billion     
Market Size by 2032 USD 5.88 billion      
CAGR CAGR of 7.66% From 2025 to 2032
Base Year 2024
Forecast Period 2025-2032
Historical Data 2021-2023
Report Scope & Coverage Market Size, Segments Analysis, Competitive Landscape, Regional Analysis, DROC & SWOT Analysis, Forecast Outlook
Key Segments • By modality (Ultrasound and MRI)
• By application (General Imaging, Hepatology,BreastUrology,Cardiology,Orthopedic and Musculoskeletal, and Others)
• By End User (Hospitals,AImaging Centers and Others)
Regional Analysis/Coverage North America (US, Canada, Mexico), Europe (Germany, France, UK, Italy, Spain, Poland, Turkey, Rest of Europe), Asia Pacific (China, India, Japan, South Korea, Singapore, Australia, Rest of Asia Pacific), Middle East & Africa (UAE, Saudi Arabia, Qatar, South Africa, Rest of Middle East & Africa), Latin America (Brazil, Argentina, Rest of Latin America)
Company Profiles GE Healthcare, Siemens Healthineers, Philips Healthcare, Canon Medical System, Samsung Medison, Hitachi, Shenzhen Mindray, Bio-Medical Electronics, FUJIFILM Holdings, Resoundant Inc and other plyers.  

Table of Contents

1. Introduction

1.1 Market Definition

1.2 Scope (Inclusion and Exclusions)

1.3 Research Assumptions

2. Executive Summary

2.1 Market Overview

2.2 Regional Synopsis

2.3 Competitive Summary

3. Research Methodology

3.1 Top-Down Approach

3.2 Bottom-up Approach

3.3. Data Validation

3.4 Primary Interviews

4. Market Dynamics Impact Analysis

4.1 Market Driving Factors Analysis

4.1.1 Drivers

4.1.2 Restraints

4.1.3 Opportunities

4.1.4 Challenges

4.2 PESTLE Analysis

4.3 Porter’s Five Forces Model

5. Statistical Insights and Trends Reporting

5.1 Incidence and Prevalence (2024)

5.2 Prescription Trends, (2024), by Region

5.3 Device Volume, by Region (2024-2032)

5,4 Healthcare Spending, by Region, (Government, Commercial, Private, Out-of-Pocket), 2024

6. Competitive Landscape

6.1 List of Major Companies, By Region

6.2 Market Share Analysis, By Region

6.3 Product Benchmarking

6.3.1 Product specifications and features

6.3.2 Pricing

6.4 Strategic Initiatives

6.4.1 Marketing and promotional activities

6.4.2 Distribution and Supply Chain Strategies

6.4.3 Expansion plans and new Product launches

6.4.4 Strategic partnerships and collaborations

6.5 Technological Advancements

6.6 Market Positioning and Branding

7. Elastography Imaging Market Segmentation, By modality

7.1 Chapter Overview

7.2 Ultrasound

7.2.1 Ultrasound Trend Market Analysis (2021-2032)

7.2.2 Ultrasound Market Size Estimates and Forecasts to 2032 (USD Billion)

7.3 MRI

7.3.1 MRI Trend Market Analysis (2021-2032)

7.3.2 MRI Market Size Estimates and Forecasts to 2032 (USD Billion)

8. Elastography Imaging Market Segmentation, By Application

8.1 Chapter Overview

8.2 General Imaging

8.2.1 General Imaging Market Trends Analysis (2021-2032)

8.2.2 General Imaging Market Size Estimates and Forecasts to 2032 (USD Billion)

8.3 Hepatology

8.3.1 Hepatology Market Trends Analysis (2021-2032)

8.3.2 Hepatology Market Size Estimates and Forecasts to 2032 (USD Billion)

8.4 Breast

8.4.1 Breast Market Trends Analysis (2021-2032)

8.4.2 Breast Market Size Estimates and Forecasts to 2032 (USD Billion)

8.5 Urology

8.5.1 Urology Market Trends Analysis (2021-2032)

8.5.2 Urology Market Size Estimates and Forecasts to 2032 (USD Billion)

8.6 Cardiology

8.6.1 Cardiology Market Trends Analysis (2021-2032)

8.6.2 Cardiology Market Size Estimates and Forecasts to 2032 (USD Billion)

8.7 Orthopedic and Musculoskeletal

8.7.1 Orthopedic and Musculoskeletal Market Trends Analysis (2021-2032)

8.7.2 Orthopedic and Musculoskeletal Market Size Estimates and Forecasts to 2032 (USD Billion)

8.8 Others

8.8.1 Others Market Trends Analysis (2021-2032)

8.8.2 Others Market Size Estimates and Forecasts to 2032 (USD Billion)

9. Elastography Imaging Market Segmentation, By End User

9.1 Chapter Overview

9.2 Hospitals

9.2.1 HospitalsMarket Trends Analysis (2021-2032)

9.2.2 HospitalsMarket Size Estimates and Forecasts to 2032 (USD Billion)

9.3 Imaging Centers           

9.3.1 Imaging CentersMarket Trends Analysis (2021-2032)

9.3.2 Imaging CentersMarket Size Estimates and Forecasts to 2032 (USD Billion)

9.4 Others

 9.4.1 OthersMarket Trends Analysis (2021-2032)

 9.4.2 Others Market Size Estimates and Forecasts to 2032 (USD Billion)

10. Elastography Imaging Market Segmentation, Regional Analysis

10.1 Chapter Overview

10.2 North America

10.2.1 Trends Analysis

10.2.2 North America Elastography Imaging Market Estimates and Forecasts, by Country (2021-2032) (USD Billion)

10.2.3 North America Elastography Imaging Market Estimates and Forecasts, By modality (2021-2032) (USD Billion) 

10.2.4 North America Elastography Imaging Market Estimates and Forecasts, By Application (2021-2032) (USD Billion)

10.2.5 North America Elastography Imaging Market Estimates and Forecasts, By End User (2021-2032) (USD Billion)

10.2.6 USA

10.2.6.1 USA Elastography Imaging Market Estimates and Forecasts, By modality (2021-2032) (USD Billion)

10.2.6.2 USA Elastography Imaging Market Estimates and Forecasts, By Application (2021-2032) (USD Billion)

10.2.6.3 USA Elastography Imaging Market Estimates and Forecasts, By End User (2021-2032) (USD Billion)

10.2.7 Canada

10.2.7.1 Canada Elastography Imaging Market Estimates and Forecasts, By modality (2021-2032) (USD Billion)

10.2.7.2 Canada Elastography Imaging Market Estimates and Forecasts, By Application (2021-2032) (USD Billion)

10.2.7.3 Canada Elastography Imaging Market Estimates and Forecasts, By End User (2021-2032) (USD Billion)

10.2.8 Mexico

10.2.8.1 Mexico Elastography Imaging Market Estimates and Forecasts, By modality (2021-2032) (USD Billion)

10.2.8.2 Mexico Elastography Imaging Market Estimates and Forecasts, By Application (2021-2032) (USD Billion)

10.2.8.3 Mexico Elastography Imaging Market Estimates and Forecasts, By End User (2021-2032) (USD Billion)

10.3 Europe

10.3.1 Trends Analysis

10.3.2 Europe Elastography Imaging Market Estimates and Forecasts, by Country (2021-2032) (USD Billion)

10.3.3 Europe Elastography Imaging Market Estimates and Forecasts, By modality (2021-2032) (USD Billion) 

10.3.4 Europe Elastography Imaging Market Estimates and Forecasts, By Application (2021-2032) (USD Billion)

10.3.5 Europe Elastography Imaging Market Estimates and Forecasts, By End User (2021-2032) (USD Billion)

10.3.6 Germany

10.3.1.6.1 Germany Elastography Imaging Market Estimates and Forecasts, By modality (2021-2032) (USD Billion)

10.3.1.6.2 Germany Elastography Imaging Market Estimates and Forecasts, By Application (2021-2032) (USD Billion)

10.3.1.6.3 Germany Elastography Imaging Market Estimates and Forecasts, By End User (2021-2032) (USD Billion)

10.3.7 France

10.3.7.1 France Elastography Imaging Market Estimates and Forecasts, By modality (2021-2032) (USD Billion)

10.3.7.2 France a Elastography Imaging Market Estimates and Forecasts, By Application (2021-2032) (USD Billion)

10.3.7.3 France Elastography Imaging Market Estimates and Forecasts, By End User (2021-2032) (USD Billion)

10.3.8 UK

10.3.8.1 UK Elastography Imaging Market Estimates and Forecasts, By modality (2021-2032) (USD Billion)

10.3.8.2 UK Elastography Imaging Market Estimates and Forecasts, By Application (2021-2032) (USD Billion)

10.3.8.3 UK Elastography Imaging Market Estimates and Forecasts, By End User (2021-2032) (USD Billion)

10.3.9 Italy

10.3.9.1 Italy Elastography Imaging Market Estimates and Forecasts, By modality (2021-2032) (USD Billion)

10.3.9.2 Italy Elastography Imaging Market Estimates and Forecasts, By Application (2021-2032) (USD Billion)

10.3.9.3 Italy Elastography Imaging Market Estimates and Forecasts, By End User (2021-2032) (USD Billion)

10.3.10 Spain

10.3.10.1 Spain Elastography Imaging Market Estimates and Forecasts, By modality (2021-2032) (USD Billion)

10.3.10.2 Spain Elastography Imaging Market Estimates and Forecasts, By Application (2021-2032) (USD Billion)

10.3.10.3 Spain Elastography Imaging Market Estimates and Forecasts, By End User (2021-2032) (USD Billion)

10.3.11 Poland

10.3.11.1 Poland Elastography Imaging Market Estimates and Forecasts, By modality (2021-2032) (USD Billion) 

10.3.11.2 Poland Elastography Imaging Market Estimates and Forecasts, By Application (2021-2032) (USD Billion)

10.3.11.3 Poland Elastography Imaging Market Estimates and Forecasts, By End User (2021-2032) (USD Billion)

10.3.12 Turkey

10.3.12.1 Turkey Elastography Imaging Market Estimates and Forecasts, By modality (2021-2032) (USD Billion)

10.3.12.2 Turkey Elastography Imaging Market Estimates and Forecasts, By Application (2021-2032) (USD Billion)

10.3.12.3 Turkey Elastography Imaging Market Estimates and Forecasts, By End User (2021-2032) (USD Billion)

10.3.13 Rest of Europe

10.3.13.1 Rest of Europe Elastography Imaging Market Estimates and Forecasts, By modality (2021-2032) (USD Billion)

10.3.13.2 Rest of Europe Elastography Imaging Market Estimates and Forecasts, By Application (2021-2032) (USD Billion)

10.3.13.3 Rest of Europe Elastography Imaging Market Estimates and Forecasts, By End User (2021-2032) (USD Billion)

10.4 Asia-Pacific

10.4.1 Trends Analysis

 10.4.2 Asia-Pacific Elastography Imaging Market Estimates and Forecasts, by Country (2021-2032) (USD Billion)

 10.4.3 Asia-Pacific Elastography Imaging Market Estimates and Forecasts, By modality (2021-2032) (USD Billion) 

 10.4.4 Asia-Pacific Elastography Imaging Market Estimates and Forecasts, By Application (2021-2032) (USD Billion)

 10.4.5 Asia-Pacific Elastography Imaging Market Estimates and Forecasts, By End User  (2021-2032) (USD Billion)

10.4.6 China

10.4.6.1 China Elastography Imaging Market Estimates and Forecasts, By modality (2021-2032) (USD Billion)

10.4.6.2 China Elastography Imaging Market Estimates and Forecasts, By Application (2021-2032) (USD Billion)

10.4.6.3 China Elastography Imaging Market Estimates and Forecasts, By End User (2021-2032) (USD Billion)

10.4.7 India

10.4.7.1 India Elastography Imaging Market Estimates and Forecasts, By modality (2021-2032) (USD Billion)

10.4.7.2 India Elastography Imaging Market Estimates and Forecasts, By Application (2021-2032) (USD Billion)

10.4.7.3 India Elastography Imaging Market Estimates and Forecasts, By End User (2021-2032) (USD Billion)

10.4.8 Japan

10.4.8.1 Japan Elastography Imaging Market Estimates and Forecasts, By modality (2021-2032) (USD Billion)

10.4.8.2 Japan Elastography Imaging Market Estimates and Forecasts, By Application (2021-2032) (USD Billion)

10.4.8.3 Japan Elastography Imaging Market Estimates and Forecasts, By End User (2021-2032) (USD Billion)

10.4.9 South Korea

10.4.9.1 South Korea Elastography Imaging Market Estimates and Forecasts, By modality (2021-2032) (USD Billion)

10.4.9.2 South Korea Elastography Imaging Market Estimates and Forecasts, By Application (2021-2032) (USD Billion)

10.4.9.3 South Korea Elastography Imaging Market Estimates and Forecasts, By End User (2021-2032) (USD Billion)

10.4.10 Singapore

10.4.10.1 Singapore Elastography Imaging Market Estimates and Forecasts, By modality (2021-2032) (USD Billion)

10.4.10.2 Singapore Elastography Imaging Market Estimates and Forecasts, By Application (2021-2032) (USD Billion)

10.4.10.3 Singapore Elastography Imaging Market Estimates and Forecasts, By End User (2021-2032) (USD Billion)

10.4.11 Australia

10.4.11.1 Australia Elastography Imaging Market Estimates and Forecasts, By modality (2021-2032) (USD Billion)

10.4.11.2 Australia Elastography Imaging Market Estimates and Forecasts, By Application (2021-2032) (USD Billion)

10.4.11.3 Australia Elastography Imaging Market Estimates and Forecasts, By End User (2021-2032) (USD Billion)

10.4.12 Rest of Asia-Pacific

10.4.12.1 Rest of Asia-Pacific Elastography Imaging Market Estimates and Forecasts, By modality (2021-2032) (USD Billion)

10.4.12.2 Rest of Asia-Pacific Elastography Imaging Market Estimates and Forecasts, By Application (2021-2032) (USD Billion)

10.4.12.3 Rest of Asia-Pacific Elastography Imaging Market Estimates and Forecasts, By End User (2021-2032) (USD Billion)

10.5 Middle East and Africa

10.5.1 Trends Analysis

10.5.2 Middle East and Africa East Elastography Imaging Market Estimates and Forecasts, by Country (2021-2032) (USD Billion)

10.5.3Middle East and Africa Elastography Imaging Market Estimates and Forecasts, By modality (2021-2032) (USD Billion) 

10.5.4 Middle East and Africa Elastography Imaging Market Estimates and Forecasts, By Application (2021-2032) (USD Billion)

10.5.5 Middle East and Africa Elastography Imaging Market Estimates and Forecasts, By End User (2021-2032) (USD Billion)

10.5.6 UAE

10.5.6.1 UAE Elastography Imaging Market Estimates and Forecasts, By modality (2021-2032) (USD Billion)

10.5.6.2 UAE Elastography Imaging Market Estimates and Forecasts, By Application (2021-2032) (USD Billion)

10.5.6.3 UAE Elastography Imaging Market Estimates and Forecasts, By End User (2021-2032) (USD Billion)

10.5.7 Saudi Arabia

10.5.7.1 Saudi Arabia Elastography Imaging Market Estimates and Forecasts, By modality (2021-2032) (USD Billion)

10.5.7.2 Saudi Arabia Elastography Imaging Market Estimates and Forecasts, By Application (2021-2032) (USD Billion)

10.5.7.3 Saudi Arabia Elastography Imaging Market Estimates and Forecasts, By End User (2021-2032) (USD Billion)

10.5.8 Qatar

10.5.8.1 Qatar Elastography Imaging Market Estimates and Forecasts, By modality (2021-2032) (USD Billion)

10.5.8.2 Qatar Elastography Imaging Market Estimates and Forecasts, By Application (2021-2032) (USD Billion)

10.5.8.3 Qatar Elastography Imaging Market Estimates and Forecasts, By End User (2021-2032) (USD Billion)

10.5.9 South Africa

10.5.9 1 South Africa Elastography Imaging Market Estimates and Forecasts, By modality (2021-2032) (USD Billion)

10.5.9 2 South Africa Elastography Imaging Market Estimates and Forecasts By Application (2021-2032) (USD Billion)

10.5.9 3 South Africa Elastography Imaging Market Estimates and Forecasts, By End User (2021-2032) (USD Billion)

10.5.10 Rest of Middle East & Africa

10.5.10.1 Rest of Middle East & Africa Elastography Imaging Market Estimates and Forecasts, By modality (2021-2032) (USD Billion)

10.5.10.2 Rest of Middle East & Africa Elastography Imaging Market Estimates and Forecasts, By Application (2021-2032) (USD Billion)

10.5.10.3 Rest of Middle East & Africa Elastography Imaging Market Estimates and Forecasts, By End User (2021-2032) (USD Billion)

10.6 Latin America

10.6.1 Trends Analysis

10.6.2 Latin America Elastography Imaging Market Estimates and Forecasts, by Country (2021-2032) (USD Billion)

10.6.3 Latin America Elastography Imaging Market Estimates and Forecasts, By modality (2021-2032) (USD Billion) 

10.6.4 Latin America Elastography Imaging Market Estimates and Forecasts, By Application (2021-2032) (USD Billion)

10.6.5 Latin America Elastography Imaging Market Estimates and Forecasts, By End User (2021-2032) (USD Billion)

10.6.6 Brazil

10.6.6.1 Brazil Elastography Imaging Market Estimates and Forecasts, By modality (2021-2032) (USD Billion)

10.6.6.2 Brazil Elastography Imaging Market Estimates and Forecasts, By Application (2021-2032) (USD Billion)

10.6.6.3 Brazil Elastography Imaging Market Estimates and Forecasts, By End User(2021-2032) (USD Billion)

10.6.7 Argentina

10.6.7.1 Argentina Elastography Imaging Market Estimates and Forecasts, By modality (2021-2032) (USD Billion)

10.6.7.2 Argentina Elastography Imaging Market Estimates and Forecasts, By Application (2021-2032) (USD Billion)

10.6.7.3 Argentina Elastography Imaging Market Estimates and Forecasts, By End User (2021-2032) (USD Billion)

10.6.8 Rest of Latin America

10.6.8.1 Rest of Latin America Elastography Imaging Market Estimates and Forecasts, By modality (2021-2032) (USD Billion)

10.6.8.2 Rest of Latin America Elastography Imaging Market Estimates and Forecasts, By Application (2021-2032) (USD Billion)

10.6.8.3 Rest of Latin America Elastography Imaging Market Estimates and Forecasts, By End User (2021-2032) (USD Billion)

12. Company Profiles

12.1 GE Healthcare

12.1.1 Company Overview

12.1.2 Financial

12.1.3 Products/ Services Offered

12.1.4 SWOT Analysis

12.2 Siemens Healthineers

12.2.1 Company Overview

12.2.2 Financial

12.2.3 Products/ Services Offered

12.2.4 SWOT Analysis

12.3 Philips Healthcare      

12.3.1 Company Overview

12.3.2 Financial

12.3.3 Products/ Services Offered

12.3.4 SWOT Analysis

12.4 Canon Medical System

12.4.1 Company Overview

12.4.2 Financial

12.4.3 Products/ Services Offered

12.4.4 SWOT Analysis

12.5 Samsung Medison       

12.5.1 Company Overview

12.5.2 Financial

12.5.3 Products/ Services Offered

12.5.4 SWOT Analysis

12.6 Shenzhen Mindray

12.6.1 Company Overview

12.6.2 Financial

12.6.3 Products/ Services Offered

12.6.4 SWOT Analysis

12.7 Bio-Medical Electronics

12.7.1 Company Overview

12.7.2 Financial

12.7.3 Products/ Services Offered

12.7.4 SWOT Analysis

12.8 FUJIFILM Holdings

12.8.1 Company Overview

12.8.2 Financial

12.8.3 Products/ Services Offered

12.8.4 SWOT Analysis

12.9 Resoundant Inc

12.9.1 Company Overview

12.9.2 Financial

12.9.3 Products/ Services Offered

12.9.4 SWOT Analysis

12.10 Hitachi

12.10.1 Company Overview

12.10.2 Financial

12.10.3 Products/ Services Offered

12.10.4 SWOT Analysis

12. Use Cases and Best Practices

13. Conclusion

Key Segments: 

By modality

  • Ultrasound

  • MRI

By application

  • General Imaging

  • Hepatology

  • Breast

  • Urology

  • Cardiology

  • Orthopedic and Musculoskeletal

  • Others

By end-user

  • Hospitals

  • Imaging Centers

  • Others

Request for Segment Customization as per your Business Requirement:Segment Customization Request

Regional Coverage: 

North America

  • US

  • Canada

  • Mexico

Europe

  • Germany

  • France

  • UK

  • Italy

  • Spain

  • Poland

  • Turkey

  • Rest of Europe

Asia Pacific

  • China

  • India

  • Japan

  • South Korea

  • Singapore

  • Australia

  • Rest of Asia Pacific

Middle East & Africa

  • UAE

  • Saudi Arabia

  • Qatar

  • South Africa

  • Rest of Middle East & Africa

Latin America

  • Brazil

  • Argentina

  • Rest of Latin America

Request for Country Level Research Report: Country Level Customization Request

Available Customization 

With the given market data, SNS Insider offers customization as per the company’s specific needs. The following customization options are available for the report: 

  • Detailed Volume Analysis 

  • Criss-Cross segment analysis (e.g. Product X Application) 

  • Competitive Product Benchmarking 

  • Geographic Analysis 

  • Additional countries in any of the regions 

  • Customized Data Representation 

  • Detailed analysis and profiling of additional market players

An accurate research report requires proper strategizing as well as implementation. There are multiple factors involved in the completion of good and accurate research report and selecting the best methodology to compete the research is the toughest part. Since the research reports we provide play a crucial role in any company’s decision-making process, therefore we at SNS Insider always believe that we should choose the best method which gives us results closer to reality. This allows us to reach at a stage wherein we can provide our clients best and accurate investment to output ratio.

Each report that we prepare takes a timeframe of 350-400 business hours for production. Starting from the selection of titles through a couple of in-depth brain storming session to the final QC process before uploading our titles on our website we dedicate around 350 working hours. The titles are selected based on their current market cap and the foreseen CAGR and growth.


The 5 steps process:

Step 1: Secondary Research:

Secondary Research or Desk Research is as the name suggests is a research process wherein, we collect data through the readily available information. In this process we use various paid and unpaid databases which our team has access to and gather data through the same. This includes examining of listed companies’ annual reports, Journals, SEC filling etc. Apart from this our team has access to various associations across the globe across different industries. Lastly, we have exchange relationships with various university as well as individual libraries.

Secondary Research

Step 2: Primary Research

When we talk about primary research, it is a type of study in which the researchers collect relevant data samples directly, rather than relying on previously collected data.  This type of research is focused on gaining content specific facts that can be sued to solve specific problems. Since the collected data is fresh and first hand therefore it makes the study more accurate and genuine.

We at SNS Insider have divided Primary Research into 2 parts.

Part 1 wherein we interview the KOLs of major players as well as the upcoming ones across various geographic regions. This allows us to have their view over the market scenario and acts as an important tool to come closer to the accurate market numbers. As many as 45 paid and unpaid primary interviews are taken from both the demand and supply side of the industry to make sure we land at an accurate judgement and analysis of the market.

This step involves the triangulation of data wherein our team analyses the interview transcripts, online survey responses and observation of on filed participants. The below mentioned chart should give a better understanding of the part 1 of the primary interview.

Primary Research

Part 2: In this part of primary research the data collected via secondary research and the part 1 of the primary research is validated with the interviews from individual consultants and subject matter experts.

Consultants are those set of people who have at least 12 years of experience and expertise within the industry whereas Subject Matter Experts are those with at least 15 years of experience behind their back within the same space. The data with the help of two main processes i.e., FGDs (Focused Group Discussions) and IDs (Individual Discussions). This gives us a 3rd party nonbiased primary view of the market scenario making it a more dependable one while collation of the data pointers.

Step 3: Data Bank Validation

Once all the information is collected via primary and secondary sources, we run that information for data validation. At our intelligence centre our research heads track a lot of information related to the market which includes the quarterly reports, the daily stock prices, and other relevant information. Our data bank server gets updated every fortnight and that is how the information which we collected using our primary and secondary information is revalidated in real time.

Data Bank Validation

Step 4: QA/QC Process

After all the data collection and validation our team does a final level of quality check and quality assurance to get rid of any unwanted or undesired mistakes. This might include but not limited to getting rid of the any typos, duplication of numbers or missing of any important information. The people involved in this process include technical content writers, research heads and graphics people. Once this process is completed the title gets uploader on our platform for our clients to read it.

Step 5: Final QC/QA Process:

This is the last process and comes when the client has ordered the study. In this process a final QA/QC is done before the study is emailed to the client. Since we believe in giving our clients a good experience of our research studies, therefore, to make sure that we do not lack at our end in any way humanly possible we do a final round of quality check and then dispatch the study to the client.