Fructooligosaccharides (FOS) Market Report Scope & Overview:
Get E-PDF Sample Report on Fructooligosaccharides Market - Request Sample Report
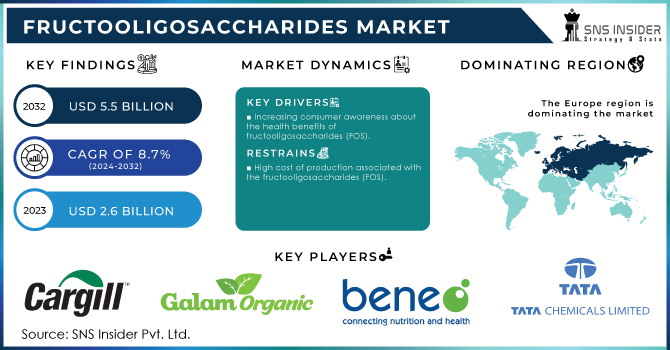
The Fructooligosaccharides Market Size was valued at USD 2.6 billion in 2023, and is expected to reach USD 5.5 billion by 2032, and grow at a CAGR of 8.7% over the forecast period 2024-2032.
Growing interest in healthier diets and demand for functional foods and beverages has basically driven the market for Fructooligosaccharides of late. It has basically been driven by increased awareness regarding health benefits accruing from the consumption of prebiotic fibers, in particular Fructooligosaccharides, towards the enhancement of digestive health and general wellbeing. In line with people going natural and organic, the demand for prebiotics is skyrocketing in general, reflecting a general lean toward ingredients that provide extra health value.
In this regard, current developments indicate a growing application of Fructooligosaccharides across industries. For instance, in June 2024, Danone, one of the largest food and beverage companies globally, launched gut-friendly and Fructooligosaccharides-enriched milk products to keep up with rising customer demand for ingredients providing gut health benefits. In 2024, in April, Ingredion Incorporated presented a fully integrated range of products in the bakery segment enriched with Fructooligosaccharides, which offered healthier bakery product alternatives. The above developments showcase the diversified Fructooligosaccharides and their formulation into a variety of food products.
The other major driving factor has been the rise of digestive disorders. On this note, in March 2024, Cargill revealed a new addition of a Fructooligosaccharides-based feed supplement that would improve gut health and feed efficiency in livestock. This typifies the accelerating role that Fructooligosaccharides is playing in this animal feed industry. One more important driving factor is regulatory and industry support accorded to Fructooligosaccharides in recent years. The EFSA guidelines on the use of Fructooligosaccharides in foodstuffs, updated in February 2024, paved the way for an even wider adoption of the ingredient. In May 2024, IFAA endorsed Fructooligosaccharides as a helpful ingredient in functional food products for promoting digestive health and gave impetus to market growth.
The trends in sustainability and clean label lead the market. Beneo of Switzerland introduced a new line of organic Fructooligosaccharides products in January 2024 in response to rapidly growing consumer demand for eco-friendly and more sustainable ingredient sourcing. That is against the larger backdrop of a market that is shifting toward more natural and less processed ingredients—increasingly demanded by consumers fueled through preferences for transparency and sustainability when it comes to the production of foods. Also, the Fructooligosaccharides market does not stop from the growth trajectory through new applications, changing regulatory frameworks, and emerging consumer trends.
Market Dynamics:
Drivers:
-
Increasing consumer awareness about the health benefits of fructooligosaccharides (FOS)
Growing consumer awareness about the health benefits derived from fructooligosaccharides consumption is one of the major factors driving the Fructooligosaccharides market. The more that is learned by consumers about digestive health and overall wellness, the more demand grows for products containing fructooligosaccharides as a result of its prebiotic properties. This awareness has been bolstered by various initiatives and product launches from leading companies. For example, new milk with added Fructooligosaccharides, touting the role of gut health and maintenance of a balanced microbiome, will be launched by Danone in June 2024. This launch was a part of the campaign with an unusually strong emphasis on the prebiotic benefit as part of consumer trends toward the natural and functional ingredients segment. Similarly, in April 2024, Ingredion Incorporated came up with bakery products that were rich in Fructooligosaccharrides and positioned them as a healthier solution since the oligosaccharides did not only provide sweetness to the foods but also contributed towards gut health. This positions the foods as capable of offering more than simple nutrition. It was in February 2024 that the EFSA also espoused the claimed health-related benefits of Fructooligosaccharides, boosting consumer confidence in the ingredients. Not without mention in explaining the growing popularity and, consequently, market growth, is the massive sensitization by corporates and regulatory bodies on the health benefits accruable from Fructooligosaccharides, as people seek functional foods that can support their well-being.
-
The growing prevalence of digestive disorders and the need for natural remedies
The fast-growing number of digestive disorders has increased the demand for natural remedies to a very large extent; one such remedy is that of fructooligosaccharides. Increased suffering from irritable bowel syndrome, constipation, and other conditions affecting the gastrointestinal system have shifted people toward natural solutions that would alleviate these problems without side effects. Due to its prebiotic properties, Fructooligosaccharides has become really popular among those who take their gut health issues seriously. For example, in July 2024, Japanese Meiji Holdings released a new line of functional beverages with added Fructooligosaccharides, aimed at helping people having digestive tract problems. Promotion of such products was positioned not only to help digestion but also to enhance mineral absorption and promote gut flora. In March 2024, Nestlé Health Science extended its portfolio to Fructooligosaccharides-based supplements for those suffering from digestive discomfort. The company said that Fructooligosaccharides is derived from natural origin and is also the real deal for driving a good gut environment, capitalizing on developing consumer demand for natural remedies underpinned by scientific evidence. These developments reflect the greater trend in the food and nutraceutical industries, where firms are more and more turning to Fructooligosaccharides products as a means of answering the growing demands from consumers for natural and effective digestive health solutions. This is also being driven by growing clinical research and recommendations from health professionals that continue to point to the benefits of Fructooligosaccharides as a safe and natural way to manage digestive disorders.
Restraints:
-
High cost of production associated with the fructooligosaccharides (FOS)
The high production cost is the major hurdle to the growth of the fructooligosaccharides market, as it limits the wide application of this sweetener. Generally, Fructooligosaccharides is extracted from chicory roots, whereby the extraction and purification processes involved are tough and not cheap. This adds to the costs, hence acting as a major barrier for manufacturers, especially considering the fact that the substitute synthetic sweeteners or alternative prebiotics are cheaper. For instance, Tate & Lyle, an international food and beverage ingredients company, was under pressure in February 2024 to raise its Fructooligosaccharides product line due to the high expenses of the raw materials and refining processes being too high. It noted down that with extraction of Fructooligosaccharides through advanced technologies and specialized equipment, the reason for the high production cost is what makes the extraction expensive. Moreover, in April 2024, French ingredient supplier Roquette came forward with similar concerns—that high operational costs hurt pricing strategies and competitive positioning. This not only increases the prices of Fructooligosaccharides-containing end products but also makes it hard for a small company to enter the market since they may not have sufficient capital and relevant technology to be more efficient at producing Fructooligosaccharides. This can therefore turn off price-sensitive consumers from the premium price that Fructooligosaccharides products command, thus hampering market growth, as manufacturers strive to find that sweet middle between quality and affordability.
Opportunities:
-
The expanding application of Fructooligosaccharides in various industries, such as pharmaceuticals and animal feed
-
Growing research and development activities to enhance the functionality and applications of Fructooligosaccharides
Challenges
-
Adhering to strict quality control measures and ensuring product safety
-
Fluctuating prices of raw materials and the volatility of the global market
KEY MARKET SEGMENTS
By Source
By source, chicory dominated the Fructooligosaccharides market, commanding a share of approximately 60% in 2023. This is mainly due to the high content of inulin present in it which can efficiently get hydrolyzed to produce Fructooligosaccharides. Chicory root is the rich and reliable source of inulin, a polysaccharide which acts as a precursor to Fructooligosaccharides. The extraction process from chicory is well established, cost-effective, and yields high-quality Fructooligosaccharides; therefore it is preferred by manufacturers. For instance, companies such as Beneo have been utilizing the rich inulin content of chicory for the production of Fructooligosaccharides, offering uniform quality and continuous supply. Compared to sucrose and other sources, including inulin from other plants, extraction processes are often more complex or less efficient and thus costly, with varying product quality. This dominance is backed by the scalability and reliability of chicory cultivation and processing, which assures a steady supply of raw material. Moreover, it already had an established infrastructure and technological advances in processing chicory-derived inulin into Fructooligosaccharides, thus further consolidating the leading position.
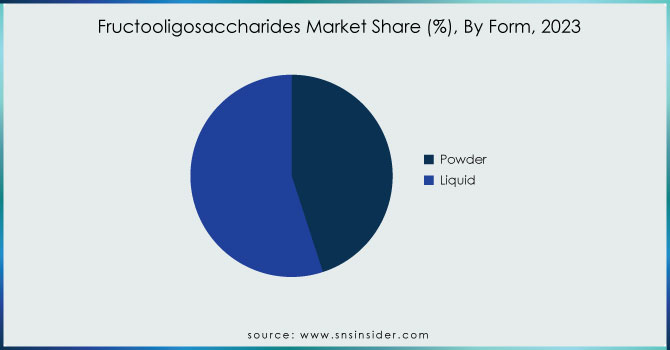
By Form
The liquid segment dominated the FOS market with a 55% share in 2023 due to its versatility and ease of incorporation into a wide range of products. FOS in liquid form is particularly preferred in the food and beverage industries since it easily blends into various formulations without changing the texture or involving any extra processing steps. This form is especially suitable in beverages, milk products, and syrups, in which it may serve as both a sweetener and a prebiotic ingredient. For example, in March 2023, Nestlé released a new range of functional beverages featuring liquid FOS and touting easier integration and improved solubility within liquid formulations. It is also one of the reasons why manufacturers are interested in liquid FOS: the possibility of preserving uniformity and functionality at a range of temperatures and over a range of pH values. This large share is attributed to the growing demand for convenience food and easily digestible food products, and also to the rising trend toward functional beverages. The superiority in usability and stability across a range of products will help it dominate the market over the powder form. Other than this, increasing ready-to-drink products and liquid dietary supplement demand has been contributing to the surging volume growth seen in liquid FOS.
Get Customized Report as Per Your Business Requirement - Request For Customized Report
By Application
In 2023, the Food & Beverages segment dominates the Fructooligosaccharides market. This could be assigned to the occurrence of FOS and wide application of this ingredient in most food and beverage products. FOS is such a versatile ingredient that acts as a sweetener and prebiotic agent naturally, naturally making it a very exciting ingredient in improving the nutritional profile of food products without compromising taste or texture. Food & Beverages is expected to account for close to 65% share by 2023. This huge share is primarily driven by the growing demand of consumers for health-oriented food products and increasing trend towards functional and natural ingredients. For instance, in April 2023, The Coca-Cola Company introduced a new line of beverages that are fortified with FOS for digestive health and as a naturally derived alternative to synthetic sweeteners. In February 2023, General Mills introduced FOS-enriched bakery products that focused on an ingredient that could provide health benefits without prejudicing the quality of final products. Such extensive application of FOS in those kinds of products undoubtedly gives it a place in terms of consumer preferences for health and functionality.
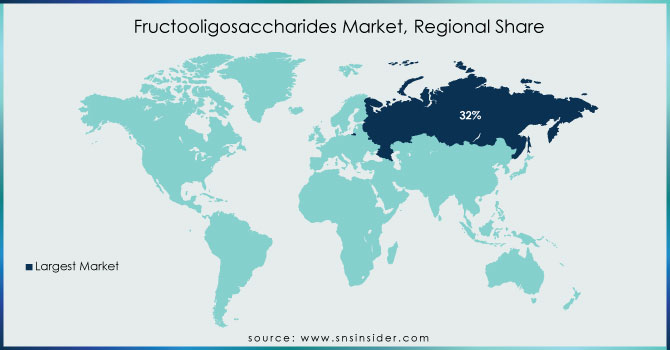
Regional Analysis
In 2023, Europe dominated the Fructooligosaccharides Market and accounted for a revenue share of 32%. One major driver behind this dominance in the Fructooligosaccharides Market by Europe is the enhancing consumer demand for natural and healthier food and beverage products. As people become more conscious about their diet, the allure of FOS, with its probable health benefits, grew multi-fold. This enhanced awareness has been one of the major driving factors for the market growth. In addition, EFSA is quite stringent about the safety and efficacy of FOS and approved it for both as a food ingredient and as a source of dietary fiber. Another reason which attributes to the dominance of Europe in the global market is the presence of a large number of infant formula manufacturers. With increased demand for food here, this has offered a great opportunity for the growth of the Fructo-oligosaccharides industry. Again, with the prevalence of obesity and an increasing number of diabetic patients in Europe, it added to its growth.
Moreover, in 2023, Asia-Pacific became the fastest-growing and held the highest revenue share of about 28% and finally the highest CAGR during the forecast period. The surge in growth may likely be because of increased consumer awareness about health and wellness coupled with increasing demand for functional foods and dietary supplements. Further, rising middle class and interest in natural and organic products increases FOS consumption in the region. This leading position is marked by a number of recent developments. For instance, in May 2023, an Indian company named Patanjali Ayurved announced its launch of new FOS-enriched health beverages targeting growing demand for digestive health products in the region. In a related development, the Chinese firm Baolingbao Biology Co., Ltd. increased its FOS production capacity in August 2023 to meet the rising demand from Asia-Pacific's food and beverages industries. Besides, shifting more focus toward health and well-being, combined with rapid economic growth in this region, further fuels the regional FOS market.
Key Players
The major key players are Tata Chemicals Ltd., Cargill Inc., Galam, Beneo, Biosynth, Meiji Holdings Co. Ltd., Ingredion Inc., Tereos Group, Baolingbao Biological Co., Ltd., Prebiotin, and other key players are mentioned in the final report.
Recent Developments
-
July 2024: Meiji launched new chocolate products that replace sugar with fructooligosaccharides, claiming they would adjust the intestinal flora to prevent various diseases.
-
May 2023: Beneo launched Beneo-scL85, an all-purpose short-chain Fructooligosaccharide (scFOS) for sugar reduction and enriching dietary fiber in a wide variety of food applications.
-
March 2023: Tereos had launched FOSbeauty, a breakthrough prebiotic ingredient for skin health that acts directly on the skin microbiota.
| Report Attributes | Details |
| Market Size in 2023 | US$ 2.6 Bn |
| Market Size by 2032 | US$ 5.5 Bn |
| CAGR | CAGR of 8.7% From 2024 to 2032 |
| Base Year | 2023 |
| Forecast Period | 2024-2032 |
| Historical Data | 2020-2022 |
| Report Scope & Coverage | Market Size, Segments Analysis, Competitive Landscape, Regional Analysis, DROC & SWOT Analysis, Forecast Outlook |
| Key Segments | By Source (Sucrose, Inulin, and Chicory) By Form (Powder and Liquid) By Application (Infant Formulation, Pharmaceutical, Food & Beverages, Dietary Supplements, and Pet/Animal Feed) |
| Regional Analysis/Coverage | North America (US, Canada, Mexico), Europe (Eastern Europe [Poland, Romania, Hungary, Turkey, Rest of Eastern Europe] Western Europe] Germany, France, UK, Italy, Spain, Netherlands, Switzerland, Austria, Rest of Western Europe]), Asia Pacific (China, India, Japan, South Korea, Vietnam, Singapore, Australia, Rest of Asia Pacific), Middle East & Africa (Middle East [UAE, Egypt, Saudi Arabia, Qatar, Rest of Middle East], Africa [Nigeria, South Africa, Rest of Africa], Latin America (Brazil, Argentina, Colombia Rest of Latin America) |
| Company Profiles | Tata Chemicals Ltd., Cargill Inc., Galam, Beneo, Biosynth, Meiji Holdings Co. Ltd., Ingredion Inc., Tereos Group, Baolingbao Biological Co., Ltd., Prebiotin |
| Key Opportunities | • The expanding application of FOS in various industries, such as pharmaceuticals and animal feed • Growing research and development activities to enhance the functionality and applications of FOS |
| Market Challenges | • Adhering to strict quality control measures and ensuring product safety • Fluctuating prices of raw materials and the volatility of the global market |
Get in Touch
