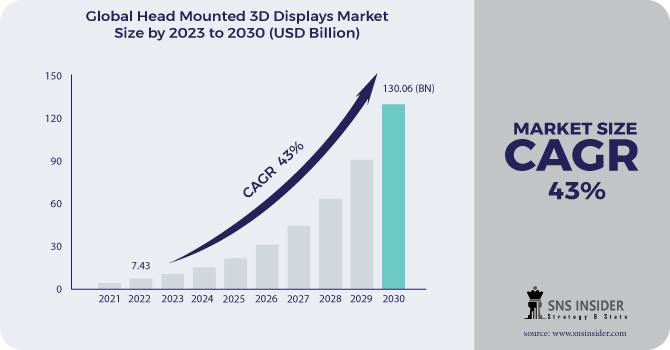
image

Head Mounted 3D Displays Market Report Scope & Overview:

The Head Mounted 3D Displays Market size was valued at USD 7.43 billion in 2022 and is expected to reach at USD 130.06 billion by 2030 and grow at a CAGR of 43% over the forecast period of 2023-2030. 

Head Mounted 3D Displays Market usually has one or two small mirrors, with lenses and mirrors embedded in eyeglasses, visors, or helmets. The display units are made of miniaturized and can include cathode ray tubes, liquid-crystal displays, liquid crystal in silicon, or organic light-emitting diodes. Some retailers use many smaller displays to increase overall clarity and viewing space. Head Mounted 3D Displays differ in that they can only display computer-generated images, or only live images from the physical world, or a combination. Most Head Mounted 3D Displays can only display a computer-generated image, sometimes called a virtual image. Some Head Mounted 3D Displays may allow CGI to be placed at the top of the real world view. This is sometimes called augmented reality (AR) or mix reality (MR). Combining real world views with CGI can be done by displaying CGI with a mirror that shows the part and real world view. This method is often called optical see-through. Combining real-world and CGI views can also be accomplished electronically by receiving video from the camera and mixing it with CGI.

Head Mounted 3D Displays Market Revenue 2030

Get more information on Head Mounted 3D Displays Market - Request Sample Report

MARKET DYNAMICS: 

KEY DRIVERS:

  • Increase in the investments toward the development of Head Mounted 3D Displays Market.

  • AR is being adopted by industries such as consumer electronics, aerospace and defence, healthcare, retail, and advertising due to its benefits.

RESTRAINTS: 

  • User experience and product development information.

  • Lack of rating causes problems for interaction between products from different vendors.

  • Head-mounted 3D displays, VR, and AR require similar standards that allow developers to create open and interactive applications.

OPPORTUNITIES: 

  • High level of penetration into video games.

  • produce digital images, allowing 3D viewing to enhance user experience by displaying images and game screens as real-world images.

  • Companies are introducing a wide range of AR and VR games.

CHALLENGES:

  • The placement of locks and segregation mechanisms.

  • Disrupted the Head-mounted 3D display market. 

IMPACT OF COVID-19:

The head-mounted 3D display market includes major Tier I and II providers These suppliers have their production facilities spread across various countries throughout the United States, Europe, APAC, and RoW. COVID-19 has had an impact on their businesses.The outbreak has had a negative impact on the head-mounted 3D display market, as some of the leading players are based in China, the origin of the epidemic. Moreover, in view of the current situation, key market players are currently focused on maintaining and generating operational capital, which has reduced the number of market developments.

MARKET SEGMENTATION:

BY TYPE

  • LCD Displays

  • OLED Displays

  • Other

BY RESOLUTION

  • 1280x720

  • 1280x1024

  • Other

BY TECHNOLOGY

  • AR Technology

  • VR Technology

BY APPLICATION

  • Home Appliance

  • Medical

  • Automotive

  • Aviation & Navigation

  • Gaming & Video

  • Sports

  • Training & Simulation

  • Other

Head Mounted 3D Displays Market Segment Pie Chart

Get Customized Report as per your Business Requirement - Request For Customized Report

REGIONAL ANALYSIS:

The market is divided into five regions: North America, Europe, Asia Pacific, Latin America, and the Middle East and Africa (MEA). North America has also been divided into countries such as the United States and Canada. The European region is also divided into the United Kingdom, France, Germany, Italy, Spain, Russia, and Europe as a whole. China, Japan, South Korea, India, Australia, South East Asia, and the rest of Asia Pacific are also subdivided. The Latin American region is further subdivided into Brazil, Mexico, and the rest of Latin America, while the Middle East and Africa region is further subdivided into GCC, Turkey, South Africa, and the rest of MEA.

REGIONAL COVERAGE:

  • North America

    • USA

    • Canada

    • Mexico

  • Europe

    • Germany

    • UK

    • France

    • Italy

    • Spain

    • The Netherlands

    • Rest of Europe

  • Asia-Pacific

    • Japan

    • south Korea

    • China

    • India

    • Australia

    • Rest of Asia-Pacific

  • The Middle East & Africa

    • Israel

    • UAE

    • South Africa

    • Rest of Middle East & Africa

  • Latin America

    • Brazil

    • Argentina

    • Rest of Latin America

KEY PLAYERS:

Major key players in Global Head Mounted 3D Displays Market are Sony, Seiko, Epson, Oculus VR, Rockwell Collins, Kopin Corporation, Google, HTC, Elbit System, Recon Instruments, Samsung, Huawei, Osterhout Design Group, Sensics, Thales Visionix, Microsoft, Xiaomi and other.

Sony-Company Financial Analysis

Company Landscape Analysis


Frequently Asked Questions

The placement of locks and segregation mechanisms disrupted the Head-mounted 3D display market.

Top-down research, bottom-up research, qualitative research, quantitative research, and Fundamental research.

Major key players in Global Head Mounted 3D Displays Market are Sony, Seiko, Epson, Oculus VR, Rockwell Collins, Kopin Corporation, Google, HTC, Elbit System, Recon Instruments, Samsung, Huawei, Osterhout Design Group, Sensics, Thales Visionix, Microsoft, Xiaomi and other.

Yes, and they are Raw material vendors, Distributors/traders/wholesalers/suppliers, Regulatory authorities, including government agencies and NGO, Commercial research & development (R&D) institutions, Importers and exporters, Government organizations, research organizations, and consulting firms, Trade/Industrial associations, End-use industries.

Manufacturers, Consultants, Association, Research Institutes, private and university libraries, suppliers, and distributors of the product.

Table of Contents

1. Introduction

1.1 Market Definition

1.2 Market Scope

1.3 Research Assumptions

2. Research Methodology

3. Market Dynamics

3.1 Drivers

3.2 Restraints

3.3 Opportunities

3.4 Challenges

4. Impact Analysis

4.1 COVID-19 Impact Analysis

4.2 Impact of Ukraine- Russia war

4.3 Impact of ongoing Recession

4.3.1 Introduction

4.3.2 Impact on major economies

4.3.2.1 US

4.3.2.2 Canada

4.3.2.3 Germany

4.3.2.4 France

4.3.2.5 United Kingdom

4.3.2.6 China

4.3.2.7 Japan

4.3.2.8 South Korea

4.3.2.9 Rest of the World

5. Value Chain Analysis

6. Porter’s 5 forces model

7.  PEST Analysis

8. Global Head Mounted 3D Displays Market Segmentation, by Type

8.1Introduction

8.2 LCD Displays

8.3 OLED Displays

8.4 Other

9. Global Head Mounted 3D Displays Market Segmentation, by Resolution

9.1 Introduction

9.2 1280x720

9.3 1280x1024

9.4 Other

10. Global Head Mounted 3D Displays Market Segmentation, By Technology

10.1 Introduction

10.2 AR Technology

10.3 VR Technology

10.4 other

11. Global Head Mounted 3D Displays Market Segmentation, By Application

11.1 Introduction

11.2 Home Appliance

11.3 Medical

11.4 Automotive

11.6 Aviation & Navigation

11.7 Gaming & Video

11.8 Sports

11.9 Training & Simulation

12. Regional Analysis

12.1 Introduction

12.2 North America

12.2.1 USA

12.2.2    Canada

12.2.3    Mexico

12.3      Europe

12.3.1    Germany

12.3.2    UK

12.3.3    France

12.3.4    Italy

12.3.5    Spain

12.3.6    The Netherlands

12.3.7    Rest of Europe

12.4        Asia-Pacific

12.4.1    Japan

12.4.2    South Korea

12.4.3    China

12.4.4    India

12.4.5    Australia

12.4.6    Rest of Asia-Pacific

12.5        The Middle East & Africa

12.5.1    Israel

12.5.2    UAE

12.5.3    South Africa

12.5.4    Rest

12.6        Latin America

12.6.1    Brazil

12.6.2    Argentina

12.6.3    Rest of Latin America

13. Company Profiles

13.1Sony

13.1.1 Financial

13.1.2 Products/ Services Offered

13.1.3 SWOT Analysis

13.1.4 The SNS view

13.2 Seiko Epson

13.3 Oculus VR

13.4 Rockwell Collins

13.5 Kopin Corporation

13.6 Google

13.7 HTC

13. 8Elbit System

13.9 Recon Instruments

13.10 Samsung

13.11 Huawei

13.12 Osterhout Design Group

13.13Sensics

13.13 Thales Visionix

13.14 Microsoft

13.16 Xiaomi

14. Competitive Landscape

14.1 Competitive Benchmark

14.2 Market Share Analysis

14.3 Recent Developments

15. Conclusion

An accurate research report requires proper strategizing as well as implementation. There are multiple factors involved in the completion of good and accurate research report and selecting the best methodology to compete the research is the toughest part. Since the research reports we provide play a crucial role in any company’s decision-making process, therefore we at SNS Insider always believe that we should choose the best method which gives us results closer to reality. This allows us to reach at a stage wherein we can provide our clients best and accurate investment to output ratio.

Each report that we prepare takes a timeframe of 350-400 business hours for production. Starting from the selection of titles through a couple of in-depth brain storming session to the final QC process before uploading our titles on our website we dedicate around 350 working hours. The titles are selected based on their current market cap and the foreseen CAGR and growth.


The 5 steps process:

Step 1: Secondary Research:

Secondary Research or Desk Research is as the name suggests is a research process wherein, we collect data through the readily available information. In this process we use various paid and unpaid databases which our team has access to and gather data through the same. This includes examining of listed companies’ annual reports, Journals, SEC filling etc. Apart from this our team has access to various associations across the globe across different industries. Lastly, we have exchange relationships with various university as well as individual libraries.

Secondary Research

Step 2: Primary Research

When we talk about primary research, it is a type of study in which the researchers collect relevant data samples directly, rather than relying on previously collected data.  This type of research is focused on gaining content specific facts that can be sued to solve specific problems. Since the collected data is fresh and first hand therefore it makes the study more accurate and genuine.

We at SNS Insider have divided Primary Research into 2 parts.

Part 1 wherein we interview the KOLs of major players as well as the upcoming ones across various geographic regions. This allows us to have their view over the market scenario and acts as an important tool to come closer to the accurate market numbers. As many as 45 paid and unpaid primary interviews are taken from both the demand and supply side of the industry to make sure we land at an accurate judgement and analysis of the market.

This step involves the triangulation of data wherein our team analyses the interview transcripts, online survey responses and observation of on filed participants. The below mentioned chart should give a better understanding of the part 1 of the primary interview.

Primary Research

Part 2: In this part of primary research the data collected via secondary research and the part 1 of the primary research is validated with the interviews from individual consultants and subject matter experts.

Consultants are those set of people who have at least 12 years of experience and expertise within the industry whereas Subject Matter Experts are those with at least 15 years of experience behind their back within the same space. The data with the help of two main processes i.e., FGDs (Focused Group Discussions) and IDs (Individual Discussions). This gives us a 3rd party nonbiased primary view of the market scenario making it a more dependable one while collation of the data pointers.

Step 3: Data Bank Validation

Once all the information is collected via primary and secondary sources, we run that information for data validation. At our intelligence centre our research heads track a lot of information related to the market which includes the quarterly reports, the daily stock prices, and other relevant information. Our data bank server gets updated every fortnight and that is how the information which we collected using our primary and secondary information is revalidated in real time.

Data Bank Validation

Step 4: QA/QC Process

After all the data collection and validation our team does a final level of quality check and quality assurance to get rid of any unwanted or undesired mistakes. This might include but not limited to getting rid of the any typos, duplication of numbers or missing of any important information. The people involved in this process include technical content writers, research heads and graphics people. Once this process is completed the title gets uploader on our platform for our clients to read it.

Step 5: Final QC/QA Process:

This is the last process and comes when the client has ordered the study. In this process a final QA/QC is done before the study is emailed to the client. Since we believe in giving our clients a good experience of our research studies, therefore, to make sure that we do not lack at our end in any way humanly possible we do a final round of quality check and then dispatch the study to the client.

Start a Conversation

Hi! Click one of our member below to chat on Phone