Interactive Whiteboard Market Size:
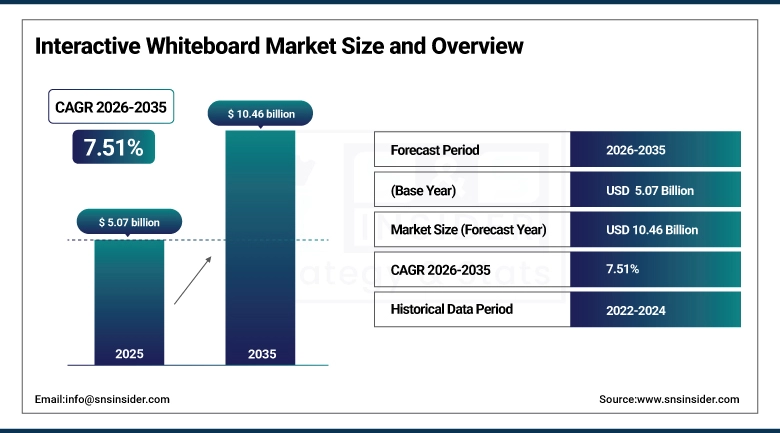
The Interactive Whiteboard Market Size was valued at USD 5.07 billion in 2025 and is expected to reach USD 10.46 billion by 2035 and grow at a CAGR of 7.51% over the forecast period 2026-2035.
The corporate sector's adoption of interactive whiteboards for virtual meetings, training programs, and remote working also presents significant growth opportunities. These digital whiteboards combine the similarities of physical presentations and the technology of computers. Interactive whiteboards allow for seamless integration of digital content, eliminate all the delays, and implement a smooth presentation. By integrating with video conferencing software, they ensure remote team members feel included. Everyone can access and interact with the same information on the screen, regardless of location. This fosters a more unified team experience and improves communication across geographical boundaries.
Market Size and Forecast:
-
Market Size in 2025 USD 5.07 Billion
-
Market Size by 2035 USD 10.46 Billion
-
CAGR of 7.51% From 2026 to 2035
-
Base Year 2025E
-
Forecast Period 2026-2035
-
Historical Data 2021-2024
Get more information on Interactive Whiteboard Market - Request Free Sample Report
Interactive Whiteboard Market Trends:
• Rapid adoption of multi-touch and gesture-based interfaces enabling simultaneous interaction and collaborative learning in classrooms and corporate environments.
• Growing integration of AI-driven features such as handwriting recognition, voice commands, and adaptive learning tools to personalize user experiences.
• Increasing use of cloud-based platforms for seamless content sharing, remote access, and real-time collaboration across hybrid and virtual learning setups.
• Rising government investments in digital education infrastructure to improve learning outcomes and bridge the urban–rural technology gap.
• Expansion of ecosystem-based interactive boards with certified operating systems and app marketplaces, enabling easy access to educational and productivity applications.
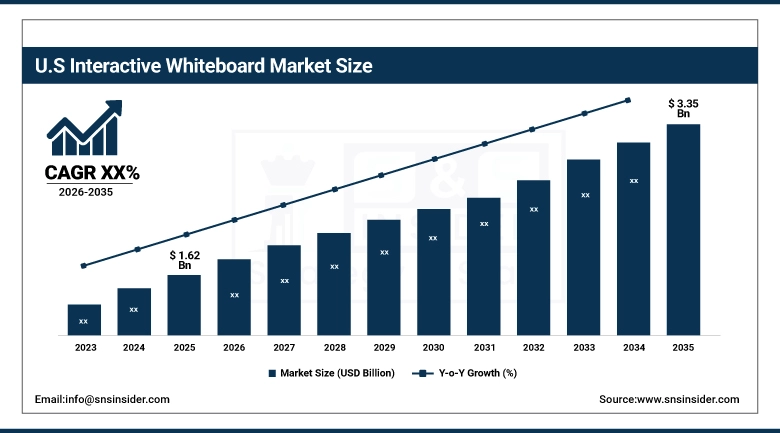
U.S. Interactive Whiteboard Market Size Outlook:
The U.S. Interactive Whiteboard Market is projected to grow from USD 1.62 Billion in 2025 to USD 3.35 Billion by 2035. Growth is driven by increasing adoption of hybrid learning models, rising demand for collaborative digital classrooms, federal funding for EdTech upgrades, and growing deployment of interactive displays in corporate training rooms and government sectors.
Interactive Whiteboard Market Growth Drivers: Various advancements in technologies the IWB’s more user-friendly
The interactive whiteboard market is constantly evolving with new and innovative technologies. These advancements are making IWBs more user-friendly, feature-rich, and cost-effective, thereby increasing their appeal to a wider audience. Modern IWBs boast advanced touch recognition capabilities that allow for a more natural and intuitive user experience. Multi-touch functionality enables multiple users to interact with the board simultaneously, fostering collaboration and group activities. AI is making its way into IWBs, offering features like real-time handwriting recognition, voice recognition, and adaptive learning tools. These AI-powered features personalize the learning experience by tailoring content and activities to individual student needs. Cloud integration allows for easy access to learning materials, collaboration tools, and student data from anywhere. This enhances flexibility and facilitates remote learning scenarios effectively.
Interactive Whiteboard Market Restraints: High Cost of the Interactive Whiteboards
Despite the growing demand, the high cost of interactive whiteboards remains a major restraint for the market. Compared to traditional whiteboards, IWBs demand a high price. Many IWBs require a separate projector to display the interactive content. The cost of the projector can vary depending on its features and resolution. Setting up an IWB can be a complex process, especially for larger models. This often necessitates professional installation services, adding to the overall cost. IWBs typically require specialized software for operation and content management. These software licenses can be expensive, and ongoing maintenance costs need to be factored in as well. The high initial investment can be a major hurdle for schools and businesses, particularly those with limited budgets. This is especially true for smaller institutions and those located in economically disadvantaged regions.
Interactive Whiteboard Market Segment Analysis:
By Technology
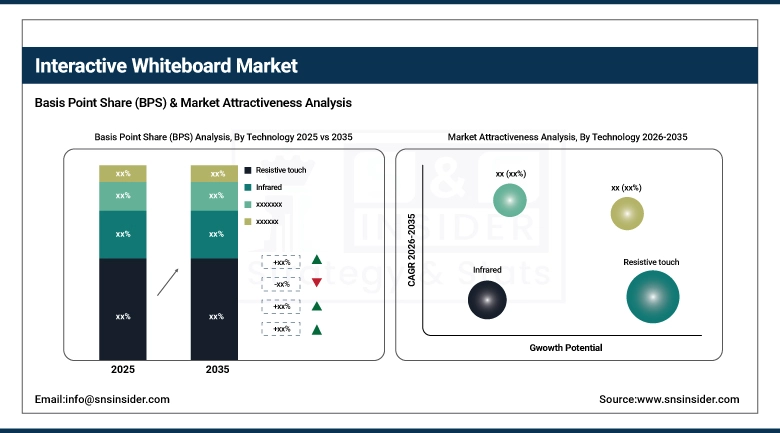
The resistive touch segment is dominating the market with a market share of over 42.55% in 2025E due to its adaptability in various areas. Resistive screens respond immediately when touched by fingers, styluses, or even other objects. This versatility makes them perfect for a wide range of uses, from classrooms to business presentations to interactive kiosks in stores.
However, the capacitive segment is growing at a very steady rate in the forecasted period 2026 to 2035. Capacitive technology gives a highly responsive and accurate touch experience. This improved user experience is driving the demand for capacitive touchscreens in interactive whiteboards, used in schools, businesses, and more.
By Form
In 2025, the portable segment by form carries a major market share of around 53%. This is because people are increasingly looking for flexible and easy ways to learn and present data. With the portable IWBs teachers can teach from anywhere and corporate meetings can take place even remotely.
Demand for fixed interactive whiteboards is also increasing day by day, with a predicted CAGR rate of above 6.01% from 2026 to 2035. This growth is fueled by the increasing adoption of digital transformation initiatives across many industries. Fixed boards allow organizations to ditch paper and embrace digital workflows, streamlining processes and using digital content to boost productivity and efficiency.
By Technique
The front projection whiteboards segment is currently the market leader, holding over 63.6% share in 2025. These projections can be easily adapted for bigger screens, making them ideal for classrooms, auditoriums, and conference rooms where everyone can get a good view of the screen.
On the other hand, the rear projection whiteboards segment is expected to see competitive growth in the upcoming years from 2026 to 2035. These whiteboards offer an engaging user experience by projecting images from behind the screen which makes it more exciting for the users to look at the presentation going on in the screen.
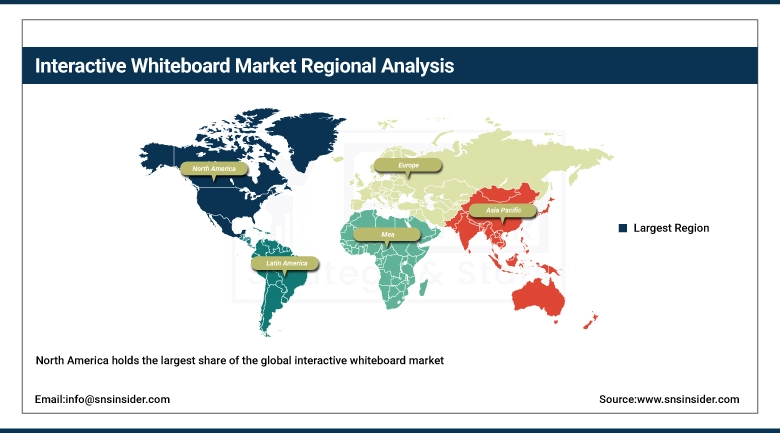
Interactive Whiteboard Market Regional Analysis:
North America Interactive Whiteboard Market Insights
North America holds the largest share of the global interactive whiteboard market, driven by the adoption of these boards in educational institutions and businesses. The integration of interactive whiteboards with Learning Management Systems (LMS) is a major factor. This seamless integration allows educators to easily access and deliver content directly from their LMS, streamlining lesson planning and assessments.
Get Customized Report as per Your Business Requirement - Enquiry Now
Europe Interactive Whiteboard Market Insights
Many European countries are prioritizing investments in educational technology to modernize their education systems and improve digital literacy. Government funding and incentives for integrating technology in classrooms encourage schools to adopt interactive whiteboards. The UK's ongoing digital transformation in education is driving the interactive whiteboard market followed by Germany and France. As technology becomes more integrated into classrooms, these boards are becoming essential tools for educators to improve student engagement and learning outcomes.
Asia Pacific Interactive Whiteboard Market Insights
The Asia Pacific region has seen a surge in adopting student information systems and e-learning solutions. This trend is driven by technological advancements, rising internet penetration rates, and a growing focus on digital literacy and remote learning. As a result, educational institutions across the region are integrating these technologies to enhance the learning experience. The Chinese market offers a wide range of products from established manufacturers and innovative startups, catering to different needs in education and business settings.
Interactive Whiteboard Companies are:
-
Epson
-
Microsoft
-
Google
-
Cisco Systems
-
Hitachi Ltd.
-
Hon Hai Precision Industry Co. Ltd.
-
Newline
-
Panasonic Corporation
-
Promethean Ltd.
-
Samsung
-
Ricoh
-
NEC Corporation
-
ViewSonic
-
Smart Technologies
Competitive Landscape for Interactive Whiteboard Market:
Samsung is a key participant in the interactive whiteboard market, offering large-format displays and interactive solutions designed for digital classrooms and collaborative workspaces. The company leverages its expertise in display technology, connectivity, and software integration to support interactive learning, content sharing, and hybrid education environments globally.
-
In 2025, Samsung introduced Samsung Flip Pro which allows up to four users to write and draw simultaneously. Ans it also offers brush and pen mode for different writing styles.
Avocor is an established player in the interactive whiteboard market, delivering premium interactive displays tailored for classrooms and collaborative business environments. The company focuses on high-precision touch technology, seamless integration with leading collaboration platforms, and user-friendly design to enhance engagement, teamwork, and digital learning experiences.
-
In 2023, Avocor launched AV-65U, a budget-friendly interactive whiteboard with 4K resolution that offers 20-point multi-touch for smooth and responsive interaction. It also includes built-in software for writing, drawing, and highlighting content.
| Report Attributes | Details |
|---|---|
| Market Size in 2025 | USD 5.07 Billion |
| Market Size by 2035 | USD 10.46 Billion |
| CAGR | CAGR of 7.51% From 2026 to 2035 |
| Base Year | 2025 |
| Forecast Period | 2026-2035 |
| Historical Data | 2021-2024 |
| Report Scope & Coverage | Market Size, Segments Analysis, Competitive Landscape, Regional Analysis, DROC & SWOT Analysis, Forecast Outlook |
| Key Segments |
|
| Regional Analysis/Coverage | North America (US, Canada), Europe (Germany, UK, France, Italy, Spain, Russia, Poland, Rest of Europe), Asia Pacific (China, India, Japan, South Korea, Australia, ASEAN Countries, Rest of Asia Pacific), Middle East & Africa (UAE, Saudi Arabia, Qatar, South Africa, Rest of Middle East & Africa), Latin America (Brazil, Argentina, Mexico, Colombia, Rest of Latin America). |
| Company Profiles | BenQ Corporation, Epson, Microsoft, Google, Boxlight, Cisco Systems, Hitachi Ltd., Hon Hai Precision Industry Co. Ltd., Newline, Panasonic Corporation, Promethean Lts, Samsung, Ricoh,NEC Corporation, ViewSonic, Smart Technologies |
Get in Touch
