IPS Displays Market Report Scope & Overview:
Get more information on IPS Displays Market - Request Sample Report
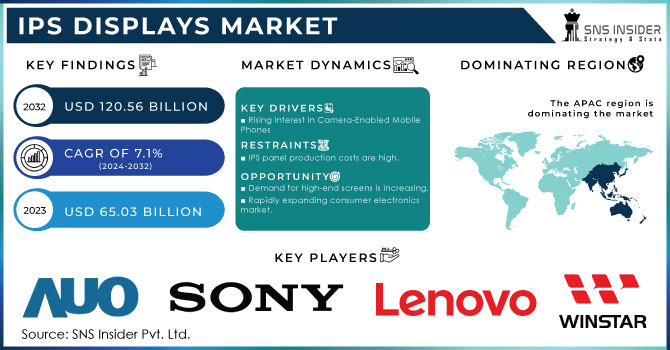
The IPS Displays Market size is expected to be valued at USD 65.03 Billion in 2023. It is estimated to reach USD 120.56 Billion by 2032, with a growing CAGR of 7.1% over the forecast period 2024-2032.
The In-Plane Switching (IPS) Displays market will be greatly impacted by the significant increase in semiconductor manufacturing. Enhancing its semiconductor infrastructure will enhance manufacturing top-quality components essential for IPS displays in the United States. Key players in the IPS displays industry like LG Displays, Samsung Displays, and BOE will benefit from the increased availability of advanced semiconductor technologies and components. These advances will result in improvements in displays performance, energy efficiency, and manufacturing capacities. Furthermore, as American manufacturers continue to invest more in worldwide semiconductor industry, they will be better prepared to meet the increasing demand for advanced displays technologies in smartphones, laptops, and digital signage. Hence, the rapid growth of semiconductor capabilities in America will significantly boost the IPS displays market by ensuring a steady supply of advanced components and driving progress in displays technologies. The U.S. semiconductor sector is experiencing a transformative expansion period, fueled by substantial investments and government support like the CHIPS Act. In 2032, it is expected that the fab capacity in the U.S. will grow by 203%, the highest rate of growth worldwide and a significant improvement from the 11% increase seen in the previous decade. The increase in domestic capacity is projected to raise the U.S.'s share of global fab capacity from 10% to 14%, with an estimated USD 646 billion in capital expenditures, taking 28% of global investment. The United States will also enhance its expertise in key technology sectors, such as advanced logic, DRAM memory, and analog.
The growth of advanced logic capacity will increase from 0% in 2022 to 28% by 2032.The IPS displays market is experiencing strong growth due to a rising need for top-quality visuals in consumer electronics, gaming, and professional fields. The increasing popularity of IPS displays is fueled by their better color accuracy, broader viewing angles, and improved contrast, making them perfect for tasks that demand accurate image replication. This increase in demand mirrors the swift growth observed in the silicon carbide (SiC) market, as the semiconductor sector is making significant investments in new components and manufacturing plants in order to satisfy increasing requirements. The rapid expansion is seen in the establishment of extensive SiC production plants to increase output and meet rising demand in power electronics and automotive technology. Efforts in the IPS displays market to improve production capabilities and meet increasing global demand are mirrored by the establishment of advanced manufacturing infrastructure, including the world's biggest SiC fabrication facility capable of producing up to 1 Billion 200mm SiC wafers per year. Both sectors benefit from substantial investments in manufacturing technology and facilities, reflecting a larger pattern in the semiconductor sector towards vertical integration and increasing production capacity to maintain a strong market position. As the IPS displays market grows, the SiC industry examples show the significance of making strategic investments in manufacturing capabilities to sustain growth and fulfill the changing needs of high-demand sectors.
Market Dynamics
Drivers
- The growth in IPS displays market is fueled by the expansion of OLED production facilities.
The growth of OLED production facilities, like the newly revealed 8.6G IT OLED production line, has a significant impact on the IPS displays market, showing a larger movement towards advanced displays technologies in the electronics sector. This newly designed production line creates both hybrid OLED and flexible OLED displays, demonstrating the rising need for high-performance displays panels linked to the growth in the IPS displays market. As manufacturers strive to innovate and invest in advanced production capabilities, the demand for displays with high color accuracy, broad viewing angles, and reliable performance crucial features of IPS technology grows increasingly important. This change can be seen in the development of advanced production lines that can process 32,000 8G glass substrates monthly, with equipment orders currently supporting a capacity of 16,000 substrates monthly. Investing in equipment like polyimide (PI) curing systems, crucial for making flexible OLEDs, demonstrates a strong dedication to expanding production to keep up with rising worldwide demand. With the advancement of displays technologies in the industry, the IPS displays market is being positively impacted, meeting the demand for various consumer electronics like smartphones, tablets, and monitors. The correlation between the increase in OLED manufacturing capacities and the growing need for IPS screens illustrates a larger market trend where progress in one displays technology supports the acceptance and development of another. These advancements make sure that IPS displays continue to be crucial in the worldwide displays market, despite the ongoing progress and growing market presence of OLED and hybrid OLED technologies.
- Incorporation of Biometric Security at Border Control Drives Expansion in IPS Displays Market
Biometric security systems, like the ones used by the U.S. Department of Homeland Security, are fueling substantial expansion in the IPS displays market. The 2002 Enhanced Border Security and Visa Entry Reform Act states that U.S. visas must now include biometric data such as fingerprints and facial recognition, gathered at U.S. Embassies and Consulates. These biometric systems depend greatly on high-quality screens for precise data collection and verification. IPS screens are becoming the top choice because of their excellent color accuracy, wide viewing angles, and dependable performance in different lighting situations. The scale of biometric operations is emphasized by the DHS's Automated Biometric Identification System (IDENT), which houses around 300 Billion distinct identities and handles more than 400,000 biometric transactions every day. With the increasing demand for secure and efficient biometric systems, there is also a need for advanced displays technologies to support these operations. IPS screens are more and more necessary in places like U.S. ports-of-entry and visa application processes for their ability to offer reliable and clear visual output, especially when accuracy in showing biometric data is crucial. The DHS's partnership with the DoD(Department of Defense) and DoJ (Department of Justice)increases the need for critical biometric information to support homeland security, defense, and justice objectives. The IPS displays market is predicted to capitalize on this trend, as governments globally embrace comparable biometric technologies, creating a demand for top-notch displays that can fulfill the strict criteria of national security and border control systems. This increase is especially significant in the semiconductor industry, as the advancement of newer image sensors and biometric systems is closely linked to the rising popularity of IPS displays, providing additional support.
Restraints
- Shortage of labor hinders growth in the IPS displays market.
The shortage of skilled workers in the semiconductor industry poses a major challenge for the growing In-Plane Switching (IPS) displays market, which relies on this sector for critical IPS panel production. With the rising need for high-performance screens in various industries like consumer electronics, automotive, and professional applications, the semiconductor sector, responsible for the necessary technology in IPS panels, is facing a significant shortage of skilled workers. The CHIPS and Science Act of 2022 intends to enhance domestic semiconductor manufacturing and research. However, the estimated growth of 115,000 semiconductor jobs by 2030 may not be realized, with around 67,000 positions, or 58% of the new jobs, at risk of remaining vacant due to a lack of qualified workers. This deficit encompasses vital roles like technicians and engineers, essential for progressing the technology and manufacturing processes of IPS panels. In trying to meet increased demand, the U.S. semiconductor industry faces obstacles in innovating and scaling production due to a shortage of skilled labor. The wider economic consequences of this shortage of skilled workers impact not only the semiconductor industry but also other rapidly growing technology fields like clean energy and AI. In order to alleviate these constraints, the sector needs to enhance its efforts in developing its workforce and work together with academic institutions to guarantee a consistent supply of skilled professionals. Meeting this challenge is essential for maintaining growth in the IPS displays industry, as developments in semiconductor technology have a direct impact on the quality and manufacturing capabilities of IPS panels.
- Effects of Decline in Semiconductor Dominance on IPS Display Market
The decrease in leadership in semiconductor design poses a major obstacle for the expansion of the In-Plane Switching (IPS) displays market. Semiconductors play a vital role in IPS panels by providing the necessary power for integrated circuits utilized in advanced display technologies. In the year 2021, the global semiconductor industry saw sales totaling USD 556 billion, with roughly 50% of the sector's research and development budget dedicated to semiconductor design. Historically, top semiconductor design companies in the United States held a strong market position, but their market share declined from more than 50% in 2015 to 46% in 2020, and it could decrease to 36% by the end of the 2020s. The main reason for this decrease is the rise in design capabilities in South Korea and China. The United States is currently experiencing a lack of skilled semiconductor designers, and it is expected that there will be a shortage of 23,000 designers by 2030. This deficiency puts at risk the progress of advanced technologies like IPS panels, which depend on state-of-the-art semiconductor design to enhance efficiency and lower expenses. Moreover, American semiconductor firms are facing difficulties such as tariffs, export limitations, and obstacles to entering new markets, which may impede their capacity to fund research and development. A proposal for public funding between USD 20 billion and USD 30 billion could address these obstacles and lead to USD 450 billion in design-driven sales, as well as sustain approximately 23,000 design positions. The United States may risk losing its advantage, which could hamper advancement and growth within the IPS displays Market.
Segment Analysis
By Type
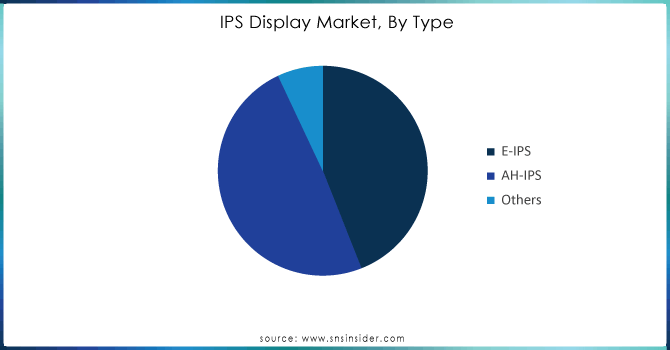
Based on Type, AH-IPS is capturing the largest share revenue in IPS Displays Market with 49% of share in 2023, AH-IPS panels are well-known for their excellent color precision, broader viewing angles, and improved brightness when compared to standard IPS technologies, which is why they are the top choice for premium consumer electronics and professional use. The technology's excellent performance features are the reason for its dominant market share, meeting the increasing need for high-quality displays in different industries. Leading companies pushing the utilization of AH-IPS technology are LG Displays and Samsung Displays, two major players recognized for their creative advancements and wide range of products. For example, LG Displays incorporates AH-IPS panels into their premium smartphones, monitors, and TV displays, taking advantage of their excellent color reproduction and wide viewing angles. Samsung Displays, another key competitor, incorporates AH-IPS technology in its high-end monitors and mobile devices, offering users top-notch visual experiences. Furthermore, AU Optronics and BOE Technology Group play a significant role in the AH-IPS market by utilizing their advanced production capabilities to satisfy the increasing need for high-performance screens. AU Optronics utilizes AH-IPS technology in various consumer electronics and industrial uses, whereas BOE Technology Group provides AH-IPS panels for smartphones and tablets, along with other products.
Get Customized Report as per your Business Requirement - Request For Customized Report
By Application
Based on Application, Smartphone is capturing the largest share in IPS Displays Market with 37% of share in 2023. This supremacy is credited to the increasing need for top-notch, high-resolution screens that improve user satisfaction on mobile gadgets. IPS technology is highly appreciated in smartphones for its exceptional color accuracy, broad viewing angles, and consistent performance, all of which are essential for creating an immersive visual experience. Big names in the smartphone industry such as Apple, Samsung, and Xiaomi have played a major role in driving this trend. The iPhone series from Apple uses IPS technology in its Retina displays to enhance the user experience by delivering vivid colors and crisp text. Samsung incorporates innovative IPS panels in its Galaxy series to provide vibrant and sharp displays that enhance the phone's popularity in the market. Xiaomi, famous for its affordable prices and top-notch features, uses IPS screens in its Mi and Redmi lineups to appeal to a wide range of customers. The continuous advancements in smartphone aesthetics, such as bigger screens and enhanced displays quality, continue to drive the need for advanced IPS panels. Moreover, the increase in smartphone usage worldwide, particularly in developing countries where there is a strong demand for cost-effective and high-quality devices, contributes to the expansion of the IPS displays market.
Regional Analysis
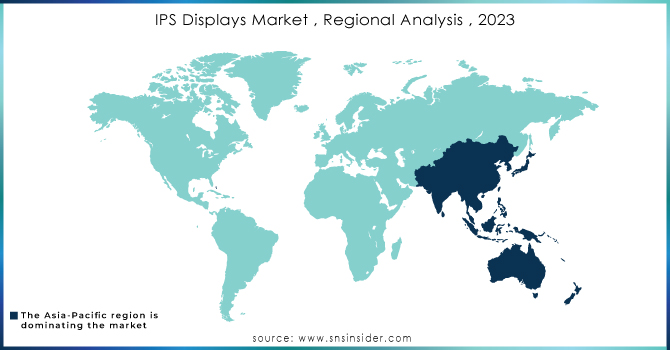
Asia Pacific is the largest dominating region IPS Displays Market with 36% of share in 2023. The region's strong dominance is largely due to the significant presence of major displays panel manufacturers like LG Displays, Samsung Displays, BOE Technology Group, and AU Optronics, which are based in key countries such as China, South Korea, and Taiwan. Asia Pacific has become a key hub for IPS panel production due to the presence of companies with advanced production facilities and supply chains. The region's importance in the global electronics industry is also emphasized by its significant production of consumer electronics such as smartphones, laptops, TVs, and digital signs, all of which depend heavily on IPS technology for their excellent displays features. For example, LG Displays and Samsung Displays, based in South Korea, are well-known for their advanced IPS panel technologies, serving top OEMs and pushing advancements in displays quality. Likewise, BOE Technology Group in China and AU Optronics in Taiwan play a major role in providing IPS panels for a variety of consumer electronics. The fast-paced economic development in areas such as China and India has contributed to a growing need for IPS displays, thanks to rising incomes and a flourishing electronics retail industry. The increasing path highlights the important position of Asia Pacific in the IPS displays market, as it keeps offering high-tech displays solutions to a variety of electronic devices. Asia Pacific's dominant position in the global IPS displays market is strengthened by its strong manufacturing capabilities and increasing consumer demand.
North America and Europe is second largest region having significant growth with 24 % and 19% of share in 2023. This increase highlights their important position in the worldwide displays sector, propelled by the integration of advanced technology, strong consumer purchasing ability, and a robust industrial structure. Leading technology companies like Apple and Dell Technologies are boosting the demand for IPS displayss in North America. Apple incorporates IPS panels into its high-end product ranges, such as the iPhone and iPad, which prioritize excellent color precision and extensive viewing angles. Dell Technologies, a leading figure in the computer hardware sector, incorporates IPS technology in its top-tier monitors and laptops to meet the needs of professionals and gamers seeking accurate and reliable displays performance. In Europe, companies such as Philips and Lenovo are crucial in leading the IPS displays market. Philips utilizes IPS technology in its monitors and televisions to provide vivid colors and great viewing angles, catering to the demands of consumers and business professionals with its innovative product range. Lenovo, recognized for its wide range of laptops and desktop monitors, integrates IPS screens to elevate user experience by enhancing visual clarity and offering broad viewing angles. Moreover, the rising importance of high-definition screens in consumer gadgets, paired with the expansion of the automotive and industrial industries, drives demand even more in those areas. The combination of cutting-edge technology, increased spending power, and a strong emphasis on quality and innovation guarantees that North America and Europe continue to play crucial roles in the IPS displays market, making significant contributions to its growth and development.
KEY PLAYERS:
The key players in the IPS Display market are AU Optronics, WINSTAR Display, Sony Corporation, Lenovo Group Limited, AsusTek Computer Inc., Dell, Acer Inc., Samsung Electronics, Japan Display, Panasonic Corporation, LG Display & Other Players.
Recent Development
-
The first Samsung Onyx screen was unveiled in Australia at the HOYTS Entertainment Quarter in Moore Park, Sydney. Samsung's latest 14-meter Onyx Cinema LED screen is featured in the next installment.
-
LG Displays has unveiled its latest displays and technologies at CES 2020 in Las Vegas. A 65-inch Ultra HD (UHD) Bendable OLED panel and a 55-inch Full HD (FHD) Transparent OLED displays will be unveiled by the business.
| Report Attributes | Details |
|---|---|
| Market Size in 2023 | USD 65.03 Billion |
| Market Size by 2032 | USD 120.56 Billion |
| CAGR | CAGR of 7.1% From 2024 to 2032 |
| Base Year | 2023 |
| Forecast Period | 2024-2032 |
| Historical Data | 2020-2022 |
| Report Scope & Coverage | Market Size, Segments Analysis, Competitive Landscape, Regional Analysis, DROC & SWOT Analysis, Forecast Outlook |
| Key Segments | • By Type (E-IPS, AH-IPS, Others) • By Application (Smartphones, Tablets, Pcs, TVs, Others) |
| Regional Analysis/Coverage | North America (USA, Canada, Mexico), Europe (Germany, UK, France, Italy, Spain, Netherlands, Rest of Europe), Asia-Pacific (Japan, South Korea, China, India, Australia, Rest of Asia-Pacific), The Middle East & Africa (Israel, UAE, South Africa, Rest of Middle East & Africa), Latin America (Brazil, Argentina, Rest of Latin America) |
| Company Profiles | AU Optronics, WINSTAR Display, Sony Corporation, Lenovo Group Limited, AsusTek Computer Inc., Dell, Acer Inc., Samsung Electronics, Japan Display, Panasonic Corporation, and LG Display. |
| Key Drivers |
|
| RESTRAINTS |
|
Frequently Asked Questions
Manufacturers, Consultants, Association, Research Institutes, private and university libraries, suppliers, and distributors of the product.
Yes, and they are Raw material vendors, Distributors/traders/wholesalers/suppliers, Regulatory authorities, including government agencies and NGO, Commercial research & development (R&D) institutions, Importers and exporters, Government organizations, research organizations, and consulting firms, Trade/Industrial associations, End-use industries.
Asian pacific region is expected to dominate the IPS Displays Market.
The market has been segmented with respect to type and application.
Get in Touch
