Light Field Market Report Scope & Overview:
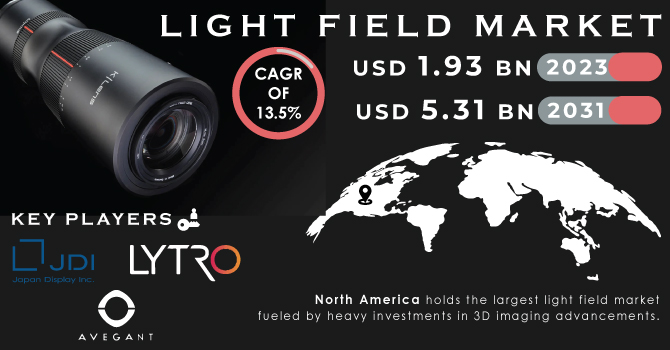
The Light Field Market Size was valued at USD 1.44 Billion in 2023 and is expected to reach USD 4.92 Billion by 2032 and grow at a CAGR of 14.62% over the forecast period 2024-2032.
To get more information on Light Field Market - Request Sample Report
The light field market is experiencing significant growth, driven by the increasing demand for immersive AR/VR experiences, enhanced 3D imaging, and high-quality visual displays. As industries like healthcare, entertainment, and automotive seek more realistic and interactive digital environments, light field technology is becoming a key enabler of this transformation. Light field displays provide enhanced depth, realism, and interactivity, offering a superior viewing experience compared to traditional 2D displays. In the gaming and entertainment sectors, the demand for lifelike 3D visuals is propelling the adoption of light field technology for gaming consoles, VR headsets, and immersive experiences. Additionally, the rise in applications such as virtual surgery, medical imaging, and automotive design is expanding the use of light field cameras and displays, driving further market growth. Major technology companies, including Samsung, Sony, and LG Display, are investing in the development of next-generation light field technologies, with a focus on improving display resolution, brightness, and interactivity. As innovation continues to advance, the light field market is expected to see widespread adoption across multiple sectors, positioning it as a critical technology for the future of immersive media and digital experiences.
Market Dynamics
Drivers
-
Revolutionizing Imaging with the Growth of Light Field Technology in Photography and Beyond
The growing interest in advanced imaging and photography systems, particularly light field cameras, is significantly driving the market for light field technologies. Light field imaging provides unparalleled depth and focus adjustment capabilities, offering users the ability to capture and manipulate images in a way that traditional cameras cannot. This innovation is revolutionizing fields like photography, medical imaging, and microscopy by allowing for the capture of 3D images that can be refocused and adjusted after being taken. As more industries seek advanced imaging systems that offer enhanced visual experiences and detailed representation, light field technology has gained traction across sectors, including healthcare, entertainment, and scientific research. The applications of light field cameras in medical imaging, for example, are making surgeries more precise, while in the entertainment sector, they are contributing to more immersive VR/AR experiences. Additionally, the rise in demand for high-quality, multi-dimensional imaging in scientific research and commercial photography is pushing the adoption of light field technologies. With breakthroughs in computational photography and improved image quality through techniques such as deep learning-based enhancements, light field imaging is further elevating the standards of visual representation. Companies like Google, Stanford, and other leading research institutions continue to explore the potential of light field technology, with new innovations expected to revolutionize the way images are captured and processed. As these advancements continue, light field imaging is set to become a core component of next-generation imaging systems, making it a key driver for growth in the market.
Restraints
-
Challenges in Traditional Imaging Restraining Light Field Technology Adoption
The competition from traditional imaging technologies such as 3D photography, VR, and AR solutions presents a significant challenge for the adoption of light field technology. Established technologies have matured over the years, offering cost-effective alternatives that are widely available and easier to implement. For instance, VR and AR systems have become integral in sectors like entertainment, healthcare, and education, boasting proven effectiveness and lower costs compared to the newer, more complex light field solutions. As these traditional technologies continue to evolve, offering impressive realism and interactive experiences, light field cameras and systems are struggling to match their established popularity and market penetration. Additionally, traditional imaging technologies often require less computational power and simpler setups, making them more accessible to a broader range of industries. Despite the enhanced imaging capabilities offered by light field systems, such as the ability to manipulate focus and depth post-capture, the high costs and technical complexity associated with light field imaging make it a less attractive option for many industries. Furthermore, the lack of standardization and widespread content availability in the light field space also limits its ability to compete with traditional, mature technologies. As a result, the market for light field technology faces strong competition from established imaging systems, which may impede its widespread adoption and slow its growth in key sectors such as healthcare, entertainment, and photography.
Segment Analysis
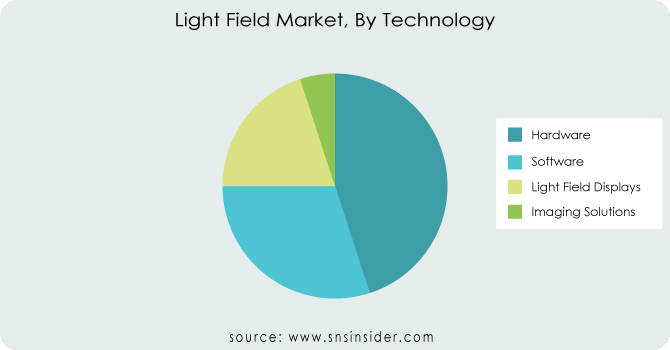
By Technology
In 2023, the hardware segment is the dominant force in the light field market, accounting for approximately 40% of the market share. This segment includes the development of light field cameras, lenses, and other imaging hardware crucial for capturing and processing multi-dimensional images. As the demand for high quality, 3D, and refocusable images grows across industries such as healthcare, entertainment, and scientific research, the role of specialized hardware has become increasingly vital. Advances in optical components, such as micro lenses and light field sensors, have enhanced the performance of these devices, contributing to their widespread adoption. Companies are focusing on improving hardware capabilities, enabling more accessible, accurate, and immersive imaging experiences. This growth in hardware development is expected to continue as innovations in computational photography further push the boundaries of light field technology.
By Vertical
In 2023, the media and entertainment segment leads the light field market, holding a share of around 35%. The adoption of light field technology in this sector is driven by the increasing demand for immersive experiences in virtual reality (VR), augmented reality (AR), and 3D content creation. Light field technology enhances the visual quality of media by enabling lifelike 3D imaging, precise depth perception, and dynamic focus adjustments, significantly improving user engagement. This technology is being increasingly used in filmmaking, gaming, and interactive media, offering realistic effects and immersive experiences. As the entertainment industry explores new frontiers in digital content, the ability to create hyper-realistic visuals with light field cameras is gaining traction. The growing popularity of VR/AR applications in entertainment further fuels market expansion in this vertical.
To Get Customized Report as per your Business Requirement - Request For Customized Report
Regional Analysis
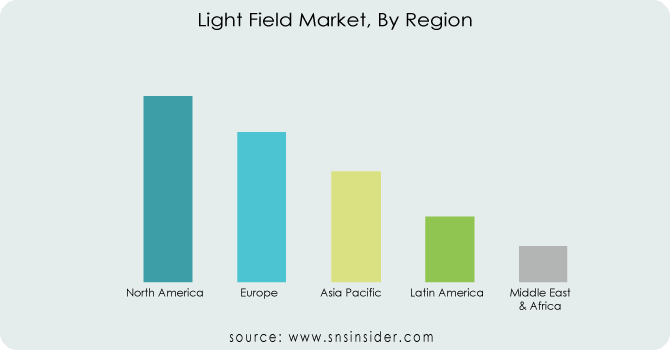
In 2023, North America holds the dominant share of approximately 40% in the light field market, fueled by its advanced technological infrastructure and significant investments in research and development. The region's leadership is supported by the presence of major tech giants such as Google, Microsoft, and Apple, who are pioneering advancements in light field imaging and photography technologies. The U.S. and Canada are particularly influential in driving innovation across various sectors like media and entertainment, healthcare, and scientific research. The demand for immersive experiences in virtual reality (VR) and augmented reality (AR), as well as the increasing adoption of light field cameras in professional photography, has accelerated market growth. strategic collaborations between academic institutions and technology companies further solidify North America's position as a key player in the light field market.
The Asia-Pacific region is the fastest-growing market for light field market from 2024 to 2032, driven by rapid advancements in technological infrastructure and increasing demand for immersive media experiences. Key countries like China, Japan, and South Korea are leading the charge, with China investing heavily in research and development, while Japan focuses on integrating light field imaging in sectors such as robotics, healthcare, and entertainment. South Korea is also expanding its presence, especially in the development of AR/VR applications and consumer electronics. The growing adoption of 5G technology is enhancing the region’s ability to deliver high quality, real-time light field experiences. Additionally, the expansion of the film, gaming, and healthcare industries in the region is fostering demand for innovative imaging technologies. With substantial government support and rapid technological advancements, Asia-Pacific is expected to maintain its position as the fastest-growing market for light field technology.
Key Players
Some of the major players in Light Field Market with product:
-
Raytrix GmbH (Light Field Cameras)
-
FoVI 3D, Inc. (3D Light Field Displays)
-
Google LLC (Light Field Technologies for AR/VR)
-
Avegant Corp. (Light Field Headsets)
-
Lumii Inc. (Light Field Technology for Displays)
-
Holografika (Light Field Displays for 3D Imaging)
-
OTOY Inc. (Light Field Rendering Software and Cloud Solutions)
-
Nvidia Corp (Graphics Processing Units for Light Field Rendering)
-
Panasonic Corporation (Light Field Cameras and Displays)
-
Leia (Light Field Displays for Consumer Devices)
-
Samsung Display. (Light Field Display Technology)
-
Light Field Lab, Inc. (Holographic Light Field Displays)
-
Ricoh Innovations Corporation (Light Field Cameras and Solutions)
-
TOSHIBA CORPORATION (Light Field Imaging Technology)
-
Sony Corporation (Light Field Cameras and Display Technology)
-
Apple Inc. (AR/VR Devices and Light Field Technologies)
-
Pelican Imaging Corporation (Light Field Cameras)
-
Lytro, Inc. (Light Field Cameras and Photography Technology)
-
Japan Display . (Light Field Displays)
-
LG Display Co., Ltd. (OLED and Light Field Display Technologies)’
List of Suppliers who supplies Raw Material and Component
-
Corning Incorporated
-
3M Company
-
DuPont
-
Sony Corporation
-
Samsung Electronics
-
Sharp Corporation
-
Nippon Electric Glass Co., Ltd.
-
Panasonic Corporation
-
LG Display Co., Ltd.
-
Qualcomm Incorporated
Recent Development
-
August 2024: Samsung Electronics unveiled its groundbreaking Odyssey 3D gaming monitor at Gamescom 2024, featuring glasses-free 3D viewing with Eye Tracking and View Mapping technology. This innovation marks a significant step forward in immersive gaming experiences.
-
May 2024: LG Display unveiled its next-generation OLED technologies at SID Display Week 2024, including the new OLEDoS for VR. This technology boasts a 1.3-inch display with ultra-high brightness of 10,000 nits, 4,000 ppi resolution, and 97% DCI-P3 color accuracy, offering lifelike virtual reality experiences.
| Report Attributes | Details |
|---|---|
| Market Size in 2023 | USD 1.44 Billion |
| Market Size by 2032 | USD 4.92 Billion |
| CAGR | CAGR of 14.62% From 2024 to 2032 |
| Base Year | 2023 |
| Forecast Period | 2024-2032 |
| Historical Data | 2020-2022 |
| Report Scope & Coverage | Market Size, Segments Analysis, Competitive Landscape, Regional Analysis, DROC & SWOT Analysis, Forecast Outlook |
| Key Segments | • By Technology (Hardware, Software, Light Field Displays, Imaging Solutions) • By Vertical (Media & Entertainment, Healthcare, Architecture, Industrial, Defense) |
| Regional Analysis/Coverage | North America (US, Canada, Mexico), Europe (Eastern Europe [Poland, Romania, Hungary, Turkey, Rest of Eastern Europe] Western Europe] Germany, France, UK, Italy, Spain, Netherlands, Switzerland, Austria, Rest of Western Europe]), Asia Pacific (China, India, Japan, South Korea, Vietnam, Singapore, Australia, Rest of Asia Pacific), Middle East & Africa (Middle East [UAE, Egypt, Saudi Arabia, Qatar, Rest of Middle East], Africa [Nigeria, South Africa, Rest of Africa], Latin America (Brazil, Argentina, Colombia, Rest of Latin America) |
| Company Profiles | Raytrix GmbH, FoVI 3D, Inc., Google LLC, Avegant Corp., Lumii Inc., Holografika, OTOY Inc., NVIDIA Corporation, Panasonic Corporation, Leia Inc., Samsung Display Co., Ltd., Light Field Lab, Inc., Ricoh Innovations Corporation, TOSHIBA CORPORATION, Sony Corporation, Apple Inc., Pelican Imaging Corporation, Lytro, Inc., Japan Display Inc., LG Display Co., Ltd. |
| Key Drivers | • Revolutionizing Imaging with the Growth of Light Field Technology in Photography and Beyond |
| Restraints | • Challenges in Traditional Imaging Restraining Light Field Technology Adoption |
Frequently Asked Questions
Ans: Hardware Segment is dominating in Light Field Market
Ans: North America is dominating in Light Field Market
Ans: The key driver in the Light Field Market will be the increasing demand for immersive AR/VR experiences and advanced 3D display technologies.
Ans: The market value is expected to reach USD 4.92 billion by 2032.
Ans: The Light Field Market size was valued at USD 1.44 billion in 2023 at a CAGR of 14.62%.
Get in Touch
