Neoteric Solvents Market Report Scope & Overview:
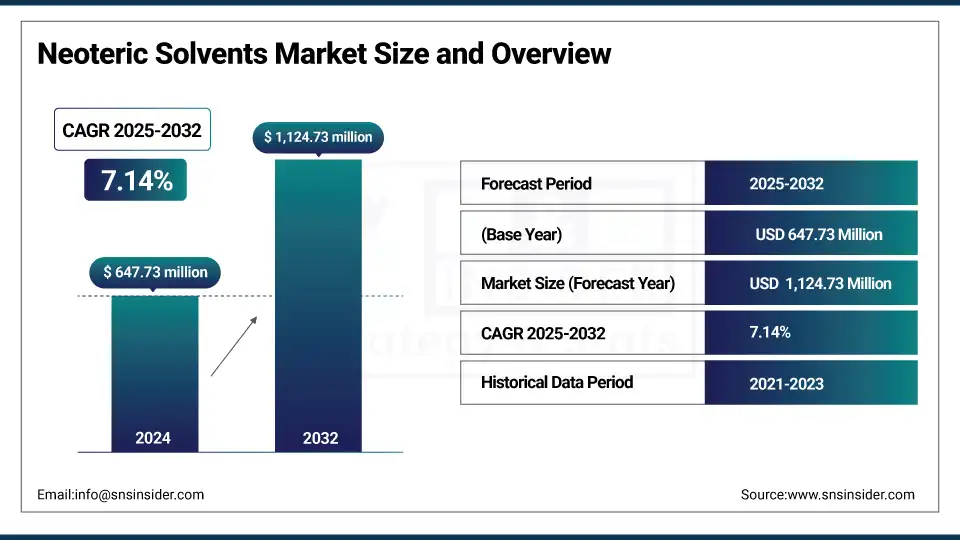
The Neoteric Solvents market size was valued at USD 647.73 million in 2024 and is expected to reach USD 1,124.73 million by 2032, growing at a CAGR of 7.14% over the forecast period of 2025-2032.
The neoteric solvents market is being driven by growing preference for bio-based solvents and green solvents market water based and silicon-based; thus, demand for regulations-compliant market products of solvent mixtures, across pharmaceuticals, chemical processing, and industrial air compressors market. Increased regulations on the environment and a shift towards bio-based solvents are driving the market of neoteric solvents, especially in the application of specialty solvents. The new generation of modern solvents market trends are DES and ionic liquids that are used for sustainable processing and as advanced lubricants.
To Get more information On Neoteric Solvents Market - Request Free Sample Report
The U.S. Department of Energy awarded funding to Western Michigan University on December 11, 2023, for enzyme/deep eutectic solvent-aided kraft pulping toward energy savings and yield enhancement. Oak Ridge National Laboratory research also demonstrated that ionic liquids extend the service life of HVAC compressors and helped to establish neoteric solvents above the rest in the industrial compressor market share. These developments are the result of a solid neoteric solvents market research and development, with neoteric solvents manufacturers in neoteric solvents companies offering eco-friendly options that call for compliance with changing industry regulations and environmental regulations.
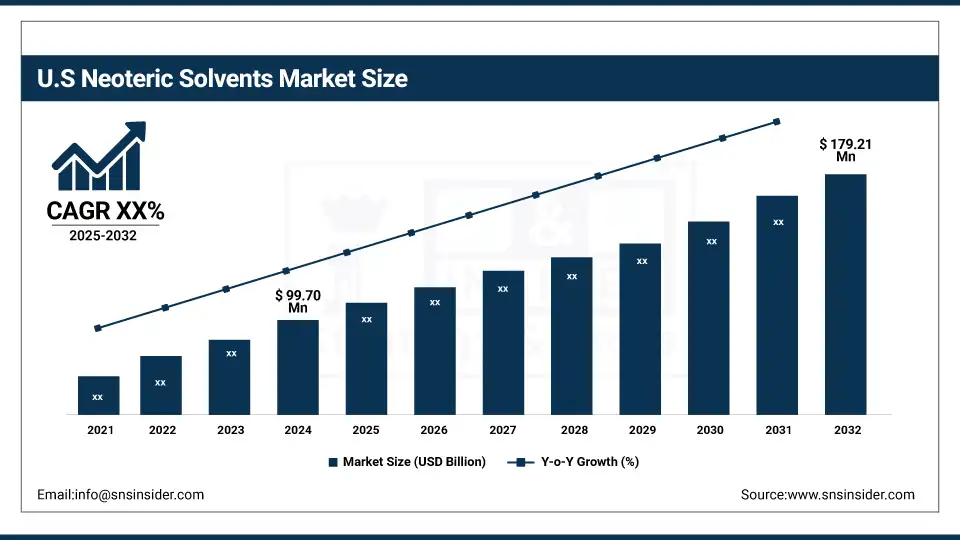
The U.S. dominates the North American neoteric solvents market with a market share of USD 99.70 million and is projected to reach a value of USD 179.21 million with a market share of about 66%. The dominance is due to federal grants and academic-industry partnerships advancing green solvent technologies. In 2023, the Department of Energy funded enzymatic pretreatment projects involving deep eutectic solvents at Western Michigan University. Oak Ridge National Laboratory is leading ionic liquid innovation for thermal systems in HVAC and energy storage. These national initiatives contribute to the country’s leadership in specialty solvents and reinforce its position in the broader neoteric solvents market.
Market Dynamics:
Drivers:
-
Increasing regulatory emphasis on reducing volatile organic compounds accelerates the neoteric solvents market growth
Environmental agencies such as the U.S. Environmental Protection Agency have implemented stringent regulations for volatile organic compound emissions, leading to increasing demand for the green solvents market and renewable solvents market substitutes. New generation solvent firms are also building up new low-VOC bio-based solvents to meet the new requirements. These developments are boosting the market share of neoteric solvents, especially in the pharmaceutical and industrial air compressors market, for which environmental compliance is paramount. This regulatory alignment ensures the continued expansion of the neoteric solvents market by promoting increased penetration of the specialty solvents in different applications.
-
Advancements in deep eutectic solvents and ionic liquids expand application scope in industrial compressors
Advancements in ionic liquids and deep eutectic solvents are accelerating the market trends, especially across the industrial compressors market. The 2023 U.S. Department of Energy grant to Western Michigan University to increase kraft pulping efficiency with enzyme-assisted solvents is another example of it. Ionic liquids were also shown by Oak Ridge National Laboratory to improve the longevity of HVAC equipment. These developments enhance the specialty solvents industry's efficiency in industrial processes, enhancing new solvents industry trends in terms of performance and sustainability.
Restraints:
-
Limited standardized regulatory frameworks for novel neoteric solvents hinder global market penetration
Diverse worldwide regulation of new solvents, such as ionic liquids and bio-based agents, further hampers international uptake. Though EPA and REACH provide frameworks, regional disparity escalates compliance onerousness. Such divergences slow down commercialisation and add to the cost burden for nascent solvent companies, according to the U.S. Chemical Safety Board. This worsens the neoteric solvents market outlook and limits the neoteric solvents market opportunities in the global industries. A harmonised approach is required to facilitate market access of specialty solvents and to promote global use of renewable solvents.
Segmentation Analysis:
By Solvent Type
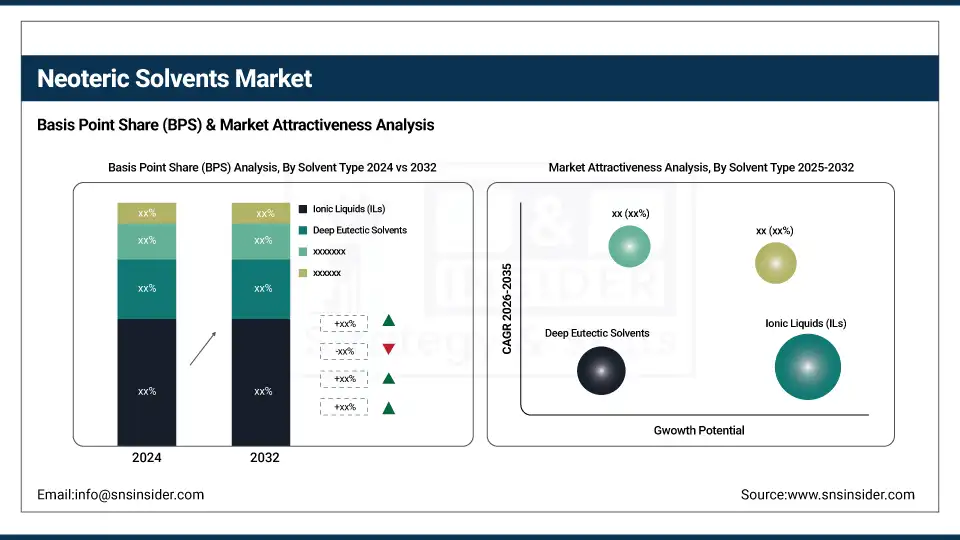
Ionic liquids led the neoteric solvents market in 2024 with a 34.8% market share, mainly due to their low vapor pressure, excellent thermostability, and high versatility. Ionic liquids based on imidazolium compounds predominate in the field of pharmaceutical and chemical products. Research sponsored by the U.S. Department of Energy is served in part by ionic liquids as environmentally friendly substitutes, which further drives the green solvents market. These low-emission solvents offer enhanced process safety, fueling their uptake in specialty solvents and industrial compressor applications.
Bio-based solvents are the fastest-growing segment, exhibiting a 7.71% CAGR due to high demand for green solvents in line with the sustainability objectives. Ethyl lactate, along with other bio-based solvents, is leading this section, considering they are biodegradable and less toxic. The bio-based solvents are promoted under the US Environmental Protection Agency Safer Choice program to increase their usage to progress toward safer and greener chemical processing. This expansion is driven by strong trends in the green solvents market and specialty solvents applications in pharmaceuticals and industrial air compressors.
By Application
Pharmaceuticals and life sciences dominated with a 33.5% market share in 2024, owing to their application in drug formulation and excipients. High drug solubility and bioavailability using ionic liquids and deep eutectic solvents. The FDA Emerging Technology Plan encourages solvent innovations for process safety and waste minimization. These progresses are important contributions to the neoteric solvents market growth and increase the relevance of the specialty solvents market for sustainable pharmaceutical production.
Energy and electronics are the fastest growing segment, with a 7.87% CAGR, driven by ionic liquids and deep eutectic solvents in battery electrolytes and thermal management fluids. The Energy Department is funding research into ionic liquids, enhancing lithium-ion batteries, and cooling systems. Because of their high stability and performance, they can be well accepted in the E-vehicle and semiconductor industry. This development is the result of the broader usage of specialty solvents in the sustainable energy and industrial compressors industries.
Regional Analysis:
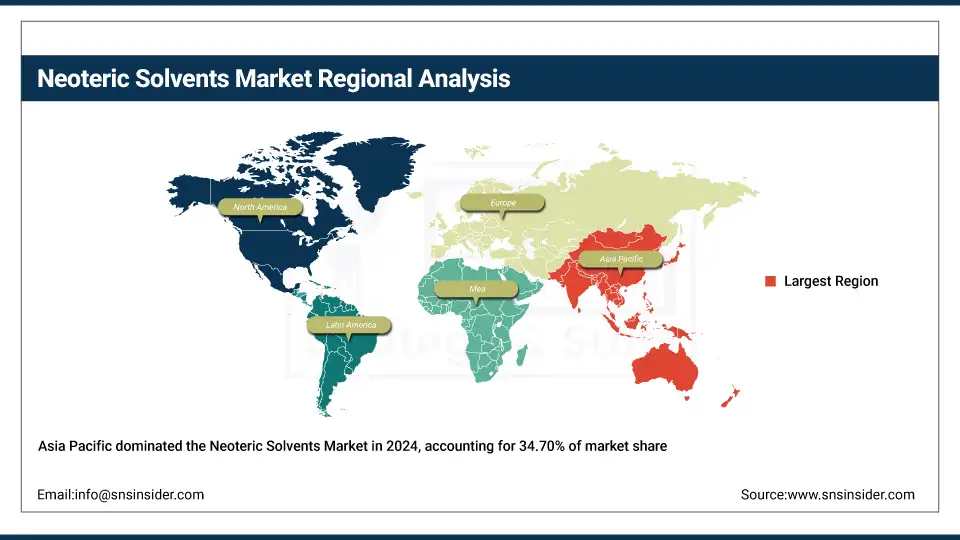
Asia Pacific dominated the neoteric solvents market in 2024 with a 34.70% market share due to large-scale manufacturing and rising investments in green chemistry. Government programs in China, India, and Japan are accelerating demand for bio-based and specialty solvents. China dominates the region, supported by initiatives from the Ministry of Industry and Information Technology and efforts by Sinochem and Sinopec to adopt renewable solvents. This growth is reinforced by the region’s booming pharmaceutical and electronics sectors and expanding industrial compressors market.
Get Customized Report as per Your Business Requirement - Enquiry Now
North America is the fastest-growing region in the neoteric solvents market with the highest CAGR of 8.78% during the forecast period of 2025 to 2032, driven by robust governmental initiatives to replace hazardous solvents with low-emission alternatives. The U.S. Environmental Protection Agency’s Safer Choice program promotes renewable solvents in both industrial and consumer products. Moreover, the U.S. Department of Energy funds research into ionic liquids and bio-based solvents, supporting adoption across energy, pharmaceutical, and industrial compressors markets, fueling strong neoteric solvents market growth.
Europe held a 28.80% share in the neoteric solvents market in 2024, supported by REACH regulations and strong demand for renewable solvents. The European Union’s Green Deal continues to boost bio-based solvent use across pharmaceuticals and specialty chemical sectors. Germany dominates the region with innovations led by BASF and support from the Federal Environment Agency to reduce hazardous substances. With a highly regulated environment and a growing specialty solvents market, Europe remains a global leader in sustainable industrial transformation and neoteric solvents market trends.
LAMEA is an emerging region in the neoteric solvents market, with growth projected from 2025 to 2032, driven by increasing demand for renewable solvents in agriculture, pharmaceuticals, and industrial applications. Brazil leads in Latin America with bioeconomy programs supported by the Ministry of Science, Technology, and Innovation and Embrapa’s initiatives in agrochemical solvents. In the Middle East and Africa, Saudi Arabia dominates through Vision 2030 and R&D efforts by KACST. Regional policies promoting low-VOC technologies and green chemistry support specialty solvents market expansion and position Lamea as a promising contributor to global neoteric solvents market growth.
Key Players:
The major neoteric solvents market competitors include IoLiTec Ionic Liquids Technologies GmbH, Solvionic SA, Proionic GmbH, Scionix Ltd, Zhangjiagang Fortune Chemical Co., Ltd., Thermo Scientific (Alfa Aesar), Tokyo Chemical Industry Co., Ltd. (TCI), Shanghai Chengjie Chemical Co., Ltd., Hangzhou Ocean Chemical Co., Ltd., and Kailida Chemical Co., Ltd.
Recent Developments:
-
In January 2025, IoLiTec published the safety data sheet for magnesium tetrakis (hexafluoroisopropyloxy) borate (KI‑0072), marking its commercial launch as a key ionic liquid intermediate for advanced electrolytes and sensor applications
-
In April 2024, Arkema signed an agreement on April 17, 2024, to acquire a majority stake of nearly 78% in Proionic GmbH, a specialist in non‑flammable ionic liquids for next‑generation lithium‑ion batteries, bolstering its green solvents market offerings
| Report Attributes | Details |
|---|---|
| Market Size in 2024 | USD 647.73 million |
| Market Size by 2032 | USD 1,124.73 million |
| CAGR | CAGR of 7.14% From 2025 to 2032 |
| Base Year | 2024 |
| Forecast Period | 2025-2032 |
| Historical Data | 2021-2023 |
| Report Scope & Coverage | Market Size, Segments Analysis, Competitive Landscape, Regional Analysis, DROC & SWOT Analysis, Forecast Outlook |
| Key Segments | •By Solvent Type (Ionic Liquids (ILs), Deep Eutectic Solvents, Supercritical Fluids, Bio-based Solvents, and Others) •By Application (Pharmaceuticals & Life Sciences, Chemical & Industrial Processing, Energy & Electronics, Agriculture, and Others) |
| Regional Analysis/Coverage | North America (US, Canada, Mexico), Europe (Germany, France, UK, Italy, Spain, Poland, Turkey, Rest of Europe), Asia Pacific (China, India, Japan, South Korea, Singapore, Australia, Rest of Asia Pacific), Middle East & Africa (UAE, Saudi Arabia, Qatar, South Africa, Rest of Middle East & Africa), Latin America (Brazil, Argentina, Rest of Latin America) |
| Company Profiles | IoLiTec Ionic Liquids Technologies GmbH, Solvionic SA, Proionic GmbH, Scionix Ltd, Zhangjiagang Fortune Chemical Co., Ltd., Thermo Scientific (Alfa Aesar), Tokyo Chemical Industry Co., Ltd. (TCI), Shanghai Chengjie Chemical Co., Ltd., Hangzhou Ocean Chemical Co., Ltd., and Kailida Chemical Co., Ltd. |
Frequently Asked Questions
Lack of uniform global regulations limits the commercialization of bio-based and ionic liquids across international neoteric solvents markets.
Strict VOC regulations by agencies like the EPA and REACH drive demand for renewable and green specialty solvents.
Asia Pacific dominates the neoteric solvents market, while North America is the fastest-growing with robust governmental support.
Key neoteric solvents companies include IoLiTec, Proionic GmbH, Solvionic SA, TCI, Scionix, and Thermo Scientific.
The neoteric solvents market was valued at USD 647.73 million in 2024 with a CAGR of 7.14% through 2032.
Get in Touch
