Optical Coating Equipment Market Report Scope & Overview:
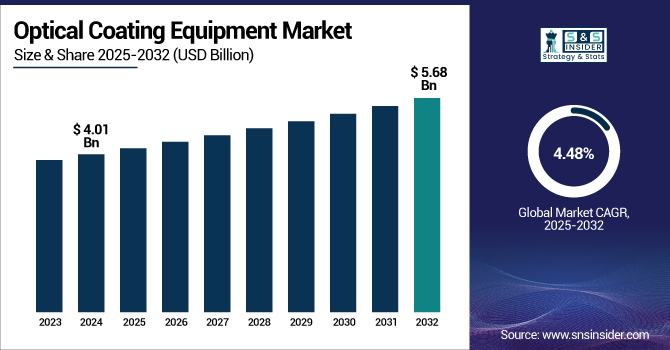
The Optical Coating Equipment Market size was estimated at USD 4.01 billion in 2024 and is expected to reach USD 5.68 billion by 2032, with a growing CAGR of 4.48% over the forecast period 2025-2032.
To Get more information on Optical Coating Equipment Market - Request Free Sample Report
The optical coating equipment market growth is driven by augmented demand for high-performing optical components across various industries. Many advanced optics integrated sectors, including telecommunications, consumer electronics, aerospace & automotive, are used for improving functionality & efficiency. New deposition methods, for example, ion beam sputtering and plasma‐enhanced chemical vapor deposition, are emerging for sophisticated yet stable coatings. These advancements are extremely relevant in applications requiring high precision and reliability, such as in 5G networks, autonomous driving, as well as renewable energy systems.
This new generation of optical coatings offers many opportunities with the large, growing market for touchless sensing and the transition into new applications. A greater number of Internet of Things (IoT) devices and connected solutions require more effective optical components. Increasing application of advanced driver-assistance systems (ADAS) and LiDAR systems is driving the adoption of optical coatings in the automotive sector.
In 2023, Apollo Optical Coating Systems has adopted the Satisloh 1200-DLX-2 coater, enhancing precision and productivity in its optical coating processes. The system reduces cycle times and increases capacity, while its eco-friendly design supports the company’s focus on high-quality, sustainable solutions.
Optical Coating Equipment Market Dynamics
Drivers
-
Surge in Consumer Electronics Drives Growing Demand for Advanced Optical Coatings in Smartphones, Wearables, and Displays
The growing deployment of consumer electronics, such as smartphones, tablets, wearables, and large-format displays, has greatly increased the need for high-end optical coatings. Such coatings play a very vital role as they help in screen visibility, offer anti-glare property, and are scratch-resistant, thereby providing a good user experience and longer life of the device.
For instance, there were 1.17 billion smartphones shipped worldwide in 2023, and many premium mobile devices feature optical coatings for anti-reflection on displays and lenses, which indicates significant coating equipment demand.
This demand requires optical coating equipment with advanced capabilities to satisfy high volume and high quality. For miniaturized and complex components, plasma-enhanced chemical vapor deposition (PECVD), ion beam sputtering, and many other technologies are increasingly used to produce high-performance coatings.
-
Rise of 5G Networks and High-Speed Internet To Boost Demand for Optical Coating Equipment
Telecommunications (especially with 5G developers) boosts the demand for optical coating equipment. Specific coatings used in optical components, such as fiber optics, sensors, and antennas (FOSAs) driven by fifth-generation (5G) infrastructure, can enhance performance and lifetime. They are most commonly used in optical coatings that are essential to reduce signal loss and increase efficiency by maximizing signal transmission. Thus, the demand for effective & high-performance components will be higher with the expansion of high-speed internet services. In addition, 5G has ultra-low delay and high bandwidth, which promotes the industry to reduce the delay, reliability, and efficiency of optical systems through more advanced technologies.
Restraint
-
Raw Material Price Volatility To Hamper the Market Growth
The optical coatings industry gets affected significantly because of volatility in the raw material prices. Prices for key materials such as metals (e.g., aluminum, silver) and oxides (e.g., titanium dioxide) fluctuate due to elements like supply chain disruptions, geopolitical tensions, and shifts in global demand. Such price volatility can result in their manufacturing and cost of goods becoming somewhat erratic, making it difficult for manufacturers to set profit margins and price correctly. Increasing in prices raw material could result in higher production cost for manufacturers, resulting in higher prices for optical coatings, which could adversely influence demand or squeezing manufacturers profitability.
For instance, the price of indium has increased by 42.86% since early 2021, while aluminum prices surged by 34% in 2022 due to energy shortages in Europe. These fluctuations affect manufacturing costs, leading to decreased profitability for manufacturers and increased market prices for optical coatings.
-
Impact of Stringent Environmental Regulations on Coating Material Selection and Manufacturing Costs
Manufacturers, in particular, are affected by stringent environmental regulations regarding the usage of coating materials that comprise hazardous substances. While these regulations exist to minimize environmental harm and protect the general public, they also impose stringent standards and policies intended for manufacturers. That means companies will have to use safer, sustainable materials and eco-friendly processes that may entail more expensive production costs. More than that, the available materials are often restricted to those that pass the regulations, and they could be only a small subset of what the manufacturers would like to use. This not only restricts the production flexibility but also complicates the procurement and application of compliant materials, thereby hampering the cost-effectiveness and efficiency of the manufacturing process.
Optical Coating Equipment Market Segmentation Analysis
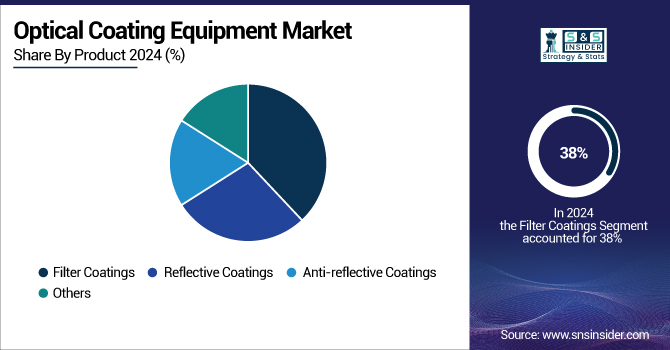
By Product
The filter coatings segment dominated with over 38% optical coating equipment market share in 2024. These coatings allow certain wavelengths of light to pass while blocking others from reproducing colors accurately and improving optical performance. Filter coatings are used in medical devices such as microscopes and endoscopes that require accurate light filtration to enable clear imaging processes and accurate diagnosis methods. Likewise, within imaging systems, the functionality of good images is achieved by eliminating stray light.
Reflective coatings are experiencing rapid growth in the optical coating equipment market due to their increasing demand in a variety of applications. These coatings play an essential role in increasing the transmission efficiency of optical systems and are suitable for application in solar panels, automotive mirrors, and optical devices. Reflective coatings are becoming increasingly important across industries such as renewable energy and electronics, driven by the rising demand for energy-efficient solutions.
For Instance, the anti-reflective coatings on solar modules significantly improve their performance in desert environments. The coatings enhanced light absorption, leading to a 5.5% increase in energy yield. Additionally, they reduced the levelized cost of energy (LCOE) by 2.7%, showcasing the potential for reflective coatings to make solar energy more cost-effective.
By Technology
In 2024, ion beam sputtering emerged as the dominant technology in the optical coating equipment market, capturing approximately 36% of the total market share. The ability to produce high-precision coatings with excellent film density, uniformity, and adhesion is a major contributor to this leadership. This technology is a popular choice in most high-end optical coatings, including laser optics, precision lenses, and filters, where performance and reliability are paramount. The ability to precisely control the deposition process at an atomic level result in the best coating properties, making it the gold standard for the aerospace, defense, and medical optics industries.
The fastest growing segment in the optical coating equipment market is advanced plasma reactive sputtering. Because of its capability of delivering good quality and long-lasting coatings with superior optical performance, this technology is gaining acceptance rapidly. Increase in demand for energy-efficient coatings, precise optical filters, and high-performance photonic devices is are major factor driving the growth of the market.
By End-Use
The electronics segment dominated the optical coating equipment market in 2024, capturing the largest share at 32%. This leadership can largely be credited to the use of optical coatings in a diverse set of electronic products. These coatings improve the performance, durability, and efficiency of components, including display panels, image sensors, camera lenses, and optical instruments. As consumers desire high-resolution displays, the introduction of advanced smartphones and the growing demand for miniaturised electronic devices drive mass manufacturing and the adoption of precision coating technologies.
The telecommunications segment is the fastest-growing end use in the optical coating equipment market, driven by the increasing demand for high-performance coatings in fiber optics and photonics. Worldwide developments of networks impact on requirements for optical components, especially in the process of construction of 5G technology. Optical coatings are an important part of modern telecom infrastructure because they increase the efficiency and durability of signal transmission in a communication system.
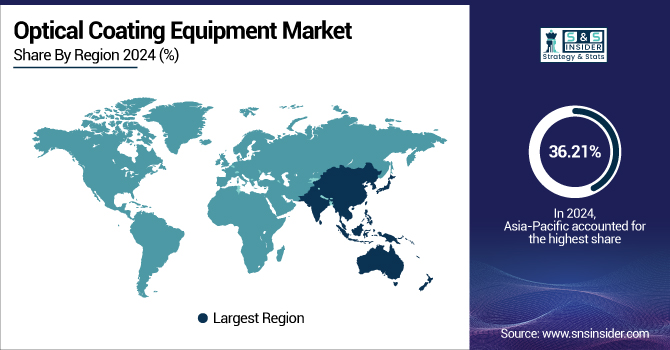
Optical Coating Equipment Market Regional Outlook
Asia-Pacific accounted for 36.21% of the optical coating equipment market in 2024, making it the dominant and fastest-growing region. A growing demand for consumer electronics, telecommunications, and healthcare industries, particularly in China, Japan, and South Korea, is driving its rapid expansion. Owing to high demand from anti-reflection coatings (ARC) for smartphones, medical devices, and solar panels, this region is witnessing growth.
India is projected to experience the fastest growth in the Asia-Pacific optical coating equipment market, with an estimated CAGR of 6.2%. Such expansion is powered by India's expanding electronics and semiconductor sectors, which are vital for the nation's manufacturing and technology capabilities. Further driving this growth, the "Make in India" initiative by the government, is spurring growth in the domestic market by increasing the local manufacturability of optical components for consumer electronics, automotive, and aerospace applications.
Europe is the second-largest region in the optical coating equipment market, driven by innovation in automotive, aerospace, and medical technology. Germany and France are leading the way in terms of adoption, with an emphasis on high-precision optics for advanced driver-assistance systems (ADAS) and high-precision minimally invasive medical tools. Sustained growth is driven by the demand for energy-efficient and high-performance optical components.
North America holds a significant share of the optical coating equipment market, supported by its strong defense, aerospace, and consumer electronics industries. In particular, the demand for optical coatings by the night vision device, high-resolution on-board display, and laser systems in the U. S. is increasing. Major investments in advanced coating technologies continue at both research institutions and private companies, including the use of unique PVD techniques and advanced nano-coating technologies. Expansion of fiber optics and telecom infrastructure also drives growth.
In 2024, the U.S. optical coating equipment market was valued at USD 0.87 billion, with a projected growth to USD 1.23 billion by 2032, reflecting a CAGR of 4.41%. The growing requirement in electronics, automotive, and aerospace industries for high-performance optical coatings is boosting the market expansion. Due to technological development and increasing applications in various industries, the U.S. market is expected to witness moderate growth.
Mexico's optical coating equipment market is expected to hit USD 0.13 billion by 2032, with a CAGR of 4.38% over the forecast period. This growth is driven by the country's growing manufacturing and electronics sector, especially in the automotive and renewable energy market. The growing demand for high-quality coatings coupled with industrial development and technology improvements will further serve to boost the market.
Get Customized Report as per Your Business Requirement - Enquiry Now
Optical Coating Equipment Companies are:
Coburn Technologies, Inc., Inrad Optics, Dynavac, Newport Corporation, Dongguan Huicheng Vacuum Technology Co., Ltd., Optimax Systems, Inc., Evatec AG, OptoTech Optikmaschinen GmbH, Alluxa Inc., andMustang Vacuum Systems.
Recent Development
-
In January 2025: Coburn Technologies, in partnership with SDC Technologies, introduced the Velocity TT. This compact, tabletop optical lens spin coater is specifically designed for small to medium-sized lens processing labs and delivers high-quality anti-abrasion coatings within a space-efficient design.
-
In March 2025: OptoTech unveiled the IQ-Synergy Taper, a cutting-edge lens protection machine that represents a breakthrough in lens processing technology.
| Report Attributes | Details |
|---|---|
| Market Size in 2024 | USD 4.01 Billion |
| Market Size by 2032 | USD 5.68 Billion |
| CAGR | CAGR of 4.47% From 2025 to 2032 |
| Base Year | 2024 |
| Forecast Period | 2025-2032 |
| Historical Data | 2021-2023 |
| Report Scope & Coverage | Market Size, Segments Analysis, Competitive Landscape, Regional Analysis, DROC & SWOT Analysis, Forecast Outlook |
| Key Segments | • By Product (Filter Coatings, Reflective Coatings, Anti-reflective Coatings, Others) • By Technology (Ion Beam Sputtering, Evaporation Deposition, Vacuum Deposition, Advanced Plasma Reactive Sputtering) • By End Use (Automotive, Telecommunications, Electronics, Solar, Others) |
| Regional Analysis/Coverage | North America (US, Canada, Mexico), Europe (Germany, France, UK, Italy, Spain, Poland, Turkey, Rest of Europe), Asia Pacific (China, India, Japan, South Korea, Singapore, Australia, Rest of Asia Pacific), Middle East & Africa (UAE, Saudi Arabia, Qatar, South Africa, Rest of Middle East & Africa), Latin America (Brazil, Argentina, Rest of Latin America) |
| Company Profiles | Coburn Technologies, Inc., Inrad Optics, Dynavac, Newport Corporation, Dongguan Huicheng Vacuum Technology Co., Ltd., Optimax Systems, Inc, Evatec AG, OptoTech Optikmaschinen GmbH, Alluxa Inc., Mustang Vacuum Systems |
