PDMS Market Report Scope & Overview:
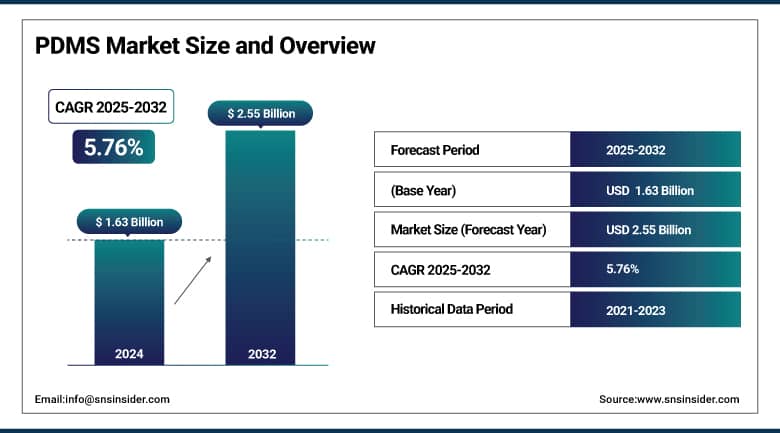
The PDMS Market size was valued at USD 1.63 billion in 2024 and is expected to reach USD 2.55 billion by 2032, growing at a CAGR of 5.76% over the forecast period of 2025-2032.
The PDMS market is growing rapidly with the increased application of silicone-based products in personal care, medical, and electronic products. The growing demand for PDMS for self-healing applications is one of the major factors considered in the PDMS industry trends. Personal care silicone compounds, such as PDMS, are widely used in shampoos and conditioners.
The FDA approves the use of PDMS in Vacutainer luer adapters, thus increasing the PDMS market share in medical devices. D4/D5 siloxanes being classified as SVHCs under the EU REACH is one illustration of how regulatory pressures are influencing the PDMS market perspective.
The EPA and EFSA have determined that PDMS is non-toxic and environmental-friendly when used as directed. PDMS manufacturers are being forced to invest in greener manufacturing and depolymerization processes. Increasing innovation and regulatory surveillance continue to expand the PDMS market size globally, and gradually, environmental and health safety compliance is increasing the attractiveness of the total PDMS market.
To Get More Information On PDMS Market - Request Free Sample Report
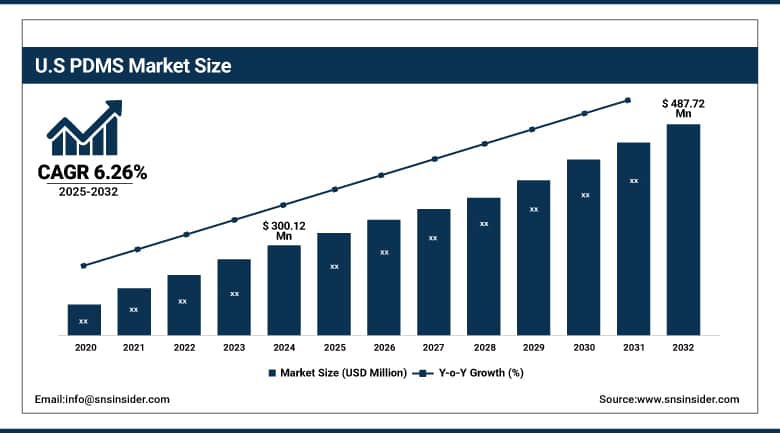
The U.S. dominates the North American PDMS market with a market size of USD 300.12 million and is projected to reach a value of USD 487.72 million in 2032 with a CAGR of 6.26% during the forecast period of 2025-2032. Its growth can be attributed to its robust market for silicone production and favorable regulatory environment under the guidance of the U.S. Food and Drug Administration (FDA). Growth of the nation’s personal care silicone ingredients industry, which includes companies, such as Dow Inc. and Momentive Performance Materials, fosters innovation in elastomers and fluids, it adds. Government initiatives to encourage green chemistry, such as the EPA’s effort with Safer Choice, drive the use of sustainable silicones and automotive adhesive products. These factors render the U.S. a key market in the PDMS market and impact the North American PDMS market growth and share.
Market Dynamics:
Drivers:
-
Increasing Use of PDMS in Personal Care Silicone Ingredients Drives Market Expansion
Rising requirement for hair and skincare personal care silicone products for shampoos and skin care is a major driver for the PDMS industry. In addition, PDMS provides smoothness, luster, and water repellency, and enhances the properties of the product. The Personal Care Products Council also states that people in North America and the Asia Pacific find silicones very important for consumer satisfaction. Growing sustainable formulations are driving the PDMS market outlook and grounding PDMS manufacturers towards green innovations. This further consolidates the position of the PDMS industry in personal care products and its indispensability for luxury cosmetics.
-
Advancements in Eco-Friendly Silicone Recycling Technologies Propel PDMS Market Growth
Sustainability needs push PDMS companies to conduct environmentally friendly recycling, such as depolymerization process, as an eco-friendly way to mitigate the environmental impact of silicone waste. Regulation bodies, such as ECHA and EPA promote waste minimization, and are also promoting closed-loop recycling options that reduce production costs. This is driving the market size of PDMS in environment-friendly industries, such as electronics and automotive. Developments in sustainable silicones are driving the PDMS market scenario in line with global initiatives of environmental protection and consumer demand. Consequently, the PDMS industry is expected to expand with the development of environmentally friendly strategies of manufacturing strategies.
Restraints:
-
Limited Awareness About Silicone Material Benefits Restricts PDMS Market Penetration in Emerging Economies
Due to a lack of knowledge and information about the merits of PDMS in new markets, market penetration and market growth were limited. Due to economic reasons and a lack of technical knowledge, the conventional materials predominate, although they have inferior properties. The Silicone Industry Association and UNIDO stress education as the key to enhancing uptake among the building, automotive, and electronics industries in Asia Pacific and Latin America. This lack of awareness would however retard the trends of the PDMS market and hamper the growth of the market share. PDMS enterprises need to invest in showing customers the product value to enlarge the PDMS market globally.
Segmentation Analysis:
By Type
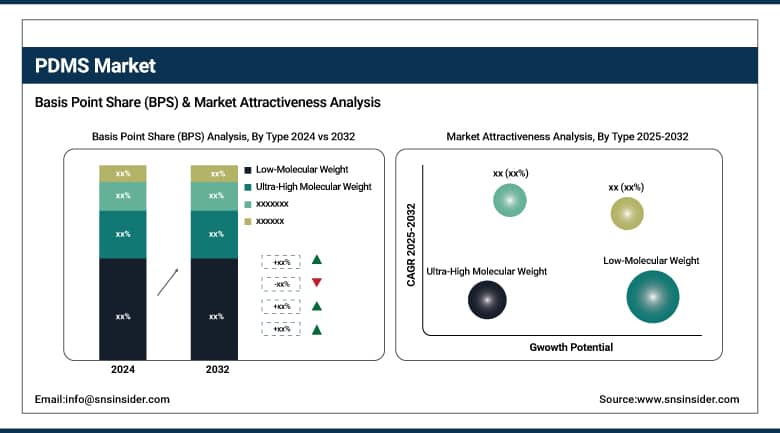
Low molecular weight segment of the PDMS market dominates about 42.7% of the market as it is used extensively in the form of fluids which act a lubricants, anti-foaming, and heat transfer fluids. The leading position of this segment is due to its extensive use in industrial processes and personal care silicone ingredients, with FDA approval for medical use and ECHA regulations for safety. Advocacy groups, such as the PCPC, champion its use and argue that PDMS is necessary to meet consumer demand for product performance.
Ultra-high molecular weight PDMS is expanding at a robust CAGR of around 23.6% due to the rising need for tough elastomers in medical devices and flexible electronics. With great mechanical performance and biocompatibility, it meets the requirements of the FDA and ISO, and has been developed in some cutting-edge fields. This expansion works well for the PDMS industry, which must compete to develop new products and services to satisfy increasing demand for elastomers, an in-demand segment of high-performance materials based on silicone.
By Form
PDMS fluids led demand and accounted for approximately 48.4% of the total market share, owing to their multiple applications in cosmetics, lubricants, and sealants. These silicones have been classified as low in toxicity by the EPA and EFSA, and are common within personal care products (shampoo and conditioner) as endorsed by the Personal Care Products Council. This leading fluid form drives growth in the PDMS market by delivering the industrial and consumer demand for safe and efficient silicone products.
Elastomer type of PDMS drives growth at a 6.09% CAGR, driven by growing applications in soft robotics, medical equipment, and sealing solutions. The flexibility and durability of this form come in response to the needs of the emerging industry, with support from the FDA and funding from the U.S. agencies, such as the National Science Foundation. The subsegment of elastomer development has generated the overall PDMS market trends, indicating that silicone’s potential for high-end, niche applications is firmly on the rise.
By End-Use Industry
The household and personal care sector in the PDMS market is likely to contribute 25.9% of the market share owing to the addition of low-MW fluids in the shampoos, conditioners, and skin products. The Personal Care Products Council and the FDA have confirmed the safety and efficacy of these silicone ingredients, driving consumer demand and industry adoption. This section’s preeminence is further consolidated by smooth texture and shine as trends in personal care formulations, representing a vigorous force in the proliferation of the PDMS market.
The electric and electronics field of the PDMS market is regaining momentum with the CAGR projections around 6.42%, owing to encapsulants, thermal gels, and flexible circuitry materials. These silicon-based materials are critical in the performance of next-generation electronics for heat removal and insulation. IEEE and IEC standards back their universal use, further promoting manufacturers to develop. This segment is growing due to the miniaturization and improved durability of electronics, which is seen generally, and is spurring growth in the PDMS market.
Regional Analysis:
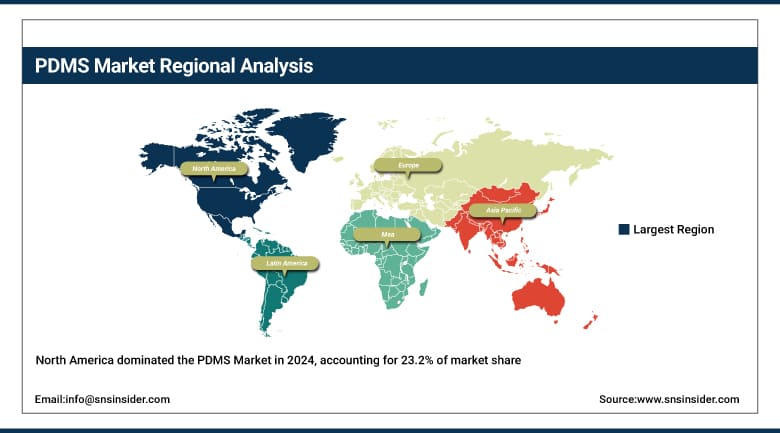
North America is the second dominating region in the PDMS market, accounting for 23.2% of the market share and the fastest growing with a CAGR of 6.32%. Growth is driven by the region’s established industrial base, a robust and expanding personal care industry, and greater utilization of silicone-based materials in both electronics and medical applications. Government-led initiatives for sustainable materials and regulations imposed by regulatory bodies, such as the U.S Environmental Protection Agency (EPA) drive the market. Furthermore, the existence of the top PDMS vendors investing in innovation also contributes to strong PDMS market growth trends.
Get Customized Report as Per Your Business Requirement - Enquiry Now
Asia Pacific dominates the PDMS market with a commanding 44.1% share, driven by fast industrialization and increasing use in electronic, personal care, and healthcare fields. The market in the region is influenced by the positive government policies and investment for the research and development of silicone-based materials, recently, along with China, India, and Japan. Local organizations, such as the China National Chemical Information Center, are actively encouraging the use of PDMS. These are the key drivers that place the Asia Pacific as the leader in the growth and innovation of PDMS companies in the world.
China is the leading force in Asia Pacific for PDMS, aided by government programmes such as the Made in China 2025 initiative that is pushing forward advanced materials, of which silicones are a part. The China National Chemical Information Center has announced the strong momentum of demand for personal care silicone products and industrial resin. Firms, such as Bluestar Silicones increase manufacturing capacity to satisfy increasing domestic and export requirements. The policy environment and the level of investment in technology innovation in China are shaping trends and market shares in the PDMS market in the region.
Key Players:
-
Dow Inc.
-
Wacker Chemie AG
-
Shin-Etsu Chemical Co., Ltd.
-
Momentive Performance Materials
-
Elkem ASA
-
DuPont de Nemours, Inc.
-
KCC Corporation
-
Wynca Group
-
Dongyue Group Limited
-
Bluestar Silicones (Elkem Group).
Recent Developments:
-
In June 2024 - Wacker Chemie began building a specialty silicone plant in the Czech Republic, targeting electromobility and medical sectors with expected completion in 2025.
| Report Attributes | Details |
|---|---|
| Market Size in 2024 | USD 1.63 billion |
| Market Size by 2032 | USD 2.55 billion |
| CAGR | CAGR of 5.76% From 2025 to 2032 |
| Base Year | 2024 |
| Forecast Period | 2025-2032 |
| Historical Data | 2021-2023 |
| Report Scope & Coverage | Market Size, Segments Analysis, Competitive Landscape, Regional Analysis, DROC & SWOT Analysis, Forecast Outlook |
| Key Segments | •By Type (Low-Molecular Weight, High-Molecular Weight, Ultra-High Molecular Weight) •By Form (Elastomer, Fluid, Resin, Others) •By End-Use Industry (Industrial Process, Building & Construction, Household & Personal Care, Electrical & Electronics, Transportation, Healthcare, Others) |
| Regional Analysis/Coverage | North America (US, Canada, Mexico), Europe (Germany, France, UK, Italy, Spain, Poland, Turkey, Rest of Europe), Asia Pacific (China, India, Japan, South Korea, Singapore, Australia, Rest of Asia Pacific), Middle East & Africa (UAE, Saudi Arabia, Qatar, South Africa, Rest of Middle East & Africa), Latin America (Brazil, Argentina, Rest of Latin America) |
| Company Profiles | Dow Inc., Wacker Chemie AG, Shin-Etsu Chemical Co., Ltd., Momentive Performance Materials, Elkem ASA, DuPont de Nemours, Inc., KCC Corporation, Wynca Group, Dongyue Group Limited, and Bluestar Silicones (Elkem Group) |
Frequently Asked Questions
Major PDMS companies include Dow Inc., Wacker Chemie, Shin-Etsu Chemical, Momentive, Elkem ASA, DuPont, KCC, Wynca Group, and Bluestar Silicones.
North America, with a 23.2% share and 6.32% CAGR, is fueled by the FDA-regulated healthcare market and advanced silicone manufacturing.
Asia Pacific leads the PDMS market with a 44.1% share, driven by China, Japan, and India’s government support and rapid industrialization.
Ultra-high molecular weight PDMS is growing at a CAGR of 23.6%, driven by demand for biocompatible elastomers in medical and flexible electronics.
The PDMS market size is projected to reach USD 2.55 billion by 2032, growing at a CAGR of 5.76% from USD 1.63 billion in 2024.
Get in Touch
