Recyclable Packaging Market Report Scope & Overview:
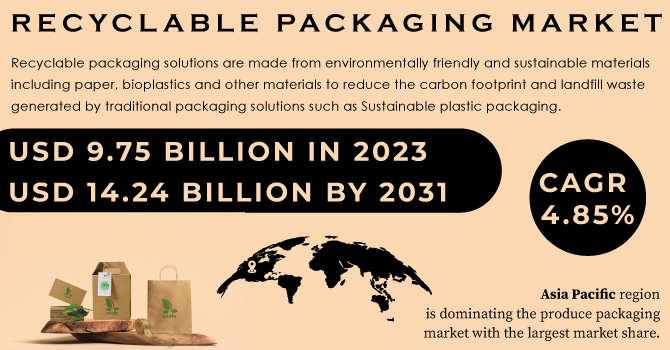
The Recyclable Packaging Market size was USD 28.83 billion in 2023 and is expected to Reach USD 47.24 billion by 2032 and grow at a CAGR of 5.64% over the forecast period of 2024-2032.
The recyclable packaging market is experiencing significant growth, driven by heightened environmental awareness among consumers and stringent government regulations aimed at reducing plastic waste. Consumers are increasingly favoring products with eco-friendly packaging, prompting businesses to adopt sustainable practices. Governments worldwide have implemented policies mandating the use of recyclable materials and imposing penalties on non-compliance, further accelerating this shift. For instance, the European Union has set ambitious targets for recycling packaging waste, compelling manufacturers to transition to recyclable solutions. Innovations in packaging materials and recycling technologies are also contributing to market expansion. Advancements such as improved sorting and cleaning techniques enhance the quality of recycled materials, while the development of biodegradable options offers sustainable alternatives. These innovations make recycling processes more efficient and economically viable, encouraging broader adoption across various industries. The food and beverage sector, in particular, has seen a substantial increase in the use of recyclable packaging, reflecting both regulatory pressures and consumer demand for sustainable products.
Get More Information on Recyclable Packaging Market - Request Sample Report
Additionally, corporate sustainability initiatives are playing a crucial role, with many companies committing to environmentally responsible practices, including the adoption of recyclable packaging materials. This trend not only enhances brand image among eco-conscious consumers but also aligns with long-term sustainability objectives. Despite challenges such as the need for investment in recycling infrastructure and the development of cost-effective recyclable materials, the market is poised for continued growth. The ongoing emphasis on sustainability, coupled with technological advancements and supportive regulatory frameworks, positions recyclable packaging as a key component in the global effort to reduce environmental impact and promote a circular economy.
MARKET DYNAMICS
DRIVERS
-
Rising environmental awareness, strict regulations, and corporate sustainability commitments are driving the growth of the recyclable packaging market, with trends like bioplastics, paper-based packaging, and closed-loop recycling shaping its expansion.
The increasing awareness of environmental sustainability among consumers and businesses is a major driver of growth in the recyclable packaging market. As concerns over plastic pollution and carbon footprints rise, companies are shifting towards eco-friendly packaging solutions. Governments worldwide are enforcing strict regulations, such as bans on single-use plastics and extended producer responsibility (EPR) policies, compelling industries to adopt sustainable alternatives. Additionally, corporate sustainability goals are accelerating the transition to recyclable materials, with many brands pledging to use 100% recyclable or biodegradable packaging by 2030. The market is witnessing trends such as the adoption of paper-based packaging, bioplastics, and closed-loop recycling systems. The growing demand for sustainable packaging in e-commerce and the food & beverage industry further propels market expansion. With continuous innovation and investments in recycling infrastructure, the recyclable packaging market is expected to grow steadily, aligning with global sustainability goals and circular economy principles.
RESTRAINT
-
The high initial costs of recyclable packaging, including materials, infrastructure, and compliance, pose a financial challenge for SMEs, slowing sustainability adoption.
Transitioning to recyclable packaging involves substantial initial costs, including investments in new raw materials, specialized manufacturing equipment, and upgraded recycling infrastructure. Many recyclable alternatives, such as bioplastics or advanced paper-based packaging, require different processing techniques, often leading to higher production expenses compared to conventional plastic packaging. Additionally, setting up efficient collection, sorting, and recycling systems demands capital-intensive infrastructure, which can be a major challenge, especially for small and medium-sized enterprises (SMEs) with limited financial resources. SMEs may struggle to absorb these costs while maintaining competitive pricing, making the shift toward sustainability a slower process. Moreover, compliance with evolving regulatory requirements and sustainability certifications further adds to operational expenses. Although long-term benefits such as brand value, regulatory compliance, and environmental impact reduction are significant, the high upfront costs remain a key barrier, requiring government incentives, industry collaboration, and technological advancements to ease the financial burden on businesses.
MARKET SEGMENTATION
By Material
Plastics segment dominated with the market share over 40% in 2023, because of their versatility, lightweight nature, durability, and cost-effectiveness. These properties make plastics ideal for a wide range of packaging applications, from food containers to beverage bottles. As sustainability becomes a priority, companies are turning to recyclable plastics like PET (Polyethylene Terephthalate), HDPE (High-Density Polyethylene), and bioplastics to reduce their environmental impact. The growing emphasis on circular economy principles is also boosting the use of recycled PET (rPET), which helps conserve resources and reduce waste. Additionally, the increasing demand for biodegradable plastics in packaging further strengthens plastics' market dominance, enabling brands to align with eco-conscious consumer preferences and comply with stringent environmental regulations.
By Application
The Bottles & Jars segment dominated with the market share over 32% in 2023. This dominance is primarily due to the widespread use of bottles and jars across various industries, including food and beverages, pharmaceuticals, and personal care. Bottles and jars are typically made from materials like glass, PET, and HDPE, which are highly recyclable and in demand due to growing environmental awareness and sustainability efforts. The increasing consumer preference for eco-friendly packaging solutions has significantly contributed to the growth of this segment. Additionally, advancements in recycling technologies and regulations supporting sustainability have boosted the adoption of recyclable bottles and jars, further strengthening their position in the market.
KEY REGIONAL ANALYSIS
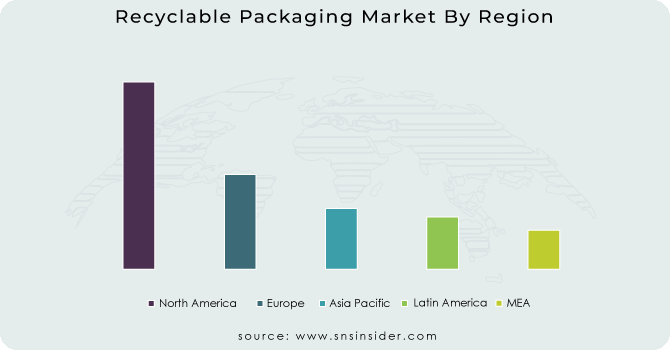
Europe region dominated with the market share over 36% in 2023, driven by strict environmental regulations, high consumer awareness, and robust recycling infrastructure. The European Union's Circular Economy Action Plan and the Single-Use Plastics Directive aim to make all packaging reusable or recyclable by 2030, fostering a sustainable packaging ecosystem. Additionally, countries like Germany and France have adopted extended producer responsibility (EPR) systems, which require businesses to manage the entire lifecycle of their packaging waste. These measures promote the collection and recycling of packaging materials, ensuring that businesses are incentivized to use recycled content. This comprehensive approach makes Europe a leader in recyclable packaging, setting standards for sustainability across industries.
The Asia-Pacific region is experiencing significant growth in the recyclable packaging market, driven by increasing environmental awareness and the rising demand across industries such as manufacturing, e-commerce, and retail. This growth is fueled by the region’s large, urbanizing population, particularly in countries like China, India, and Indonesia, leading to a higher demand for packaged goods and recyclable packaging solutions. Japan's recyclable packaging market is also set to grow, highlighted by initiatives like the collaboration between Oji Holdings and Tetra Pak to establish Japan's first recycling system for aseptic cartons. These efforts promote sustainability and recycling, further driving market expansion.
Get Customized Report as per Your Business Requirement - Request For Customized Report
Some of the major key players of the Recyclable Packaging Market
-
Amcor (Zurich, Switzerland)
-
Be Green Packaging (Los Angeles, USA)
-
Nampak (Johannesburg, South Africa)
-
Sealed Air (Charlotte, USA)
-
Mondi (Vienna, Austria)
-
DS Smith (London, UK)
-
Evergreen Packaging (Memphis, USA)
-
Tetra Laval (Lund, Sweden)
-
Ball Corporation (Broomfield, USA)
-
International Paper (Memphis, USA)
-
Berry Global Inc. (Evansville, USA)
-
Huhtamaki Oyj (Espoo, Finland)
-
ProAmpac (Cincinnati, USA)
-
Constantia Flexibles (Vienna, Austria)
-
Genpak (Glens Falls, USA)
-
Crown Holdings, Inc. (Philadelphia, USA)
-
Gerresheimer AG (Düsseldorf, Germany)
-
Stora Enso (Helsinki, Finland)
-
WestRock Company (Atlanta, USA)
-
NEFAB GROUP (Gavle, Sweden)
Suppliers for (packaging solutions, focusing on reducing waste and increasing recyclability) on Recyclable Packaging Market
-
Amcor plc
-
Tetra Pak
-
Sealed Air Corporation
-
Smurfit Kappa Group
-
Mondi Group
-
DS Smith
-
Ball Corporation
-
WestRock Company
-
International Paper
-
Huhtamaki Oyj
RECENT DEVELOPMENT
In July 2024: Mondi plc introduced FlexiBag Reinforced, the latest addition to its line of sustainable pre-made plastic bags. This new, mono-PE-based, recyclable packaging solution offers superior mechanical properties.
In June 2024: Berry Global Group, Inc. launched a customizable, rectangular Domino bottle made with up to 100% post-consumer recycled (PCR) plastic, designed for the beauty, home, and personal care markets.
In May 2023: Mauser Packaging Solutions expanded its global collection and reconditioning network with the opening of a new facility in Tarsus, Turkey. Through the Recover Syst-M program, the company collects IBCs and drums for reconditioning and reuse, or recycling when they are no longer usable.
In February 2023: Ball Corporation and Novelis, a supplier and recycler of aluminum, revealed that the Ball Aluminum Cup now contains 90% recycled content. This innovation builds on the cup’s infinite recyclability while reducing its carbon footprint.
| Report Attributes | Details |
|---|---|
| Market Size in 2023 | USD 28.83 billion |
| Market Size by 2032 | USD 47.24 billion |
| CAGR | CAGR of 5.64% From 2024 to 2032 |
| Base Year | 2023 |
| Forecast Period | 2024-2032 |
| Historical Data | 2020-2022 |
| Report Scope & Coverage | Market Size, Segments Analysis, Competitive Landscape, Regional Analysis, DROC & SWOT Analysis, Forecast Outlook |
| Key Segments | • By Material (Plastics, Paper & Paperboard, Glass, Metal, Others) • By Product (Bottles & Jars, Bags & Pouches, Boxes & Cartons, Trays & Containers, Drums & Cans, Others) • By Application (Food & Beverages, Healthcare & Pharmaceuticals, Personal Care & Cosmetics, Industrial & Chemical, Consumer Goods, Others) |
| Regional Analysis/Coverage | North America (US, Canada, Mexico), Europe (Eastern Europe [Poland, Romania, Hungary, Turkey, Rest of Eastern Europe] Western Europe] Germany, France, UK, Italy, Spain, Netherlands, Switzerland, Austria, Rest of Western Europe]), Asia Pacific (China, India, Japan, South Korea, Vietnam, Singapore, Australia, Rest of Asia Pacific), Middle East & Africa (Middle East [UAE, Egypt, Saudi Arabia, Qatar, Rest of Middle East], Africa [Nigeria, South Africa, Rest of Africa], Latin America (Brazil, Argentina, Colombia, Rest of Latin America) |
| Company Profiles | Amcor, Be Green Packaging, Nampak, Sealed Air, Mondi, DS Smith, Evergreen Packaging, Tetra Laval, Ball Corporation, International Paper, Berry Global Inc., Huhtamaki Oyj, ProAmpac, Constantia Flexibles, Genpak, Crown Holdings, Inc., Gerresheimer AG, Stora Enso, WestRock Company, NEFAB GROUP |
| Key Drivers | • Rising environmental awareness, strict regulations, and corporate sustainability commitments are driving the growth of the recyclable packaging market, with trends like bioplastics, paper-based packaging, and closed-loop recycling shaping its expansion. |
| Restraints | • The high initial costs of recyclable packaging, including materials, infrastructure, and compliance, pose a financial challenge for SMEs, slowing sustainability adoption. |
Frequently Asked Questions
Europe dominated the Recyclable Packaging Market in 2023
The “Plastics” segment dominated the Recyclable Packaging Market.
Rising environmental awareness, strict regulations, and corporate sustainability commitments are driving the growth of the recyclable packaging market, with trends like bioplastics, paper-based packaging, and closed-loop recycling shaping its expansion.
The Recyclable Packaging Market was USD 28.83 billion in 2023 and is expected to Reach USD 47.24 billion by 2032.
The Recyclable Packaging Market is expected to grow at a CAGR of 5.64% during 2024-2032.
Get in Touch
