Self-Amplifying RNA Synthesis Market Report Scope & Overview:
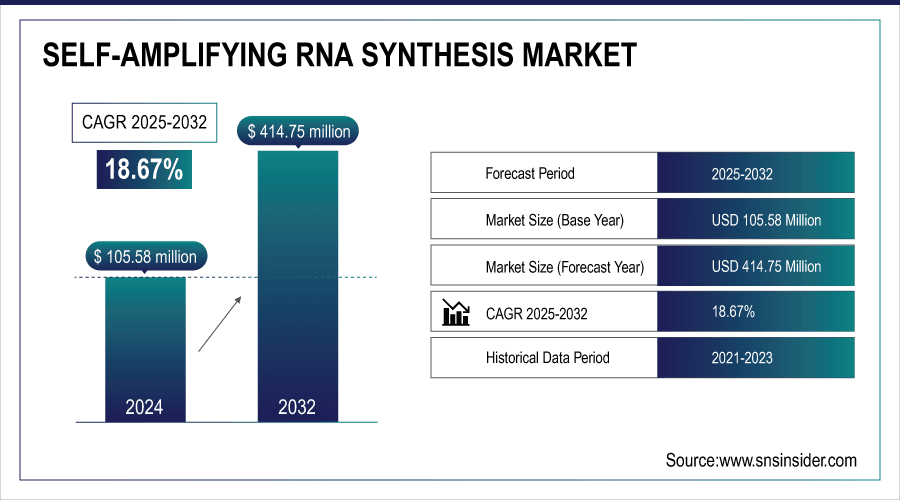
The Self-Amplifying RNA Synthesis Market was valued at USD 105.58 million in 2024 and is expected to reach USD 414.75 million by 2032, growing at a CAGR of 18.67% over the forecast period of 2025-2032.
The global self-amplifying RNA Synthesis market is growing at a rapid pace due to widespread trends that include low-dose levels with high efficacy vaccines for infectious diseases, including COVID-19 and influenza. One of the significant self-amplifying RNA synthesis market trends is the growing trend toward personalized medicine, with saRNA able to express multiple antigens being used to develop customized cancer and rare disease treatments, thereby driving the transition to patient-specific and scalable therapeutic options.
For instance, in May 2024, GSK and CureVac began a Phase II trial for a self-amplifying RNA flu vaccine after Phase I showed a strong immune response at low doses.
To Get More Information On Self-Amplifying RNA Synthesis Market - Request Free Sample Report
Self-amplifying RNA Synthesis Market Trends
-
Technological advancements drive adoption. Automated, high-throughput, and scalable saRNA synthesis platforms improve yield, reduce errors, and accelerate vaccine and therapeutic development.
-
Material and formulation innovations. Optimized nucleotides, lipid nanoparticles, and stabilizing reagents enhance stability, translation efficiency, and clinical efficacy.
-
Customized and modular synthesis. Tailored saRNA constructs support diverse therapeutic targets, rapid prototyping, and personalized medicine applications.
-
Rising demand from global health initiatives. Vaccines, infectious disease therapies, and oncology programs are expanding, boosting market growth globally.
-
Emerging regional infrastructure. Asia-Pacific, Latin America, and the Middle East are scaling biotech facilities, government-backed programs, and local manufacturing, accelerating adoption.
-
Focus on cost-effectiveness and rapid production. Shorter development timelines, scalable synthesis, and improved delivery platforms drive adoption in both research and commercial applications.
The U.S. Self-Amplifying RNA Synthesis Market was valued at USD 188.16 million in 2024 and is expected to reach USD 290.42 million by 2032, growing at a CAGR of 5.59% over 2025-2032.
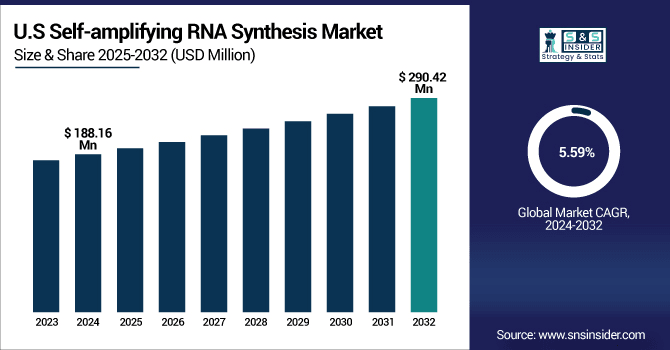
Self-amplifying RNA Synthesis Market in the U.S. is led by a well-established biotech landscape, increasing R&D spending, and ongoing government support. Both commercial players and academia contribute to the innovation and clinical testing of saRNA vaccines and therapies. Particularly, the country’s strong regulatory support and early uptake of RNA technologies continue to fuel its market dominance as per the recent self-amplifying RNA synthesis market analysis.
Self-amplifying RNA Synthesis Market Growth Drivers:
-
Rapid Vaccine and Therapeutic Development Is Driving the Self-amplifying RNA Synthesis Market Growth
One of the major factors driving the self-amplifying RNA synthesis market share is its utility in fast-track vaccine and drug development. In this sense, saRNA has the advantage of being a rapid design and manufacturing technology to address the emergence of infectious diseases, therefore, making it an important tool for potential pandemic preparedness. However, this speed in saRNA may give it the advantage in the preferred platform for global health crises, as it dramatically increases market share.
For instance, in February 2025, CureVac developed a self-amplifying RNA COVID-19 booster over sequence design to production in under 60 days, showcasing saRNA’s rapid-response advantage.
Self-amplifying RNA Synthesis Market Restraints:
-
Complex Manufacturing and Stability Challenges are a Significant Restraint on the Self-amplifying RNA Synthesis Market Growth
Complexity of manufacturing and stability. Complexity is a significant barrier that inhibits the self-amplifying RNA synthesis market growth. saRNA agents are also both delicate and susceptible to degradation, which necessitates complex synthesis, purification, and a cold chain for moving them around. These problems raise the cost of production and reduce the scalability. Maintaining consistent quality across different batches, shelf life, and delivery efficacy continues to be a technical challenge to the broad use and application market of saRNA-based products.
Self-amplifying RNA Synthesis Market Opportunities:
-
Personalized Medicine Creates Lucrative Opportunities for Innovative Testing Equipment
The personalized medicine market for self-amplifying RNA (saRNA) synthesis involves the development of saRNA constructs customized using specific information on the genetic profile of individual patients. This allows very targeted therapies, especially for cancer, and rare diseases, as effectiveness is increased and side effects are minimized. Fast synthesis and modular construction enable the rapid development of patient-specific treatments, the need for new, flexible and precise saRNA platforms for personalized medicine is created.
For instance, in January 2025, over 25 saRNA-based vaccine candidates entered global clinical trials, targeting infectious diseases like influenza, RSV, and COVID-19 variants, reflecting rapid adoption and market growth.
Self-amplifying RNA Synthesis Market Segment Analysis
-
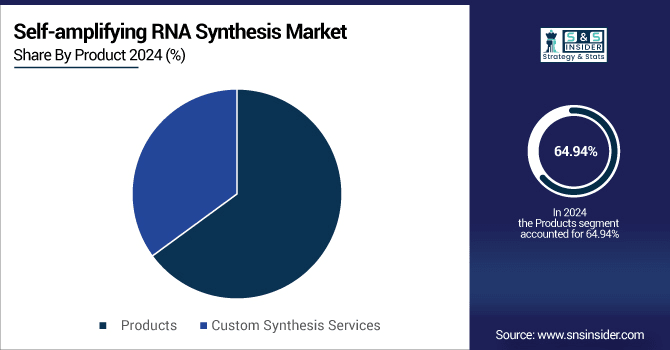
By product, products led the self-amplifying RNA synthesis market with a 64.94% share in 2024, while custom synthesis services are the fastest-growing segment with a CAGR of 19.00%.
-
By application, the therapeutics development dominated the market with a 72.83% share in 2024, whereas the biomedical research kit segment is expected to grow fastest with a CAGR of 19.06%.
-
By route of administration, intramuscular (IM) led the market with 55.94% share in 2024, while intradermal (ID) is registering the fastest growth with a CAGR of 19.64%.
-
By end user, pharmaceutical & biotechnology companies held a 55.86% share in 2024, while academic & research institutes are growing the fastest with a CAGR of 19.84%.
By Product, Products Lead Market, While Custom Synthesis Services Register Fastest Growth
In 2024, Products lead the Self-amplifying RNA Synthesis Market, holding the largest share owing to the rising requirement of high-purity saRNA reagents, enzymes, and synthesis kits applied in vaccine and therapeutic development. Rising research & development activities, expeditious product commercialization among saRNA-based vaccines. Custom synthesis services are registering the fastest growth, owing to the increased need for custom saRNA designs for vaccine and therapeutic development. Biotech companies and academic research organizations are more often outsourcing synthesis to specialized service providers for reasons of speed, scale, and expertise.
By Application, Therapeutics Development Dominates, While the Biomedical Research Shows Rapid Growth
By application, the therapeutics development dominates the Self-amplifying RNA Synthesis Market, owing to its increasing use in cancer immunotherapy, infectious disease treatment, and orphan genetic diseases. In addition to easy targeting of the cell type and the regulation of protein expression levels. The biomedical research is showing rapid growth driven by the growing interest of the academic and institutional global in investigating saRNA for new applications.
By Route of Administration, Intramuscular (IM) Lead While Intradermal (ID) Register Fastest Growth
By route of administration, intramuscular (IM) leads the Self-amplifying RNA Synthesis Market, driven by its strong immunogenic effects in the delivery of saRNA vaccines and therapeutics. IM administration has high absorbability, is easy, and does not require high technique, thus it is suitable for mass vaccination. While intradermal (ID) is registering the fastest growth, as it can elicit strong immune responses at lower concentrations. ID delivery targets the immunologically active layers of skin, thereby improving the efficiency of the vaccine and reducing costs.
By End User, Pharmaceutical & Biotechnology Companies Lead While Academic & Research Institutes Grow Fastest
By end user, pharmaceutical & biotechnology companies lead the Self-amplifying RNA Synthesis Market, owing to their prominence in saRNA-mediated drug and vaccine production. Such companies sink huge resources into research, clinical trials, and scalable manufacturing. Whereas academic & research institutes are growing the fastest, driven by growing public and private investment in RNA-based research. Such institutions shape early-stage discovery, mechanistic understanding, and preclinical validation of saRNA.
Self-amplifying RNA Synthesis Market Regional Analysis:
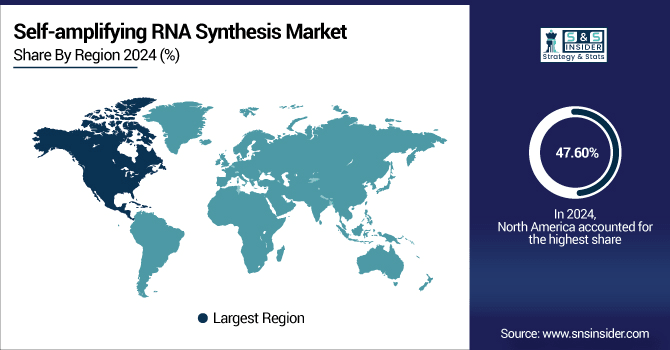
North America Self-amplifying RNA Synthesis Market Insights
In 2024, North America dominated the Self-amplifying RNA Synthesis Market and accounted for 47.60% of the revenue share. owing to the advanced biotechnology capabilities, substantial government and industry investment, and a concentration of top pharmaceutical and biotech firms, the region. The area has a strong track record in clinical research, favourable regulatory environments, and strong linkages between academia and industry. The U.S., in particular, is currently at the forefront with significant funding by NIH and BARDA, pushing forward the saRNA vaccine and treatment development. Furthermore, the proliferation of first-in-class RNA technologies and a mature CDMO infrastructure even reinforces North America's lead in the industrialization and commercial scale-up of saRNA in therapeutic categories.
Get Customized Report as Per Your Business Requirement - Enquiry Now
U.S. Self-amplifying RNA Synthesis Market Insights
Self-amplifying RNA Synthesis Market in the U.S. is led by a well-established biotech landscape, increasing R&D spending, and ongoing government support. Both commercial players and academia contribute to the innovation and clinical testing of saRNA vaccines and therapies. Particularly, the country’s strong regulatory support and early uptake of RNA technologies continue to fuel its market dominance, as per the recent self-amplifying RNA synthesis market analysis.
Asia-Pacific Self-amplifying RNA Synthesis Market Insights
Asia-Pacific is expected to witness the fastest growth in the Self-amplifying RNA Synthesis Market over 2025-2032, with a projected CAGR of 19.67%, propelled by the growing levels of biotechnology infrastructure, government funding, and healthcare investments in nations including Japan, South Korea, China, and India. The growing need for low-cost, scalable vaccines and therapeutics makes the region particularly attractive in which to pursue the use of saRNA for both infectious disease control and emergent therapeutic applications. Academia and biotech startups are in close partnership with global corporations, hastening the pace of saRNA R&D. Furthermore, growing clinical trial efforts, rising outsourcing of pharmaceuticals, and the business drive to enhance readiness to pandemics are driving the market.
China Self-amplifying RNA Synthesis Market Insights
China leads the regional market in the production of saRNA, owing to its well-established biotech infrastructure and government support in vaccine and therapeutic development. Local manufacturing, local clinical trials, and rapid response vaccine programs are key triggers for saRNA adoption and investment.
Europe Self-amplifying RNA Synthesis Market Insights
Europe is the second leading region in the Self-amplifying RNA Synthesis Market owing to strong academic research and favorable regulatory policies, along with increasing investment for RNA-based therapeutics. Countries including Germany, the UK, and the Netherlands are home to some of the world’s largest biotech companies and collaborative EU-funded research projects. Growing attention to pandemic preparedness, personalised medicine, and cross-border innovation projects is boosting the development of saRNAs, while ensuring a leading place for Europe on the global market.
Germany Self-amplifying RNA Synthesis Market Insights
Germany, driven by a demanding healthcare regulatory framework and patient safety-oriented policy, is leading the European saRNA synthesis industry. In particular, saRNA platforms have been adopted for vaccines and personalized therapies, as efficient, economical substitutes to traditional RNA- or protein-based therapies
Latin America (LATAM) and Middle East & Africa (MEA) Self-amplifying RNA Synthesis Market Insights
The saRNA synthesis market in Latin America & MEA, is driven by increased biotech infrastructure, government-funded vaccine programs, and rising clinical trials. The growing burden of infectious diseases and collaborations with global biotech giants push the uptake, local manufacturing, and training programs to develop regional capacity for quicker development and deployment of saRNA-based vaccines and treatment.
Self-amplifying RNA Synthesis Market Competitive Landscape:
Moderna is a pioneering biotechnology company focused on mRNA and saRNA vaccines and medicines. Its technology allows fast generation of saRNA for infectious disease vaccines, oncology treatments, and individualized medicines. Ongoing R&D and collaborations with global partners facilitate scale-up, improved economics, and widespread adoption of saRNA technology globally.
-
In March 2025, Moderna advanced saRNA-based COVID-19 and influenza vaccines into Phase II trials in March 2025, emphasizing scalable manufacturing, faster production, and enhanced immune responses for global immunization programs.
BioNTech SE develops saRNA and mRNA-based immunotherapies, primarily for use as a vaccine and against cancer. The firm uses its advanced synthesis platform, modular design, and LNP delivery system. Strategic partnerships with leading pharmaceutical corporations further increase manufacturing capabilities and speed up clinical studies and commercialization for saRNA-based drugs.
-
In July 2024, BioNTech expanded its German saRNA manufacturing facility, increasing capacity for infectious disease and oncology programs, enabling rapid clinical trial deployment and accelerated therapeutic development.
Arcturus Therapeutics focuses on self-replicating RNA therapeutics and vaccines, with an emphasis on rapid, large-scale manufacturing and optimization of delivery. Its LUNAR lipid platform enhances translation efficiency and stability. The firm is engaged in the development of vaccines for infectious diseases and rare diseases, and is shaping up as an early-breaker in the saRNA synthesis space.
-
In November 2024, Arcturus partnered with a major CMO in November 2024 to scale saRNA vaccine production, supporting multiple infectious disease programs and expediting global clinical trials and commercial readiness.
Self-amplifying RNA Synthesis Market Key Players:
Some of the Self-amplifying RNA Synthesis Market Companies are:
-
Moderna, Inc
-
BioNTech SE
-
Arcturus Therapeutics
-
CureVac N.V.
-
GSK plc
-
Imperial College London
-
Replicate Bioscience
-
VaxEquity
-
Providence Therapeutics
-
eTheRNA immunotherapies
-
GreenLight Biosciences
-
Acuitas Therapeutics
-
Chimeron Bio
-
SAB Biotherapeutics
-
Aldevron
-
TriLink BioTechnologies
-
Catalent Inc.
-
Lonza Group AG
-
Cartography Biosciences
-
SomaLogic Inc.
| Report Attributes | Details |
|---|---|
| Market Size in 2024 | USD 105.58 million |
| Market Size by 2032 | USD 414.75 million |
| CAGR | CAGR of 18.67% From 2025 to 2032 |
| Base Year | 2024 |
| Forecast Period | 2025-2032 |
| Historical Data | 2021-2023 |
| Report Scope & Coverage | Market Size, Segments Analysis, Competitive Landscape, Regional Analysis, DROC & SWOT Analysis, Forecast Outlook |
| Key Segments | "• By Product (Products, Custom Synthesis Services) • By Application (Therapeutics Development, Biomedical Research ) • By Route of Administration (Intramuscular, Subcutaneous, Intradermal, Intravenous ) •By End User(Pharmaceutical & Biotechnology Companies, Academic & Research Institutes, Other End User) |
| Regional Analysis/Coverage | North America (US, Canada), Europe (Germany, France, UK, Italy, Spain, Poland, Russsia, Rest of Europe), Asia Pacific (China, India, Japan, South Korea, Australia,ASEAN Countries, Rest of Asia Pacific), Middle East & Africa (UAE, Saudi Arabia, Qatar, Egypt, South Africa, Rest of Middle East & Africa), Latin America (Brazil, Argentina, Mexico, Colombia Rest of Latin America) |
| Company Profiles | Moderna, Inc, BioNTech SE, Arcturus Therapeutics, CureVac N.V., GSK plc, Imperial College London, Replicate Bioscience, VaxEquity, Providence Therapeutics, eTheRNA immunotherapies, GreenLight Biosciences, Acuitas Therapeutics, Chimeron Bio, SAB Biotherapeutics, Aldevron, TriLink BioTechnologies, Catalent Inc., Lonza Group AG, Cartography Biosciences, SomaLogic Inc and other players. |
Frequently Asked Questions
North America dominated the Self-amplifying RNA Synthesis Market in 2024.
The therapeutics development segment dominated during the projected period.
One of the major factors driving the self-amplifying RNA synthesis market share is its utility in fast-track vaccine and drug development.
The market was valued at USD 105.58 million in 2024 and is projected to reach USD 414.75 million by 2032.
The Self-amplifying RNA Synthesis Market is expected to grow at a CAGR of 18.67% over 2025–2032.
Get in Touch
