Industrial Gas Sensors Market Size
Get More Information on Industrial Gas Sensors Market - Request Sample Report
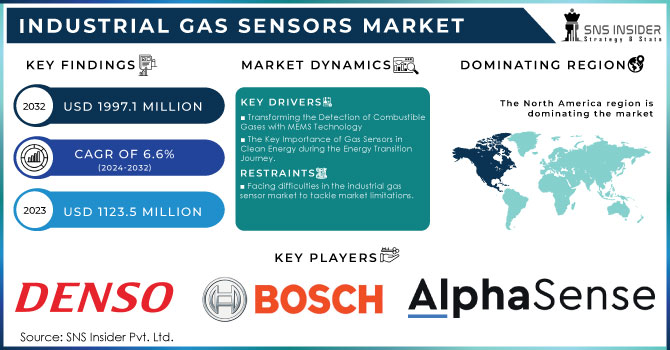
The Industrial Gas Sensors Market size was valued at USD 1123.5 million in 2023 and is expected to grow to USD 1997.1 million by 2032 and grow at a CAGR of 6.6 % over the forecast period of 2024-2032.
The Industrial Gas Sensors Market is seeing substantial growth due to rising need for improved safety protocols and environmental surveillance in sectors like manufacturing, oil & gas, mining, and chemical processing. Gas sensors used in industries are crucial for identifying dangerous gases such as carbon monoxide, methane, and volatile organic compounds (VOCs). They help prevent accidents, ensure worker safety, and adhere to strict environmental regulations. Major factors influencing the market include the increasing adoption of Industrial Internet of Things (IIoT) solutions that allow for real-time monitoring and data analytics, enhancing operational efficiency and safety. Furthermore, governments across the globe are implementing stricter regulations concerning emissions and workplace safety, which is increasing the need for gas sensing technologies. Electrochemical, infrared (IR), catalytic, and semiconductor gas sensors are the primary technologies leading the market. Electrochemical sensors are widely favored for their precision in identifying harmful gases. Additionally, the use of wireless and portable gas sensors is increasing because of their versatility and straightforward deployment in inaccessible or dangerous areas.
The rise in greenhouse gas (GHG) emissions, driven largely by fossil fuel combustion for electricity, heat, and transportation, highlights the critical need for technologies that can monitor and manage emissions. In 2022, U.S. greenhouse gas emissions totaled 6,343.2 million metric tons of CO₂ equivalent, reflecting a 0.2% increase compared to 2021 due to a post-pandemic rebound in economic activities. Notably, CO₂ emissions from natural gas rose by 5% relative to 2021, while emissions from coal dropped by 6%, primarily in the electric power sector. The industrial sector is the third largest source of GHG emissions, with significant contributions from fossil fuel combustion and certain chemical processes. As economic activity increases, the demand for accurate, real-time monitoring of emissions is rising, pushing the growth of the industrial gas sensors market. Gas sensors, particularly those integrated with Industrial Internet of Things (IIoT) solutions, play a vital role in monitoring gases like CO₂, methane, and volatile organic compounds (VOCs), ensuring compliance with environmental regulations and improving operational efficiency. As industries and power sectors work to curb emissions and transition towards cleaner energy, the adoption of gas sensors is crucial for tracking both direct and indirect emissions. These sensors help industries adhere to the strict regulatory standards set by bodies like the U.S. Environmental Protection Agency (EPA), which publishes the Inventory of U.S. Greenhouse Gas Emissions and Sinks. With industrial activities accounting for a significant share of GHG emissions, the market for gas sensors is expected to grow steadily as industries seek to reduce their carbon footprint and enhance air quality monitoring systems.
| Report Attributes | Details |
|---|---|
| Key Segments | • By Product (Oxygen, Carbon Dioxide, NOx, Others) • By Technology (Electrochemical, Semiconductor, Infrared, Others) • By End User (Healthcare, Building Automation & Domestic Appliances, Automotive, Petrochemical, Industrial, Others) |
| Regional Coverage | North America (US, Canada, Mexico), Europe (Eastern Europe [Poland, Romania, Hungary, Turkey, Rest of Eastern Europe] Western Europe] Germany, France, UK, Italy, Spain, Netherlands, Switzerland, Austria, Rest of Western Europe]), Asia Pacific (China, India, Japan, South Korea, Vietnam, Singapore, Australia, Rest of Asia Pacific), Middle East & Africa (Middle East [UAE, Egypt, Saudi Arabia, Qatar, Rest of Middle East], Africa [Nigeria, South Africa, Rest of Africa], Latin America (Brazil, Argentina, Colombia, Rest of Latin America) |
| Company Profiles |
City Technology Ltd. ,DENSO Europe B.V. ,Bosch Sensortec GmbH .Alphasense Figaro Engineering Inc. ,NGK Spark Plug ,Nemoto Sensor Engineering Co. Ltd. ,JJS Technical Services , Aeroqual Ltd. ,Techcomp Group,Honeywell Analytics,Emerson Electric Co. ,Siemens AG,Thermo Fisher ,Teledyne Gas and Flame Detection Msa Safety Incorporated ,RKI Instruments Inc. ,Industrial Scientific Corporation ,Ametek Sensirion AG ,Others |
Market Dynamics
Drivers
- Transforming the Detection of Combustible Gases with MEMS Technology
The growing need for advanced gas detection technologies in hazardous environments is a key factor driving the industrial gas sensor market. The trend is showcased with the introduction of advanced sensors such as Teledyne's OLCT 100-XP-MS, which integrates MEMS sensor technology. This new gas sensor gives precise measurements for various flammable gases, like hydrogen, methane, propane, and butane, and has benefits like resistance to sensor damage and longer lifespan in tough conditions. As industries look for greener options to natural gas, the need for efficient hydrogen detection solutions increases. MEMS technology enhances gas detection accuracy by providing precise measurements linked to particular gas levels, minimizing false alerts by adjusting for environmental factors such as temperature and humidity. The move towards modern, trustworthy gas detection systems is not only a reaction to regulations but also a proactive effort to increase workplace safety and decrease operational risks. As a result, there is a predicted substantial growth in the industrial gas sensor market due to the rising adoption of advanced technologies by businesses to protect their operations, particularly in industries like petrochemicals, oil and gas, and industrial manufacturing, where risks are elevated.
- The Key Importance of Gas Sensors in Clean Energy during the Energy Transition Journey.
The shift towards renewable energy and electrical power is leading to a growing need for industrial gas sensors, necessary for tracking greenhouse gas (GHG) emissions and meeting requirements of climate initiatives such as the Paris Agreement. As sectors aim to monitor and decrease their carbon footprint, gas sensors are vital instruments in tracking emissions from natural gas extraction and processing plants. The increasing need for natural gas worldwide, especially in Asia, is amplified by a rise in gas usage in industries, with predictions showing a 2.5% growth in natural gas demand by 2024. The significance of gas sensors is highlighted in upholding safety standards through detecting leaks and ensuring efficient operations in gas facilities. The IEA observed that natural gas markets showed strong growth in early 2024, however, risks to the industry include geopolitical tensions and fluctuating prices. It is crucial to have improved monitoring systems, especially with the EPA showing an 8% rise in CO₂ emissions from fossil fuel burning from 2020 to 2022. These numbers emphasize the critical need for precise and dependable gas detection technologies to reduce environmental effects. The industrial gas sensor market is poised for significant growth as industries implement advanced gas monitoring systems to comply with regulations, improve operations, and support a sustainable energy future.
Restraints
- Facing difficulties in the industrial gas sensor market to tackle market limitations.
Several major obstacles could impede the growth of the industrial gas sensor market. One of the main obstacles is the expensive nature of cutting-edge gas sensor technologies, such as MEMS and infrared sensors, making them unaffordable for small and medium-sized businesses (SMEs) with restricted budgets. Moreover, businesses may incur higher operational costs due to the requirement for routine maintenance and calibration of these sensors, which entails allocating resources for training and complying with safety regulations. Additionally, due to the fast rate of technological progress, companies might be reluctant to invest in new sensor technologies to avoid becoming outdated. Adding to these problems, regulatory obstacles may obstruct new market players from entering, as adhering to strict safety and environmental rules is frequently intricate and time-consuming. As per the International Energy Agency (IEA), uncertainties in geopolitics and shifts in energy market can impact investment in gas detection technologies, adding to the difficulties faced by manufacturers. Additionally, established players are under pressure to reduce prices without sacrificing quality due to rising competition from low-cost alternatives, mainly from developing markets, which impacts profit margins. It is essential for stakeholders to tackle these market limitations in order to improve the dependability and usage of industrial gas sensors, especially as safety and environmental adherence become top priorities for industries.
Segment Analysis
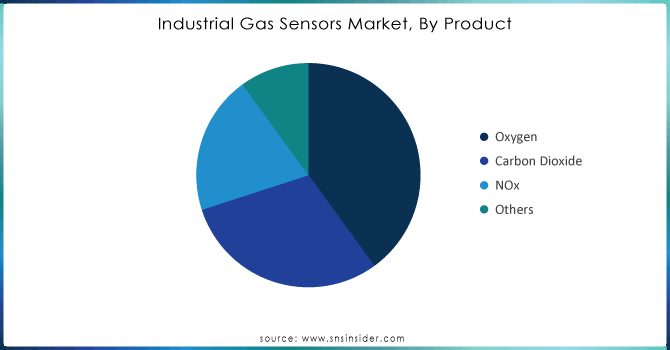
By Product
In the Industrial Gas Sensors Market, oxygen sensors hold the largest revenue share, accounting for 40% of the market in 2023. This dominance can be attributed to their critical role in various industries, including healthcare, petrochemical, and manufacturing, where monitoring oxygen levels is essential for safety and efficiency. Companies are actively investing in product development to enhance the performance and accuracy of oxygen sensors. For instance, recent innovations have focused on integrating advanced technologies such as Micro-ElectroMechanical Systems (MEMS) and optical sensing methods to improve sensitivity and reduce response times. Teledyne Gas and Flame Detection has launched the OLCT 100-XP-MS range, which incorporates MEMS technology for precise oxygen detection alongside multiple gas capabilities, enhancing reliability in challenging environments. Similarly, manufacturers like Honeywell and Siemens are continuously updating their oxygen sensor offerings, focusing on miniaturization and increased durability to meet the demands of various applications. As industries emphasize safety and compliance with environmental regulations, the need for accurate oxygen monitoring solutions will continue to drive advancements and growth in this segment of the industrial gas sensor market.
Need any customization research on Industrial Gas Sensors Market - Enquiry Now
By End User
In 2023, the Petrochemical segment dominated the Industrial Gas Sensors Market, capturing 32% of the total revenue. This significant share highlights the escalating demand for gas sensors across various industries, particularly in petrochemical, automotive, and healthcare sectors, where accurate monitoring of gas concentrations is critical for ensuring safety and adhering to regulatory standards. To meet this diverse demand, companies are actively investing in product development. For instance, Siemens has launched advanced gas monitoring solutions that integrate seamlessly with their building automation systems, significantly enhancing energy efficiency and safety in commercial applications. Additionally, Honeywell has introduced innovative gas sensor technologies equipped with wireless connectivity and IoT integration, allowing for real-time monitoring and predictive maintenance in industrial environments. Moreover, manufacturers like Dräger and MSA Safety are focusing on the development of portable gas detection devices designed for emergency response and confined space applications, emphasizing user-friendly interfaces and robust data logging capabilities. As industries increasingly prioritize safety and environmental compliance, the need for cutting-edge gas sensing solutions is expected to grow, driving further advancements in product offerings and overall market growth within the industrial gas sensor sector.
REGIONAL ANALYSIS
Regional Analysis
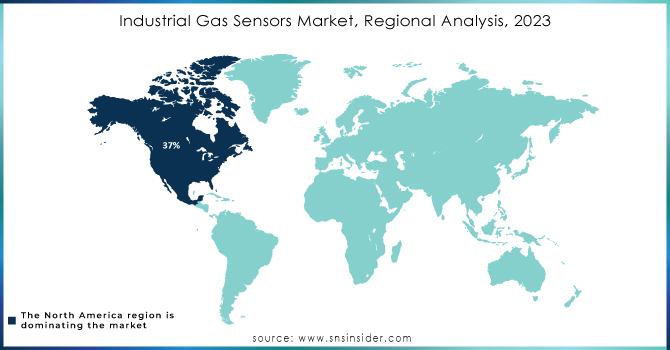
North America holds a dominant position in the Industrial Gas Sensor Market, accounting for 37% of the share in 2023. A robust industrial base, stringent safety regulations, and increasing awareness regarding environmental protection drive this leadership. The region's emphasis on workplace safety and compliance with health standards has propelled the demand for advanced gas sensing technologies across various sectors, including manufacturing, petrochemicals, and healthcare. Major companies are actively investing in product development and innovative solutions tailored for this market. For instance, Honeywell recently launched its Honeywell Analytics range of gas sensors, featuring improved sensitivity and integration capabilities, enabling real-time monitoring and data analysis. Siemens has also introduced cutting-edge gas detection solutions that support industrial automation and enhance safety protocols. Furthermore, Dräger has rolled out portable gas detection devices specifically designed for the North American market, focusing on user-friendliness and reliability in hazardous environments. The U.S. and Canada are witnessing significant advancements in the integration of IoT and AI technologies in gas monitoring systems, facilitating predictive maintenance and operational efficiency. With ongoing investments in infrastructure and the continuous expansion of industrial facilities, North America is poised for further growth in the industrial gas sensor market, ensuring enhanced safety standards and compliance with environmental regulations. This trend reflects the region's commitment to adopting innovative technologies that mitigate risks associated with gas leaks and emissions in various industrial applications.
Asia-Pacific is poised as the fastest-growing region in the Industrial Gas Sensor Market in 2023, driven by rapid industrialization, increasing urbanization, and stringent environmental regulations. Countries like China and India are leading this growth due to their expanding manufacturing sectors and a heightened focus on safety and pollution control. In China, the demand for advanced gas sensors is surging as industries strive to comply with government mandates aimed at reducing emissions and ensuring worker safety. Companies like Beijing Taiming Technology and Hubei Jiahua Gas Detection are introducing innovative gas sensor solutions tailored for hazardous environments, enhancing operational efficiency and safety protocols. In India, firms such as Acoem and Dwyer Instruments are launching new gas detection systems designed for industrial applications, addressing the need for real-time monitoring of toxic gases. For example, Acoem recently unveiled a new range of smart gas sensors that utilize IoT technology for enhanced connectivity and data analysis, enabling industries to better monitor and manage gas emissions. Additionally, advancements in MEMS (Micro-Electro-Mechanical Systems) technology are being integrated into gas sensors, offering improved accuracy and reduced maintenance needs.The overall growth in the Asia-Pacific region is further supported by government initiatives promoting clean energy and sustainable practices, which are expected to propel the adoption of industrial gas sensors across various sectors, including petrochemicals, manufacturing, and healthcare. As these developments unfold, Asia-Pacific is set to emerge as a key player in the global industrial gas sensor landscape.
KEY PLAYERS
Some of the Major players in Industrial Gas Sensor with Product and offering:
- City Technology Ltd. (e.g., 4-Series gas sensors for toxic and flammable gases)
- DENSO Europe B.V. (e.g., Air Quality Sensors for automotive and industrial applications)
- Bosch Sensortec GmbH (e.g., BME688 gas sensor for indoor air quality monitoring)
- Alphasense (e.g., SO2, CO, and NO2 sensors for environmental monitoring)
- Figaro Engineering Inc. (e.g., TGS Series gas sensors for detecting various gases)
- NGK Spark Plug (e.g., NGK Gas Sensors for automotive applications)
- Nemoto Sensor Engineering Co. Ltd. (e.g., NEMOTO-3 series for industrial gas detection)
- JJS Technical Services (e.g., Gas Analysis Solutions for industrial environments)
- Aeroqual Ltd. (e.g., Aeroqual Series 200/500 for air quality monitoring)
- Techcomp Group (e.g., Gas Chromatography Solutions for gas analysis)
- Honeywell Analytics (e.g., GasAlert Micro 5 for portable gas detection)
- Emerson Electric Co. (e.g., Rosemount 3000 Series for industrial gas sensing)
- Siemens AG (e.g., SITRANS gas analyzers for various applications)
- Thermo Fisher Scientific (e.g., Portable Gas Detection Instruments)
- Teledyne Gas and Flame Detection (e.g., OLCT100-XP-MS for flammable gas detection)
- Msa Safety Incorporated (e.g., ALTAIR 4X Multigas Detector)
- RKI Instruments Inc. (e.g., GX-6000 for VOC and combustible gas detection)
- Industrial Scientific Corporation (e.g., Ventis Pro5 Multigas Detector)
- Ametek (e.g., HMT370 for measuring moisture in gases)
- Sensirion AG (e.g., SGP30 gas sensor for air quality monitoring)
- Others
RECENT DEVELOPMENT
-
On January 16, 2024, Teledyne Gas and Flame Detection announced the launch of a new infrared (IR) sensor for its OLCT 100 XPIR fixed gas detector, enhancing stable and reliable methane detection measurements for industrial, utility, and laboratory markets, addressing the critical safety and environmental challenges posed by methane.
-
On January 13, 2023, RKI Instruments announced an extensive line of gas detection alarm systems for semiconductor manufacturing plants, featuring over 600 gas sensors developed in partnership with RIKEN KEIKI, including the GD-70D, which supports the detection of various gases and complies with TLV-TWA 5ppm COS.
| Report Attributes | Details |
|
Market Size in 2023 |
USD 1123.5 Million |
|
Market Size by 2032 |
USD 1997.1 Million |
|
CAGR |
CAGR of 6.6% From 2024 to 2032 |
|
Base Year |
2023 |
|
Forecast Period |
2024-2032 |
|
Historical Data |
2020-2022 |
|
Report Scope & Coverage |
Market Size, Segments Analysis, Competitive Landscape, Regional Analysis, DROC & SWOT Analysis, Forecast Outlook |
|
Market Drivers |
• Transforming the Detection of Combustible Gases with MEMS Technology • The Key Importance of Gas Sensors in Clean Energy during the Energy Transition Journey. |
|
Market Restraints |
• Facing difficulties in the industrial gas sensor market to tackle market limitations. |
Frequently Asked Questions
Industrial Gas Sensors Market is anticipated to expand by 6.6% from 2024 to 2032.
Ans: North America dominated the Industrial Gas Sensor Market in 2023.
Ans: The Oxygen segment dominated the Industrial Gas Sensor Market.
Ans: The major growth factor of the Industrial Gas Sensor Market is the increasing regulatory compliance and safety standards across various industries, driving the demand for advanced gas detection technologies.
Ans: The Industrial Gas Sensors Market size was valued at USD 1123.5 million in 2023 and is expected to grow to USD 1997.1 million by 2032
Get in Touch
