Get More Information on Intraoral Scanners Market - Request Sample Report
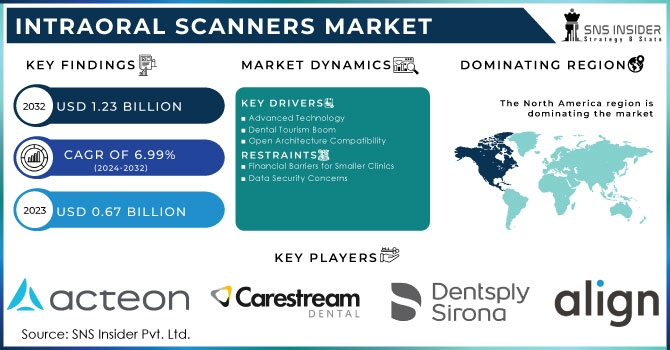
The Intraoral Scanners Market valued USD 0.67 billion in 2023, estimated to reach USD 1.23 Billion By 2032 with a CAGR of 6.99% over the forecast period 2024-2032.
Rising dental issues, growing oral health awareness, and the popularity of clear aligners and same-day dentistry, the demand for intraoral scanners is on the rise. This technology is further fueled by advancements in scanners themselves and the expanding dental tourism market. However, high costs associated with both the scanners and dental procedures remain a hurdle for even faster market growth.
The emergence of small, handheld scanners provides chairside solutions that are convenient for both dentists and patients. This mobility improves clinic efficiency and patient comfort. Portable scanners allow dentists to move between patients quickly, reducing downtime and potentially increasing revenue. Integration of Artificial Intelligence (AI) and Machine Learning (ML) into scanners automates complex tasks, improves diagnosis accuracy, and creates a data-driven approach to treatment planning. This positions dental practices at the forefront of technology and enhances their diagnostic capabilities. Manufacturers are focusing on features like VR distraction, real-time treatment visualizations, and user-friendly interfaces to improve the patient experience. This strategy increases patient satisfaction and portrays companies as innovative and patient-focused, potentially influencing purchasing decisions.
Companies like Neoss Group are responding to the demand for portability with the introduction of user-friendly wireless scanners like the NeoScan 2000.
DentalMonitoring's ScanAssist scanner exemplifies how AI is being incorporated to enhance the patient experience by providing real-time feedback and guided instructions.
These advancements suggest that the intraoral scanner supply chain is adapting to meet the growing demand for portability, AI integration, and patient-centric features.
Factors fueling intraoral scanner market growth with the increasing geriatric population is a major driver. As people age, their need for dental care, including crowns, bridges, and dentures, rises. Intraoral scanners streamline the process of creating precise dental restorations. The prevalence of dental diseases like dental caries means cavities is another significant factor. For example, a 2022 National Dental Epidemiology Program survey in England revealed a national prevalence of 29.3% among 5-year-old children with enamel and dentinal decay. This highlights the widespread need for improved dental care, and intraoral scanners offer a faster and more comfortable way to diagnose and treat such issues. Advancements in intraoral scanner technology itself are a major driver. These scanners eliminate the unpleasant experience of traditional dental impressions with messy materials. They also offer instant data transfer and manipulation, allowing for faster and more efficient treatment planning. This combination of improved patient experience and increased workflow efficiency is driving adoption across healthcare facilities.
The aging population is a major force propelling the intraoral scanner market forward. Older adults are more susceptible to dental issues due to reduced saliva production that is saliva plays a critical role in maintaining oral health. However, saliva production naturally declines with age, leading to a dry mouth environment. This increases the risk of cavities and gum disease. Changes in nutritional habits as people age can contribute to dental problems due to gum recession means as gums recede, tooth roots become exposed, making them more vulnerable to decay. This heightened susceptibility to dental problems creates a strong demand for improved dental care solutions. Intraoral scanners address this need by offering a faster, more comfortable, and more precise alternative to traditional impression methods.
For instance, a September 2023 report by the World Economic Forum highlights the rapid aging population in Japan, with over 10% exceeding 80 years old. Similarly, projections by the National Institute of Population and Social Security Research in Japan anticipate that by 2040, nearly 35% of the population will be 65 or older. This trend is mirrored globally, creating a positive correlation between the aging population and the rise in tooth loss and other dental ailments. This translates to a significant growth opportunity for the intraoral scanner market.
Drivers
Advanced Technology
There's a strong demand for scanners that are accurate, user-friendly, and integrate seamlessly with existing workflows. Firms that deliver on these aspects can capture a significant market share.
Dental Tourism Boom
The growing dental tourism market creates a strategic opportunity for manufacturers. Developing scanners that meet international compliance standards positions businesses to support clinics catering to international patients.
Open Architecture Compatibility
Easy integration with existing dental software ecosystems (CAD/CAM systems, practice management software) is crucial. Open-architecture scanners that seamlessly connect with various systems offer significant value to dental practices.
Training and Education
Providing comprehensive and engaging training programs for dental professionals is a strategic advantage. Businesses that invest in such programs empower practitioners to effectively utilize intraoral scanners and unlock their full potential.
Sustainability Focus
Manufacturers who develop eco-friendly scanners made from recyclable materials, with lower energy consumption and eco-friendly production techniques, align themselves with consumer preferences for sustainable products.
Rising Demand and Adapting Technology
Portability and Flexibility
Increased Revenue Potential
AI Integration
Patient-Centric Features
Restraints
Financial Barriers for Smaller Clinics
The high upfront costs associated with acquiring intraoral scanners, along with the additional software and training needs, can be a major obstacle for smaller dental clinics. This can hinder market penetration, especially in resource-constrained regions. These clinics may struggle to justify the initial investment, limiting the overall market reach of intraoral scanners.
Data Security Concerns
By Modality
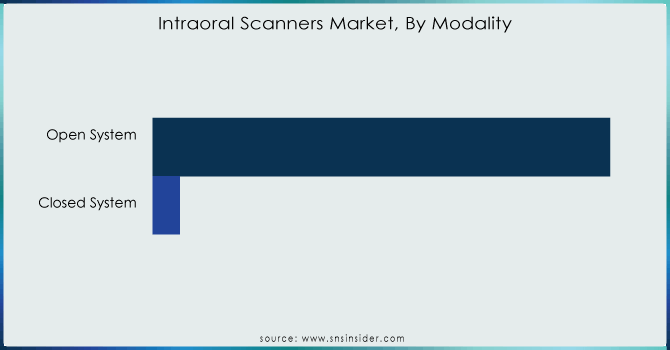
The intraoral scanner market is clearly dominated by open systems, held a staggering 97.3% share in 2023. Open systems liberate dentists from the constraints of vendor lock-in. Unlike closed systems tied to a single manufacturer, open systems allow for greater flexibility in choosing, replacing, or upgrading scanner components. This ensures dentists are not restricted by proprietary technologies and can adapt to their evolving needs.
The open architecture of these scanners makes them future-proof. As digital dentistry continues to evolve at a rapid pace, open systems allow dental clinics to effortlessly integrate new technologies. This eliminates the need for costly system replacements or major modifications, ensuring clinics stay competitive and their technology remains relevant in the long run.
Need any customization research on Intraoral Scanner Market - Enquiry Now
By End User:
Dental clinics represent a major force driven the intraoral scanner market, captured a significant 36.1% share in 2023. This dominance is fueled by key trends like dental offices are increasingly recognizing the importance of digital recordkeeping and regulatory compliance. Intraoral scanners play a crucial role in this shift by facilitating the secure and accurate storage of patient data, ensuring adherence to legal regulations and industry standards. By implementing these scanners, dental clinics can effectively manage and demonstrate compliance with data protection and healthcare requirements. Intraoral scanners also serve as a powerful tool for dental clinics to project a modern and technologically advanced image. As patients become more informed and selective, clinics equipped with advance technology like intraoral scanners gain a competitive advantage. This technological prowess can attract new patients and enhance the clinic's reputation within the community.
Regional Analysis
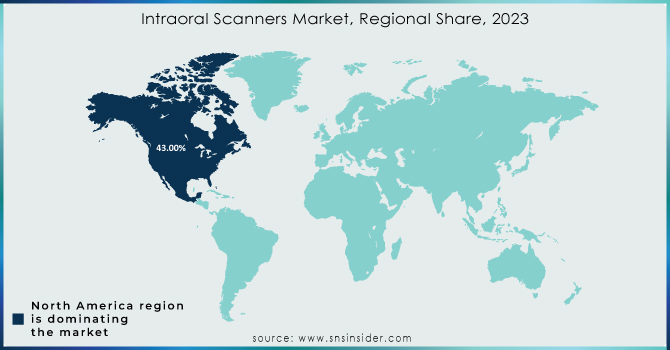
North America is poised for significant growth in the intraoral scanner market throughout the forecast period with 43% share in 2023. This dominance can be attributed to several key factors like the rising geriatric population is particularly susceptible to oral disorders like tooth decay. With age comes a higher likelihood of needing dental interventions due to tooth loss and decay. For example, a 2022 update by the National Institutes of Health (NIH) revealed that nearly 90% of American adults between 20 and 64 have experienced tooth decay in the past two years. Similarly, Canada's population statistics from the United Nations Population Fund in 2022 show that roughly 19% are aged 65 and above. These growing elderly population translates to an increasing burden of dental diseases, propelling the demand for intraoral scanners for early detection and treatment.
As the healthcare system in the United States continues to evolve and dental problems gain more recognition, people are increasingly seeking dental care. This trend is further amplified by initiatives like the collaborative Oral Health campaign launched by the American Diabetes Association (ADA) in October 2022. This campaign, partnered with Pacific Dental Services (PDS), aims to raise awareness about gum disease and empower patients with knowledge on prevention and management strategies. Such initiatives are likely to contribute to a rise in dental visits, ultimately driving market growth for intraoral scanners.
Favorable government reimbursement policies for dental procedures are another factor bolstering market growth. For instance, the Canadian government introduced the Canadian Dental Benefit in September 2022. This program offers financial aid with USD 260 – USD 650 per child under 12 to low-income families with annual income under USD 90,000 for dental care.
Leading players in the region are actively launching new and improved scanners. For example, Ori Dental introduced the Ori Intraoral Scanner in April 2023, designed to be faster, lighter, more accurate, and more affordable than traditional impression methods. This focus on innovation ensures that North American dental practices have access to the latest and most efficient technologies.
Acteon Group Ltd., Dentsply Sirona, Carestream Dental, Align Technology, DÜRR DENTAL SE, Hint-Els GmbH, 3Shape, Straumann Group, Smart Optics Sensortechnik GmbH, Planmeca Oy, DOF Inc., Dental Wings Inc., IOS Technologies, Inc., Roland DG Corporation, Condor Scan AG, Medit Corp., Zimmer Biomet Holdings, Inc., Ormco Corporation, Dental Corporation (Envista Holdings Corporation), Shining 3D Tech Co., Ltd. And others.
Recent Development
3Shape's new Trios 5 scanner in Sept. 2022 is a game-changer. This lightweight, wireless scanner offers easy handling and portability. Its ScanAssist tech and haptic feedback ensure accurate scans, while a built-in LED light promotes hygiene.
Report Attributes | Details |
---|---|
Market Size in 2023 | US$ 0.67 billion |
Market Size by 2032 | US$ 1.23 Billion |
CAGR | CAGR of 6.99% From 2024 to 2032 |
Base Year | 2023 |
Forecast Period | 2024-2032 |
Historical Data | 2020-2022 |
Report Scope & Coverage | Market Size, Segments Analysis, Competitive Landscape, Regional Analysis, DROC & SWOT Analysis, Forecast Outlook |
Key Segments | • By Product Type [Intraoral Scanners (Benchtop Intraoral Scanners, Stand-Alone CAD/CAM Scanners, 3D Handheld Scanners), Intraoral Cameras, Intraoral Sensors, Stand-Alone Software] • By Modality [Closed System, Open System] • By End User [Hospitals, Dental Clinics, Group Dental Practices, Ambulatory Surgical Centres] |
Regional Analysis/Coverage | North America (US, Canada, Mexico), Europe (Eastern Europe [Poland, Romania, Hungary, Turkey, Rest of Eastern Europe] Western Europe] Germany, France, UK, Italy, Spain, Netherlands, Switzerland, Austria, Rest of Western Europe]), Asia Pacific (China, India, Japan, South Korea, Vietnam, Singapore, Australia, Rest of Asia Pacific), Middle East & Africa (Middle East [UAE, Egypt, Saudi Arabia, Qatar, Rest of Middle East], Africa [Nigeria, South Africa, Rest of Africa], Latin America (Brazil, Argentina, Colombia, Rest of Latin America) |
Company Profiles | Acteon Group Ltd., Dentsply Sirona, Carestream Dental, Align Technology, DÜRR DENTAL SE, Hint-Els GmbH, 3Shape, Straumann Group, Smart Optics Sensortechnik GmbH, Planmeca Oy, DOF Inc., Dental Wings Inc., IOS Technologies, Inc., Roland DG Corporation, Condor Scan AG, Medit Corp., Zimmer Biomet Holdings, Inc., Ormco Corporation, Dental Corporation (Envista Holdings Corporation), Shining 3D Tech Co., Ltd. And others. |
Key Drivers | • Advanced Technology • Dental Tourism Boom • Open Architecture Compatibility • Training and Education • Sustainability Focus • Rising Demand and Adapting Technology • Portability and Flexibility • Increased Revenue Potential • AI Integration • Patient-Centric Features |
Restraints | • Financial Barriers for Smaller Clinics • Data Security Concerns |
Ans: The estimated compound annual growth rate is 6.99% during the forecast period for the Intraoral Scanners market.
Ans: The projected market value of the Intraoral Scanners market is estimated USD 0.67 billion in 2023 and expected to reach USD 1.23 billion by 2032.
Ans: Open architecture compatibility is one of the drivers of the Intraoral Scanners market.
Ans: Financial barriers for smaller clinics hampers the market growth which is one of the restraints of the Intraoral Scanners market.
Ans: North America is the dominating region with 43% market share in the Intraoral Scanners market.
TABLE OF CONTENTS
1. Introduction
1.1 Market Definition
1.2 Scope
1.3 Research Assumptions
2. Industry Flowchart
3. Research Methodology
4. Market Dynamics
4.1 Drivers
4.2 Restraints
4.3 Opportunities
4.4 Challenges
5. Porter’s 5 Forces Model
6. Pest Analysis
7. Intraoral Scanners Market Segmentation, by Product Type
7.1 Introduction
7.2 Intraoral Scanners
7.2.1 Benchtop Intraoral Scanners
7.2.2 Stand-Alone CAD/CAM Scanners
7.2.3 3D Handheld Scanners
7.3 Intraoral Cameras
7.4 Intraoral Sensors
7.5 Stand-Alone Software
8. Intraoral Scanners Market Segmentation, by Modality
8.1 Introduction
8.2 Closed System
8.3 Open System
9. Intraoral Scanners Market Segmentation, by End User
9.1 Introduction
9.2 Hospitals
9.3 Dental Clinics
9.4 Group Dental Practices
9.5 Ambulatory Surgical Centres
10. Regional Analysis
10.1 Introduction
10.2 North America
10.2.1 Trend Analysis
10.2.2 North America Intraoral Scanners Market by Country
10.2.3 North America Intraoral Scanners Market by Product Type
10.2.4 North America Intraoral Scanners Market by Modality
10.2.5 North America Intraoral Scanners Market by End User
10.2.6 USA
10.2.6.1 USA Intraoral Scanners Market by Product Type
10.2.6.2 USA Intraoral Scanners Market by Modality
10.2.6.3 USA Intraoral Scanners Market by End User
10.2.7 Canada
10.2.7.1 Canada Intraoral Scanners Market by Product Type
10.2.7.2 Canada Intraoral Scanners Market by Modality
10.2.7.3 Canada Intraoral Scanners Market by End User
10.2.8 Mexico
10.2.8.1 Mexico Intraoral Scanners Market by Product Type
10.2.8.2 Mexico Intraoral Scanners Market by Modality
10.2.8.3 Mexico Intraoral Scanners Market by End User
10.3 Europe
10.3.1 Trend Analysis
10.3.2 Eastern Europe
10.3.2.1 Eastern Europe Intraoral Scanners Market by Country
10.3.2.2 Eastern Europe Intraoral Scanners Market by Product Type
10.3.2.3 Eastern Europe Intraoral Scanners Market by Modality
10.3.2.4 Eastern Europe Intraoral Scanners Market by End User
10.3.2.5 Poland
10.3.2.5.1 Poland Intraoral Scanners Market by Product Type
10.3.2.5.2 Poland Intraoral Scanners Market by Modality
10.3.2.5.3 Poland Intraoral Scanners Market by End User
10.3.2.6 Romania
10.3.2.6.1 Romania Intraoral Scanners Market by Product Type
10.3.2.6.2 Romania Intraoral Scanners Market by Modality
10.3.2.6.4 Romania Intraoral Scanners Market by End User
10.3.2.7 Hungary
10.3.2.7.1 Hungary Intraoral Scanners Market by Product Type
10.3.2.7.2 Hungary Intraoral Scanners Market by Modality
10.3.2.7.3 Hungary Intraoral Scanners Market by End User
10.3.2.8 Turkey
10.3.2.8.1 Turkey Intraoral Scanners Market by Product Type
10.3.2.8.2 Turkey Intraoral Scanners Market by Modality
10.3.2.8.3 Turkey Intraoral Scanners Market by End User
10.3.2.9 Rest of Eastern Europe
10.3.2.9.1 Rest of Eastern Europe Intraoral Scanners Market by Product Type
10.3.2.9.2 Rest of Eastern Europe Intraoral Scanners Market by Modality
10.3.2.9.3 Rest of Eastern Europe Intraoral Scanners Market by End User
10.3.3 Western Europe
10.3.3.1 Western Europe Intraoral Scanners Market by Country
10.3.3.2 Western Europe Intraoral Scanners Market by Product Type
10.3.3.3 Western Europe Intraoral Scanners Market by Modality
10.3.3.4 Western Europe Intraoral Scanners Market by End User
10.3.3.5 Germany
10.3.3.5.1 Germany Intraoral Scanners Market by Product Type
10.3.3.5.2 Germany Intraoral Scanners Market by Modality
10.3.3.5.3 Germany Intraoral Scanners Market by End User
10.3.3.6 France
10.3.3.6.1 France Intraoral Scanners Market by Product Type
10.3.3.6.2 France Intraoral Scanners Market by Modality
10.3.3.6.3 France Intraoral Scanners Market by End User
10.3.3.7 UK
10.3.3.7.1 UK Intraoral Scanners Market by Product Type
10.3.3.7.2 UK Intraoral Scanners Market by Modality
10.3.3.7.3 UK Intraoral Scanners Market by End User
10.3.3.8 Italy
10.3.3.8.1 Italy Intraoral Scanners Market by Product Type
10.3.3.8.2 Italy Intraoral Scanners Market by Modality
10.3.3.8.3 Italy Intraoral Scanners Market by End User
10.3.3.9 Spain
10.3.3.9.1 Spain Intraoral Scanners Market by Product Type
10.3.3.9.2 Spain Intraoral Scanners Market by Modality
10.3.3.9.3 Spain Intraoral Scanners Market by End User
10.3.3.10 Netherlands
10.3.3.10.1 Netherlands Intraoral Scanners Market by Product Type
10.3.3.10.2 Netherlands Intraoral Scanners Market by Modality
10.3.3.10.3 Netherlands Intraoral Scanners Market by End User
10.3.3.11 Switzerland
10.3.3.11.1 Switzerland Intraoral Scanners Market by Product Type
10.3.3.11.2 Switzerland Intraoral Scanners Market by Modality
10.3.3.11.3 Switzerland Intraoral Scanners Market by End User
10.3.3.12 Austria
10.3.3.12.1 Austria Intraoral Scanners Market by Product Type
10.3.3.12.2 Austria Intraoral Scanners Market by Modality
10.3.3.12.3 Austria Intraoral Scanners Market by End User
10.3.3.13 Rest of Western Europe
10.3.3.13.1 Rest of Western Europe Intraoral Scanners Market by Product Type
10.3.3.13.2 Rest of Western Europe Intraoral Scanners Market by Modality
10.3.3.13.3 Rest of Western Europe Intraoral Scanners Market by End User
10.4 Asia-Pacific
10.4.1 Trend Analysis
10.4.2 Asia-Pacific Intraoral Scanners Market by Country
10.4.3 Asia-Pacific Intraoral Scanners Market by Product Type
10.4.4 Asia-Pacific Intraoral Scanners Market by Modality
10.4.5 Asia-Pacific Intraoral Scanners Market by End User
10.4.6 China
10.4.6.1 China Intraoral Scanners Market by Product Type
10.4.6.2 China Intraoral Scanners Market by Modality
10.4.6.3 China Intraoral Scanners Market by End User
10.4.7 India
10.4.7.1 India Intraoral Scanners Market by Product Type
10.4.7.2 India Intraoral Scanners Market by Modality
10.4.7.3 India Intraoral Scanners Market by End User
10.4.8 Japan
10.4.8.1 Japan Intraoral Scanners Market by Product Type
10.4.8.2 Japan Intraoral Scanners Market by Modality
10.4.8.3 Japan Intraoral Scanners Market by End User
10.4.9 South Korea
10.4.9.1 South Korea Intraoral Scanners Market by Product Type
10.4.9.2 South Korea Intraoral Scanners Market by Modality
10.4.9.3 South Korea Intraoral Scanners Market by End User
10.4.10 Vietnam
10.4.10.1 Vietnam Intraoral Scanners Market by Product Type
10.4.10.2 Vietnam Intraoral Scanners Market by Modality
10.4.10.3 Vietnam Intraoral Scanners Market by End User
10.4.11 Singapore
10.4.11.1 Singapore Intraoral Scanners Market by Product Type
10.4.11.2 Singapore Intraoral Scanners Market by Modality
10.4.11.3 Singapore Intraoral Scanners Market by End User
10.4.12 Australia
10.4.12.1 Australia Intraoral Scanners Market by Product Type
10.4.12.2 Australia Intraoral Scanners Market by Modality
10.4.12.3 Australia Intraoral Scanners Market by End User
10.4.13 Rest of Asia-Pacific
10.4.13.1 Rest of Asia-Pacific Intraoral Scanners Market by Product Type
10.4.13.2 Rest of Asia-Pacific Intraoral Scanners Market by Modality
10.4.13.3 Rest of Asia-Pacific Intraoral Scanners Market by End User
10.5 Middle East & Africa
10.5.1 Trend Analysis
10.5.2 Middle East
10.5.2.1 Middle East Intraoral Scanners Market by Country
10.5.2.2 Middle East Intraoral Scanners Market by Product Type
10.5.2.3 Middle East Intraoral Scanners Market by Modality
10.5.2.4 Middle East Intraoral Scanners Market by End User
10.5.2.5 UAE
10.5.2.5.1 UAE Intraoral Scanners Market by Product Type
10.5.2.5.2 UAE Intraoral Scanners Market by Modality
10.5.2.5.3 UAE Intraoral Scanners Market by End User
10.5.2.6 Egypt
10.5.2.6.1 Egypt Intraoral Scanners Market by Product Type
10.5.2.6.2 Egypt Intraoral Scanners Market by Modality
10.5.2.6.3 Egypt Intraoral Scanners Market by End User
10.5.2.7 Saudi Arabia
10.5.2.7.1 Saudi Arabia Intraoral Scanners Market by Product Type
10.5.2.7.2 Saudi Arabia Intraoral Scanners Market by Modality
10.5.2.7.3 Saudi Arabia Intraoral Scanners Market by End User
10.5.2.8 Qatar
10.5.2.8.1 Qatar Intraoral Scanners Market by Product Type
10.5.2.8.2 Qatar Intraoral Scanners Market by Modality
10.5.2.8.3 Qatar Intraoral Scanners Market by End User
10.5.2.9 Rest of Middle East
10.5.2.9.1 Rest of Middle East Intraoral Scanners Market by Product Type
10.5.2.9.2 Rest of Middle East Intraoral Scanners Market by Modality
10.5.2.9.3 Rest of Middle East Intraoral Scanners Market by End User
10.5.3 Africa
10.5.3.1 Africa Intraoral Scanners Market by Country
10.5.3.2 Africa Intraoral Scanners Market by Product Type
10.5.3.3 Africa Intraoral Scanners Market by Modality
10.5.3.4 Africa Intraoral Scanners Market by End User
10.5.3.5 Nigeria
10.5.3.5.1 Nigeria Intraoral Scanners Market by Product Type
10.5.3.5.2 Nigeria Intraoral Scanners Market by Modality
10.5.3.5.3 Nigeria Intraoral Scanners Market by End User
10.5.3.6 South Africa
10.5.3.6.1 South Africa Intraoral Scanners Market by Product Type
10.5.3.6.2 South Africa Intraoral Scanners Market by Modality
10.5.3.6.3 South Africa Intraoral Scanners Market by End User
10.5.3.7 Rest of Africa
10.5.3.7.1 Rest of Africa Intraoral Scanners Market by Product Type
10.5.3.7.2 Rest of Africa Intraoral Scanners Market by Modality
10.5.3.7.3 Rest of Africa Intraoral Scanners Market by End User
10.6 Latin America
10.6.1 Trend Analysis
10.6.2 Latin America Intraoral Scanners Market by country
10.6.3 Latin America Intraoral Scanners Market by Product Type
10.6.4 Latin America Intraoral Scanners Market by Modality
10.6.5 Latin America Intraoral Scanners Market by End User
10.6.6 Brazil
10.6.6.1 Brazil Intraoral Scanners Market by Product Type
10.6.6.2 Brazil Intraoral Scanners Market by Modality
10.6.6.3 Brazil Intraoral Scanners Market by End User
10.6.7 Argentina
10.6.7.1 Argentina Intraoral Scanners Market by Product Type
10.6.7.2 Argentina Intraoral Scanners Market by Modality
10.6.7.3 Argentina Intraoral Scanners Market by End User
10.6.8 Colombia
10.6.8.1 Colombia Intraoral Scanners Market by Product Type
10.6.8.2 Colombia Intraoral Scanners Market by Modality
10.6.8.3 Colombia Intraoral Scanners Market by End User
10.6.9 Rest of Latin America
10.6.9.1 Rest of Latin America Intraoral Scanners Market by Product Type
10.6.9.2 Rest of Latin America Intraoral Scanners Market by Modality
10.6.9.3 Rest of Latin America Intraoral Scanners Market by End User
11. Company Profiles
11.1 Acteon Group Ltd.
11.1.1 Company Overview
11.1.2 Financial
11.1.3 Products/ Services Offered
11.1.4 The SNS View
11.2 Dentsply Sirona
11.2.1 Company Overview
11.2.2 Financial
11.2.3 Products/ Services Offered
11.2.4 The SNS View
11.3 Carestream Dental
11.3.1 Company Overview
11.3.2 Financial
11.3.3 Products/ Services Offered
11.3.4 The SNS View
11.4 Align Technology
11.4.1 Company Overview
11.4.2 Financial
11.4.3 Products/ Services Offered
11.4.4 The SNS View
11.5 DÜRR DENTAL SE
11.5.1 Company Overview
11.5.2 Financial
11.5.3 Products/ Services Offered
11.5.4 The SNS View
11.6 Hint-Els GmbH
11.6.1 Company Overview
11.6.2 Financial
11.6.3 Products/ Services Offered
11.6.4 The SNS View
11.7 3Shape
11.7.1 Company Overview
11.7.2 Financial
11.7.3 Products/ Services Offered
11.7.4 The SNS View
11.8 Straumann Group
11.8.1 Company Overview
11.8.2 Financial
11.8.3 Products/ Services Offered
11.8.4 The SNS View
11.9 Smart Optics Sensortechnik GmbH
11.9.1 Company Overview
11.9.2 Financial
11.9.3 Products/ Services Offered
11.9.4 The SNS View
11.10 Planmeca Oy
11.10.1 Company Overview
11.10.2 Financial
11.10.3 Products/ Services Offered
11.10.4 The SNS View
12. Competitive Landscape
12.1 Competitive Benchmarking
12.2 Market Share Analysis
12.3 Recent Developments
12.3.1 Industry News
12.3.2 Company News
12.3.3 Mergers & Acquisitions
13. Use Case and Best Practices
14. Conclusion
An accurate research report requires proper strategizing as well as implementation. There are multiple factors involved in the completion of good and accurate research report and selecting the best methodology to compete the research is the toughest part. Since the research reports we provide play a crucial role in any company’s decision-making process, therefore we at SNS Insider always believe that we should choose the best method which gives us results closer to reality. This allows us to reach at a stage wherein we can provide our clients best and accurate investment to output ratio.
Each report that we prepare takes a timeframe of 350-400 business hours for production. Starting from the selection of titles through a couple of in-depth brain storming session to the final QC process before uploading our titles on our website we dedicate around 350 working hours. The titles are selected based on their current market cap and the foreseen CAGR and growth.
The 5 steps process:
Step 1: Secondary Research:
Secondary Research or Desk Research is as the name suggests is a research process wherein, we collect data through the readily available information. In this process we use various paid and unpaid databases which our team has access to and gather data through the same. This includes examining of listed companies’ annual reports, Journals, SEC filling etc. Apart from this our team has access to various associations across the globe across different industries. Lastly, we have exchange relationships with various university as well as individual libraries.
Step 2: Primary Research
When we talk about primary research, it is a type of study in which the researchers collect relevant data samples directly, rather than relying on previously collected data. This type of research is focused on gaining content specific facts that can be sued to solve specific problems. Since the collected data is fresh and first hand therefore it makes the study more accurate and genuine.
We at SNS Insider have divided Primary Research into 2 parts.
Part 1 wherein we interview the KOLs of major players as well as the upcoming ones across various geographic regions. This allows us to have their view over the market scenario and acts as an important tool to come closer to the accurate market numbers. As many as 45 paid and unpaid primary interviews are taken from both the demand and supply side of the industry to make sure we land at an accurate judgement and analysis of the market.
This step involves the triangulation of data wherein our team analyses the interview transcripts, online survey responses and observation of on filed participants. The below mentioned chart should give a better understanding of the part 1 of the primary interview.
Part 2: In this part of primary research the data collected via secondary research and the part 1 of the primary research is validated with the interviews from individual consultants and subject matter experts.
Consultants are those set of people who have at least 12 years of experience and expertise within the industry whereas Subject Matter Experts are those with at least 15 years of experience behind their back within the same space. The data with the help of two main processes i.e., FGDs (Focused Group Discussions) and IDs (Individual Discussions). This gives us a 3rd party nonbiased primary view of the market scenario making it a more dependable one while collation of the data pointers.
Step 3: Data Bank Validation
Once all the information is collected via primary and secondary sources, we run that information for data validation. At our intelligence centre our research heads track a lot of information related to the market which includes the quarterly reports, the daily stock prices, and other relevant information. Our data bank server gets updated every fortnight and that is how the information which we collected using our primary and secondary information is revalidated in real time.
Step 4: QA/QC Process
After all the data collection and validation our team does a final level of quality check and quality assurance to get rid of any unwanted or undesired mistakes. This might include but not limited to getting rid of the any typos, duplication of numbers or missing of any important information. The people involved in this process include technical content writers, research heads and graphics people. Once this process is completed the title gets uploader on our platform for our clients to read it.
Step 5: Final QC/QA Process:
This is the last process and comes when the client has ordered the study. In this process a final QA/QC is done before the study is emailed to the client. Since we believe in giving our clients a good experience of our research studies, therefore, to make sure that we do not lack at our end in any way humanly possible we do a final round of quality check and then dispatch the study to the client.
Key Segments:
By Product Type:
Intraoral Scanners
Benchtop Intraoral Scanners
Stand-Alone CAD/CAM Scanners
3D Handheld Scanners
Intraoral Cameras
Intraoral Sensors
Stand-Alone Software
By Modality:
Closed System
Open System
By End User:
Hospitals
Dental Clinics
Group Dental Practices
Ambulatory Surgical Centres
Request for Segment Customization as per your Business Requirement: Segment Customization Request
Regional Coverage:
North America
US
Canada
Mexico
Europe
Eastern Europe
Poland
Romania
Hungary
Turkey
Rest of Eastern Europe
Western Europe
Germany
France
UK
Italy
Spain
Netherlands
Switzerland
Austria
Rest of Western Europe
Asia Pacific
China
India
Japan
South Korea
Vietnam
Singapore
Australia
Rest of Asia Pacific
Middle East & Africa
Middle East
UAE
Egypt
Saudi Arabia
Qatar
Rest of Middle East
Africa
Nigeria
South Africa
Rest of Africa
Latin America
Brazil
Argentina
Colombia
Rest of Latin America
Request for Country Level Research Report: Country Level Customization Request
Available Customization
With the given market data, SNS Insider offers customization as per the company’s specific needs. The following customization options are available for the report:
Product Analysis
Criss-Cross segment analysis (e.g. Product X Application)
Product Matrix which gives a detailed comparison of product portfolio of each company
Geographic Analysis
Additional countries in any of the regions
Company Information
Detailed analysis and profiling of additional market players (Up to five)
The Antibody Production Market size was estimated at USD 14.33 billion in 2023 and is expected to reach USD 36.49 billion by 2032 at a CAGR of 10.95% during the forecast period of 2024-2032.
The Positron Emission Tomography (PET) Market size was estimated at USD 2.6 billion in 2023 and is expected to reach USD 4.35 billion by 2032 with a growing CAGR of 5.9% during the forecast period of 2024-2032.
The Sequencing Market Size was valued at USD 13.0 Billion in 2023, and is expected to reach USD 47.29 Billion by 2032, and grow at a CAGR of 15.40% Over the forecast period of 2024-2032.
The Microcarriers Market size was estimated at USD 1.52 billion in 2023 and is expected to reach USD 4.11 billion by 2032 at a CAGR of 11.7% during the forecast period of 2024-2032.
The Microtome Market size was estimated at USD 428.0 Million in 2022 and is expected to reach USD 724.4 Million by 2030 with a growing CAGR of 6.8% over the forecast period of 2023 to 2030.
The Low-Pressure Liquid Chromatography Market Size was valued at USD 7.25 billion in 2023 and is expected to reach USD 13.72 billion by 2032 and grow at a CAGR of 7.36% over the forecast period 2024-2032.
Hi! Click one of our member below to chat on Phone