Isobutyric Acid Market Report Scope & Overview:
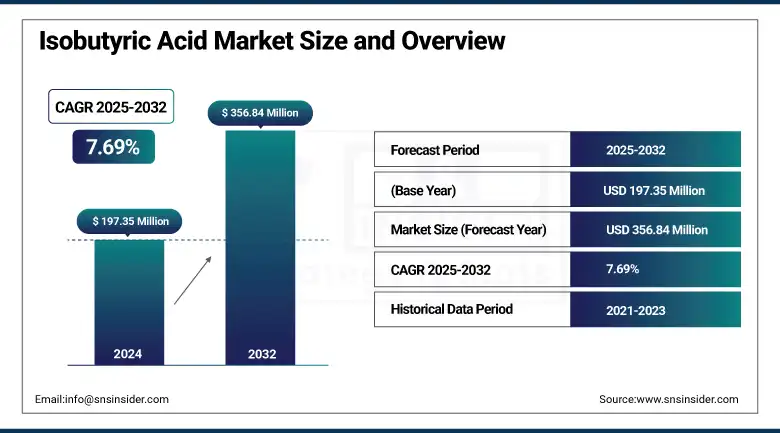
The Isobutyric Acid Market size was valued at USD 197.35 million in 2024 and is expected to reach USD 356.84 million by 2032, growing at a CAGR of 7.69% over the forecast period of 2025-2032.
Increasing use of isobutyric acid for pharmaceutical applications such as the synthesis of active pharmaceutical ingredients (APIs) used in the treatment of cardiology and neurology sectors is expected to boost the growth of the isobutyric acid market during the forecast period. As bio-based production methods become more prevalent, as seen in the technology AFYREN uses for its fermentation processes, it should support market growth trends while focusing on sustainability. OQ Chemicals GmbH and Dow Inc. are playing key roles in the growth of isobutyric acid capacity, which has been rising steadily in North America due to the increased demand for isobutyric acid in specialty chemicals.
To Get more information On Isobutyric Acid Market - Request Free Sample Report
The 2024 report from Evonik indicates a 3.8% increase in specialty acids revenues, led by pharmaceutical-grade isobutyric acid. AFYREN started its sales of bio-based acids in commercial quantities, including isobutyric acid, as of 2024. The safety guidelines by the International Labour Organization also mention handling guidelines for isobutyric acid operations in North America. This convergence with clean-tech solutions and their growing commercial use in pharmaceuticals suggests the future direction of the market.
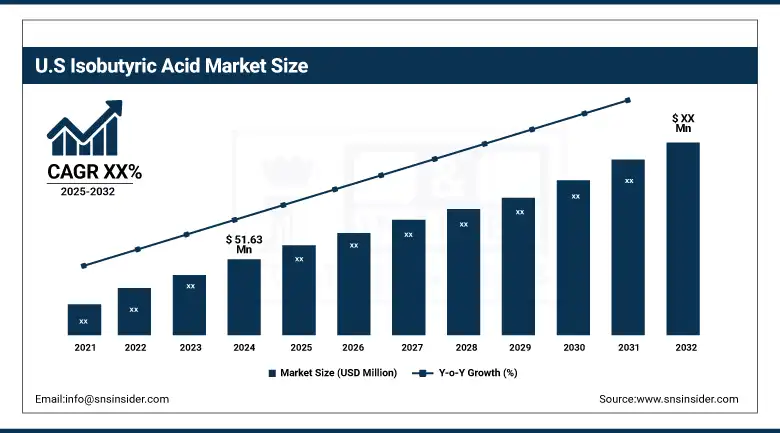
The U.S. leads the market with a value of USD 51.63 million and a market share of around 77% in 2024 and this due to the companies like Eastman Chemical and regulatory standards put in place by the F.D.A. Acidifiers are used in Canada for livestock health (Agriculture and Agri-Food Canada programs).
Isobutyric Acid Market Dynamics
Drivers
-
Expansion of Bio-Based Production Facilities Enhances Isobutyric Acid Market Growth
Bio-based production units have been gaining momentum and are adding momentum to the isobutyric acid market. For example, France’s AFYREN NEOXY has started production of bio-acids, including isobutyric acid, non-stop in a factory in France using new fermentation technology. This progress not just satisfies the rising demand for green chemicals, but is also in line with the world's environmental goals. Location of the plant and short supply chains make it even more efficient and competitive. These developments highlight the transition in the market towards more sustainable production techniques and serve to further accelerate the growth of the Isobutyric Acid Market.
-
Rising Demand for Pharmaceutical-Grade Isobutyric Acid Fuels Market Expansion
Growing usage of pharmaceutical-grade isobutyric acid in developing active pharmaceutical ingredients (APIs) is driving the isobutyric acid market. Evonik, for example, has revealed significant growth for its Specialty Additives division, which it has partially credited to the increase in demand for high-purity isobutyric acid for pharmaceutical uses. This is a reflection of the vital role of the compound in medication, particularly in cardiology and neurology drugs. Sustained demand from the pharmaceutical industry will drive the isobutyric acid market, proving it to be an emphatic product in the chemical space.
Restraints
-
Fluctuating Raw Material Prices Affect Isobutyric Acid Market Stability
The fluctuation in the prices of raw materials, especially petrochemical-based, has a severe impact on the market for isobutyric acid. Variations in the cost of the feedstocks, such as propylene, translate to production costs and hence unstable pricing for isobutyric acid. This kind of instability discourages investment and can make long-term planning more difficult both for makers and for buyers. The dependence on finite resources highlights the necessity for alternative green feedstocks to circumvent this limitation.
-
Limited Awareness and Adoption in Emerging Economies Hinder Market Growth
Low awareness of isobutyric acid applications and its usage in emerging economies is also a major factor hampering the market growth. The potential of its application as a pharmaceutical agent, flavour, and a specialty product-chemical is not understood, leading to its underutilization. Moreover, inadequate infrastructural and investment facilities for chemical manufacturing in these areas have been restricting the market growth. This constraint can be overcome through focused attention to education, infrastructure, and policy mechanisms to stimulate the potential of the isobutyric acid market in these regions.
Isobutyric Acid Market Segment Analysis
By Type
Synthetic isobutyric acid is the dominant product type, accounting for 68.5% of the overall market in 2024 on account of its superior quality, stable supply chain, and relatively low manufacturing cost. It is commonly used in pharmaceutical and chemical industries due to its controllable properties and reproducibility. Synthetic isobutyric acid production capacity is being expanded by companies such as Eastman Chemical and Tokyo Chemical Industry in response to growing global demand. Regulatory support of the same industrial-grade materials also helps maintain dominance.
The renewable segment is the fastest-growing due to the rising demand for sustainable chemicals. At a CAGR of 8.99%, it is growing in food and feed applications due to bio-based, natural additives. Bio-isobutyric acid production by companies like METabolic EXplorer or Geno (formerly Genomatica) illustrates the move toward sustainable chemical production. Regulatory pressure to clamp down on petrochemical consumption is aiding this trend, particularly in Europe.
By End-use
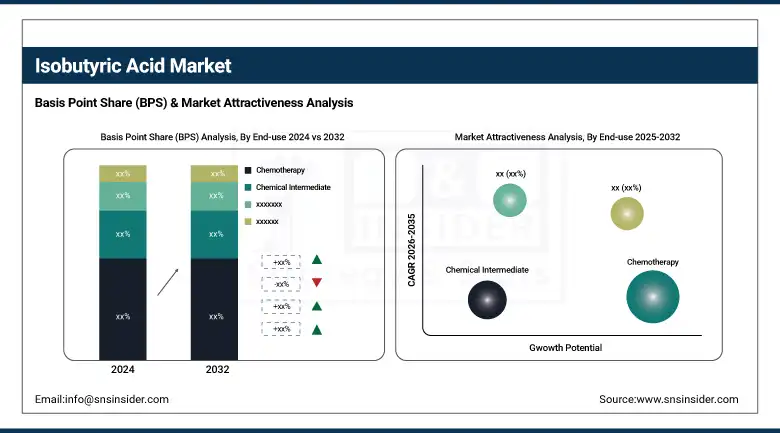
The pharmaceutical application dominates with a market share of 31.6% in the isobutyric acid market, as pharmaceutical grade isobutyric acid is widely utilized in the direct production of active pharmaceutical ingredients and drug intermediates. Evonik and BASF have expanded their production of high-purity isobutyric acid for regulated uses. This trend is dominated by North America, with the large volume of materials and high quality and consistency of input materials, which is required under FDA-regulated drug manufacturing.
The animal feed segment holds the largest market share at CAGR 8.77%, driven by growing meat consumption and the recognition of the importance of gut health for livestock. Isobutyric acid emerges as a novel additive for improving digestion and immunity in animals. Safe, organic feed additives receive support from the U.S. Department of Agriculture (USDA), contributing to fast growth in this subsegment across North America and Europe.
Isobutyric Acid Market Regional Outlook
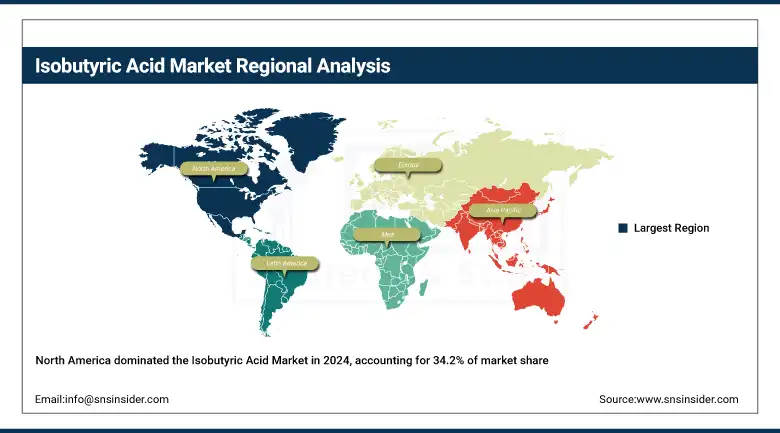
The North America region dominated the isobutyric acid market and accounted for the highest share of 34.2%, as the regional market is dominated by pharmaceuticals and animal feed. Strong consumption of high pharmaceutical grade isobutyric acid and well well-established industrial base make the region a leader, supported by a sustainability perspective through the American Chemistry Council and growing demand for synthetic intermediates and butyric acid derivatives.
Get Customized Report as per Your Business Requirement - Enquiry Now
Europe holds a 27.4% market share in the isobutyric acid market, due to eco regulations and pharmaceutical development. Germany and France are steering, with technical support from ECHA, UBA, and ANSES, working on sustainable solvent use and food-grade additives. REACH compliance drives the demand for environmentally friendly chemicals. Adoption of the pharmaceutical-grade isobutyric acid in Western Europe is increasing owing to sophisticated R&D methodologies, and flavor & preservatives segments in the region are progressing in a health-first economy. And Western Europe continues to hold a prominent market position in the global butyric acid market.
Isobutyric Acid Market in the Asia Pacific region is growing at a high CAGR of 9.37% to reach USD 44.46 million by 2021 to 2028. In China, the rising competition in the Asia-Pacific market is an unfavorable factor for China’s domestic isobutyric acid production scale is large, the market is fiercely competitive. Backing from China's MEE and India's DoP drives eco-solvent and API expansions. Japan propels food-grade demand with its aging population. Industrialization, growing animal husbandry, and agro-based sectors are some stimulating factors helping to drive the growth of the market for isobutyric acid. Asia Pacific dominated the isobutyric acid market and is projected to grow at the highest CAGR among other regions in the global isobutyric acid market.
Share across the Latin American isobutyric acid market is attributed to increasing demand for livestock feed additives in Brazil, supported by the Country’s Ministry of Agriculture. In Brazil, we are ahead in applications in animal health using isobutyric acid for gut health. Mexico regulates flavoring substances in food safety programs and also flavoring food preservatives. Although low production but increasing imports and usages in agro-based and food industries account for the regional Isobutyric Acid Market Trends and growth. The regional growth is expected to progress with increasing health-related reformation and growing use of feed acidifiers.
The Middle East & Africa are growing gradually in the isobutyric acid market, driven by diversification efforts and industrial policy. Saudi Arabia supports local production under Vision 2030, while South Africa enhances additive demand via IPAP. GPCA promotes chemical innovation, fueling demand in food-grade and pharmaceutical-grade isobutyric acid. Though the base is smaller, strong investments and rising health, food, and pharma applications are stimulating the isobutyric acid market Growth in the region’s evolving chemical manufacturing landscape.
Key Players
The major competitors in the isobutyric acid market include Eastman Chemical Company, OQ Chemicals GmbH, Dow Inc., Evonik Industries AG, AFYREN, Jiangsu Dynamic Chemical Co., Ltd., Tokyo Chemical Industry Co., Ltd., Weifang Qiyi Chemical Co., Ltd., Shanghai Aladdin Biochemical Technology Co., Ltd. and Hubei Jusheng Technology Co., Ltd.
Recent Developments
-
May 2023: Safic-Alcan and Eastman expanded their distribution partnership in Europe, focusing on Eastman's anhydrides, including isobutyric acid, to enhance offerings in flavors, pharmaceuticals, and agrochemicals.
| Report Attributes | Details |
|---|---|
| Market Size in 2024 | USD 197.35 million |
| Market Size by 2032 | USD 356.84 million |
| CAGR | CAGR of 7.69% From 2025 to 2032 |
| Base Year | 2024 |
| Forecast Period | 2025-2032 |
| Historical Data | 2021-2023 |
| Report Scope & Coverage | Market Size, Segments Analysis, Competitive Landscape, Regional Analysis, DROC & SWOT Analysis, Forecast Outlook |
| Key Segments | •By Type (Synthetic, Renewable) •By End-use (Animal Feed, Food & Flavor, Chemical Intermediate, Pharmaceutical, Others) |
| Regional Analysis/Coverage | North America (US, Canada, Mexico), Europe (Germany, France, UK, Italy, Spain, Poland, Turkey, Rest of Europe), Asia Pacific (China, India, Japan, South Korea, Singapore, Australia, Rest of Asia Pacific), Middle East & Africa (UAE, Saudi Arabia, Qatar, South Africa, Rest of Middle East & Africa), Latin America (Brazil, Argentina, Rest of Latin America) |
| Company Profiles | Eastman Chemical Company, OQ Chemicals GmbH, Dow Inc., Evonik Industries AG, AFYREN, Jiangsu Dynamic Chemical Co., Ltd., Tokyo Chemical Industry Co., Ltd., Weifang Qiyi Chemical Co., Ltd., Shanghai Aladdin Biochemical Technology Co., Ltd., Hubei Jusheng Technology Co., Ltd. |
Frequently Asked Questions
The isobutyric acid market is driven by the increasing demand for pharmaceutical-grade isobutyric acid, bio-based production methods, and key investments by companies like OQ Chemicals GmbH and Dow Inc.
Bio-based production, like AFYREN’s fermentation technology, boosts sustainability and market growth, meeting increasing demand for eco-friendly and high-purity isobutyric acid in various industries.
Synthetic Isobutyric Acid dominates the market with a 68.5% share, driven by its cost-effectiveness, stable supply chain, and wide adoption in pharmaceuticals and chemical industries.
The renewable segment is the fastest-growing, with a CAGR of 8.99%, as demand for eco-friendly, bio-based chemicals increases, particularly in food, feed, and specialty applications.
North America leads the Isobutyric Acid Market with a 34.2% share, driven by high demand in pharmaceuticals and animal feed, supported by strong regulatory frameworks and key players like Eastman Chemical.
Get in Touch
