Get E-PDF Sample Report on Marine Lubricants Market - Request Sample Report
The Marine Lubricants Market Size was valued at USD 6.5 Billion in 2023 and is expected to reach USD 7.8 Billion by 2032 and grow at a CAGR of 2.07% over the forecast period 2024-2032.
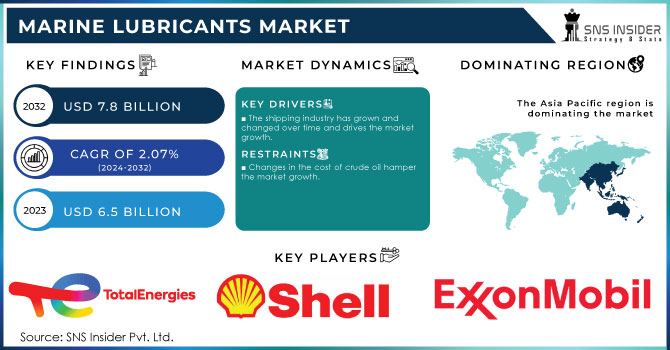
Marine Lubricant is a high-performance oil that breaks down easily and is used to protect marine equipment and make engines run more efficiently. The marine lubricants market is mostly driven by new technologies to reduce emissions, the growth of maritime tourism, and improvements to infrastructure that are making the shipping industry stronger.
But the growing demand for bio-based marine lubricants gives the companies that make them a chance to grow. In terms of value, Asia Pacific is the most important market for marine lubricants around the world. It is also the area where the marine lubricants market is growing the fastest.
Marine lubricants are becoming increasingly more interested in using synthetic products due to their efficient applications under high pressure and intense heating and cooling conditions. As a result, such lubricants provide high wear and corrosion protection, ensuring extended equipment service life and reduced maintenance costs for both military and commercial vessels. In 2023, ExxonMobil developed and commercially launched its new synthetic marine lubricant, and particularly Mobilgard 540 AC. The products have been engineered to improve engine performance and fuel combustion and it compliant with the International Maritime Organization 2023 requirements.
This lubricant is characterized by high thermal stability and oxidation resistance, which is critical in modern engines as they begin to operate under environmentally stringent performance standards. Furthermore, the new product extends ExxonMobil’s lineup of modern advanced marine lubricants. Shell Alexia 140 lubricant introduces their position on the trends in ship fuels as now LNG-based fuels are used by some ships and require new synthetical lubricants.
The marine lubricants industry is under pressure to comply with the principles of sustainability and the circular economy, which will minimize the environmental impact. For that reason, many lubricant manufacturers aim to reduce the amount of waste generated during their production and distribution, by producing more recyclable and reusable means of packaging. For instance, Castrol and TotalEnergies have undertaken several sustainable packaging initiatives and now make their lubricants available in environmentally friendly containers and refillable systems that eliminate the use of virtually any disposable plastics. Furthermore, the idea of a circular economy applies to production as well, so manufacturers attempt to reduce energy consumption, reuse industrial by-products, and incorporate recycled materials in their formulations.
The European Green Deal, for instance, aims to make shipping more sustainable by 2050, encouraging the adoption of environmentally acceptable lubricants (EALs) and promoting practices that support waste reduction in the supply chain.
Market Dynamics:
Drivers
The shipping industry has grown and changed over time and drives the market growth.
The emergence of the shipping sector, initially a common means of transportation, has experienced a series of transformations that have steered the development of the marine lubricants market. Noteworthy, emerging globalization, dependence on international trade, as well as technological advancements, have played a vital role in raising the growth of the sector. With the global maritime trade continuing to grow, predominantly in regions of Asia-Pacific, the use of advanced high-quality performance lubricants required for numerous superior fleets has increased. The developments were apparent in 2022 when Maersk announced the inclusion of 12 large container vessels powered by methanol. Such announcements are associated with the increased need for innovative lubricants that will be able to operate diverse fuel types and support efficient engines. Additionally, Cargill was not left behind and began its first shipment that was fuelled by biofuel.
In line with the United Nations Conference on Trade and Development, future global maritime trade volumes will present annual growth of 2.4% through 2030. This means that the number of ships and, hence, the demand for marine lubricants will continue to increase. Moreover, governmental regulations and initiatives such as the IMO 2020 specifying the necessity to reduce sulfur emissions in maritime fuel have facilitated the emergence of new types of marine lubricants that can comply both with performance and environmental standards. Thus, due to the ongoing regulatory and technological shifts, the shipping industry has changed in a significant way and the market for marine lubricants has experienced considerable growth and innovation.
Restrain
The primary factor hindering the growth of the marine lubricants market is the fluctuation of crude oil cost. Since crude oil is regarded the primary raw product in the manufacturing of lubricants, its market price largely impacts oil cost prices. Therefore, if the cost of crude oil grows, the cost price of producing and refining lubricants grows as well; such a situation implies that the end consumers in the maritime field receive the products at elevated prices. In some instances, the fuel and lubricant needs of shipping companies are high, thus the operation budget might be strained. As a result, lubricant production manufacturers may witness more delays in fleet maintenance since they cannot afford the expensive resupply and lubricants. Alternatively, companies may seek cheaper alternatives thus declining the lucrative demand for premium marine lubricants. Moreover, crude oil cost fluctuations also impact lubricant production manufacturers since the volatility can impact the uncertainties of suppliers’ markets.
Using industryal lubricants could make the time between drains longer.
Market segmentation
By Oil Type
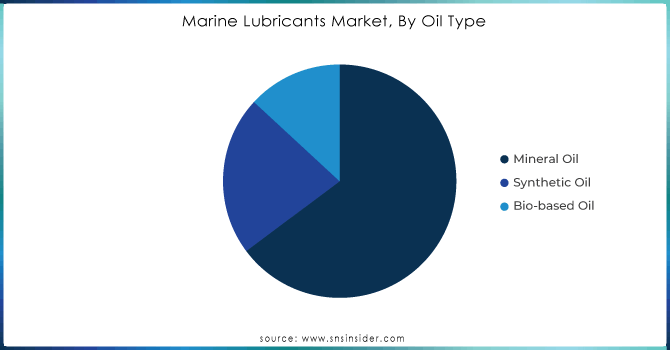
Mineral Oil is projected that the mineral oil had the biggest share of around 42.95% in 2023. This is because they are widely available, cost-effective, and have been used for different gradients in maritime access. Furthermore, mineral oils are derived from refined crude oil, making them relatively cheaper than their synthetic and bio-based counterparts. Additionally, most shipping companies, especially those with a high number of fleets, use mineral oil because it is a relatively affordable and convenient range of brands. They are also commonly used in the maritime industry, given that they have a longer history of a variety of marine engines and equipment, proofing them of their dominant percentage.
Get Customized Report as per your Business Requirement - Request For Customized Report
By Product Type
The engine oil market share is around 48.23% in 2023. it is essential for maintaining the performance and longevity of marine engines, which are critical to the operation of any vessel. Large ships and vessels have relatively High temperatures, filthy loads, the biggest running hours, and other conditions that prove that engine oil will always be needed. Engine oils prevent friction, corrosion, and wear and tear, and engines run smoothly and with arguable performance with no trouble. Furthermore, with the introduction of new and flagship vessel types, engines must have more power and deliver more performance, therefore advanced engine oils are developed which are especially good with lower-sulfur fuels, and due to IMO 2020, sulfur cap use of such type of engine oil is even strongly recommended.
By Ship Type
Bulk carriers held the largest market share around 39.54% in 2023. This dominance is largely due to their significant presence in global maritime trade and their high engine and machinery usage. As bulk carriers are responsible for transporting large volumes of commodities like coal, grain, iron ore, and other raw materials, they are some of the most frequently utilized vessels in the shipping industry. This intensive use, often on long voyages across international waters, requires continuous maintenance and lubrication of their engines, hydraulics, and other critical machinery to ensure efficient operation and prevent breakdowns. As a result, bulk carriers account for a substantial share of the demand for marine lubricants.
Regional Analysis:
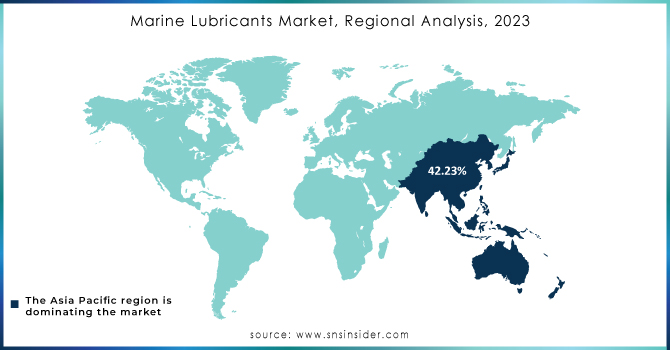
Asia Pacific held the largest market share around 42.23% in 2023. The marine industries in China, India, and Singapore are expected to continue on a healthy growth path over the forecast period, which is expected to drive the consumption of marine lubricants in the region. Many industries are opening their manufacturing units in Asia Pacific due to the availability of cheap labor and raw materials in the region. This is expected to provide a huge push to the market in Asia Pacific. Also, the region has been experiencing a significant rise in investments made into the manufacturing sector, mainly due to the increasing trade activities that are happening in China. As aforementioned China is playing a major role in the consumption of products as well as the production of these products. The Singapore shipping sector is largely based on Singapore’s core business of container. Singapore aims to expand its port to become a premier global hub port and an international maritime centre over the forecast period. Also, to make sure that Singapore retains its edge in terms of quality, the Maritime and Port Authority are also involved in the promotion of maritime R&D in off-shore and marine engineering, port, and shipping.
ExxonMobil Corporation (Mobilgard 540 AC, Mobil SHC Aware, Mobilgard ADL)
Shell plc (Shell Alexia 140, Shell Argina)
TotalEnergies SE (Talusia Universal, Total Carter XEP)
Chevron (Clarity Synthetic EA Gear Oil, Delo 400, Taro Ultra Advanced)
BP plc (Castrol Cyltech, Castrol Hyspin AWH)
Royal Dutch Shell plc (Shell Mysella, Shell Corena)
LUKOIL Marine Lubricants (NAVIGO MCL, LUKOIL OLOA 48001)
Lubmarine (Total Group) (Talusia Universal, Lubmarine 340)
PetroChina Company Limited (Kunlun Marine Oil, Kunlun Hydraulic Oil, Kunlun Cylinder Oil)
FUCHS Petrolub SE (RENOLIN MR, TITAN MARINE, FUCHS Renolin HVI)
Gulf Oil Marine Ltd. (GulfSea Cylcare EHP, GulfSea Superbear, GulfSea Hydra)
Indian Oil Corporation Ltd. (Servo Marine 707, Servo Cylinder 400, Servo Steerol EP)
China Petrochemical Corporation (Sinopec) (Sinopec Marine Cylinder Oil 50100, Sinopec Marine Gear Oil, Sinopec Tulux T700)
BP Marine (Energol Cyltech, BP Vanellus, BP Transcal N)
Valvoline Inc. (Valvoline Premium Blue, Valvoline All Fleet, Valvoline Marine Pro)
JXTG Nippon Oil & Energy Corporation (ENEOS Marine, , ENEOS Gear Oil)
SK Lubricants Co. Ltd. (ZIC Marine, SK Solvent Marine, SK Enersave Marine)
Repsol S.A. (Repsol Marine Cylinder Oil, Repsol Nautico, Repsol Marine Synth)
Klüber Lubrication (Klüberbio RM, Klüberplex BEM, Klüberbio AG 39-602)
BASF SE (BASF Irganox, BASF Irgafos, BASF Synthetic Ester-based Oils)
Recent Development:
2023: TotalEnergies launched Talusia Optima; a new marine cylinder oil designed to meet the requirements of engines operating on low-sulfur fuels. This product aims to enhance engine performance and compliance with IMO 2020 regulations.
2023: Idemitsu introduced Idemitsu Marine HDX, a new high-definition marine lubricant that provides superior protection and performance for a wide range of marine engines and operational conditions.
Report Attributes | Details |
---|---|
Market Size in 2023 | US$ 6.5 Billion |
Market Size by 2032 | US$ 7.8 Billion |
CAGR | CAGR of 2.07% From 2024 to 2032 |
Base Year | 2023 |
Forecast Period | 2024-2032 |
Historical Data | 2020-2022 |
Report Scope & Coverage | Market Size, Segments Analysis, Competitive Landscape, Regional Analysis, DROC & SWOT Analysis, Forecast Outlook |
Key Segments | • By Oil type (Mineral Oil, Synthetic Oil, Bio-based Oil) • By Product Type (Engine Oil, Hydraulic Fluid, Compressor Oil, Others) • By Ship type (Bulk Carriers, Tankers, Container Ships, Others) |
Regional Analysis/Coverage | North America (US, Canada, Mexico), Europe (Eastern Europe [Poland, Romania, Hungary, Turkey, Rest of Eastern Europe] Western Europe] Germany, France, UK, Italy, Spain, Netherlands, Switzerland, Austria, Rest of Western Europe]), Asia Pacific (China, India, Japan, South Korea, Vietnam, Singapore, Australia, Rest of Asia Pacific), Middle East & Africa (Middle East [UAE, Egypt, Saudi Arabia, Qatar, Rest of Middle East], Africa [Nigeria, South Africa, Rest of Africa], Latin America (Brazil, Argentina, Colombia, Rest of Latin America) |
Company Profiles | Castrol, Lubmarine (Total Group), Sinopec Corporation, Lukoil Marine Lubricants., Gulf Marine and Industrial Supplies Inc., Quepet Lubricants, Chevron, ExxonMobil Corporation, BP Marine, Royal Dutch Shell Plc, JX Nippon Oil & Energy Corporation, and Other players |
DRIVERS | • The shipping industry has grown and changed over time and drives the market growth. • New technologies to reduce emissions |
Restraints | • Using synthetic lubricants could make the time between drains longer. • Changes in the cost of crude oil hamper the market growth. |
Ans: Primary or secondary type of research done by this reports.
Ans: Manufacturers, Consultant, aftermarket players, association, Research institute, private and universities libraries, suppliers and distributors of the product.
Ans: Almost every part of the world has been affected by the pandemic. Because of problems in the global supply chain and a drop in oil prices, the marine lubricants market has grown less than it should have. This is happening because demand from the marine sector has dropped. The marine industries are very important to the market. In terms of value, the marine lubricants market is worth the most in Asia Pacific.
Ans: Using synthetic lubricants could make the time between drains longer and Changes in the cost of crude oil are the restraints forMarine Lubricants Market.
Ans: Marine Lubricants Market Size was valued at USD 6.5 billion in 2023 and is expected to reach USD 7.8 billion by 2032 and grow at a CAGR of 2.07% over the forecast period 2024-2032.
1. Introduction
1.1 Market Definition
1.2 Scope (Inclusion and Exclusions)
1.3 Research Assumptions
2. Executive Summary
2.1 Market Overview
2.2 Regional Synopsis
2.3 Competitive Summary
3. Research Methodology
3.1 Top-Down Approach
3.2 Bottom-up Approach
3.3. Data Validation
3.4 Primary Interviews
4. Market Dynamics Impact Analysis
4.1 Market Driving Factors Analysis
4.1.1 Drivers
4.1.2 Restraints
4.1.3 Opportunities
4.1.4 Challenges
4.2 PESTLE Analysis
4.3 Porter’s Five Forces Model
5. Statistical Insights and Trends Reporting
5.1 Production Capacity and Utilization, by Country, by Type, 2023
5.2 Feedstock Prices, by Country, by Type, 2023
5.3 Regulatory Impact, by Country, by Type, 2023.
5.4 Environmental Metrics: Emissions Data, Waste Management Practices, and Sustainability Initiatives, by Region
5.5 Innovation and R&D, by Type, 2023
6. Competitive Landscape
6.1 List of Major Companies, By Region
6.2 Market Share Analysis, By Region
6.3 Product Benchmarking
6.3.1 Product specifications and features
6.3.2 Pricing
6.4 Strategic Initiatives
6.4.1 Marketing and promotional activities
6.4.2 Distribution and Supply Chain Strategies
6.4.3 Expansion plans and new product launches
6.4.4 Strategic partnerships and collaborations
6.5 Technological Advancements
6.6 Market Positioning and Branding
7. Marine Lubricants Market Segmentation, by Oil Type
7.1 Chapter Overview
7.2 Mineral Oil
7.2.1 Mineral Oil Market Trends Analysis (2020-2032)
7.2.2 Mineral Oil Market Size Estimates and Forecasts to 2032 (USD Billion)
7.3 Synthetic Oil
7.3.1 Synthetic Oil Market Trends Analysis (2020-2032)
7.3.2 Synthetic Oil Market Size Estimates and Forecasts to 2032 (USD Billion)
7.4 Bio-based Oil
7.4.1 Bio-based Oil Market Trends Analysis (2020-2032)
7.4.2 Bio-based Oil Market Size Estimates and Forecasts to 2032 (USD Billion)
8. Marine Lubricants Market Segmentation, by Product Type
8.1 Chapter Overview
8.2 Engine Oil
8.2.1 Engine Oil Market Trends Analysis (2020-2032)
8.2.2 Engine Oil Market Size Estimates and Forecasts to 2032 (USD Billion)
8.3 Hydraulic Fluid
8.3.1 Hydraulic Fluid Market Trends Analysis (2020-2032)
8.3.2 Hydraulic Fluid Market Size Estimates and Forecasts to 2032 (USD Billion)
8.4 Compressor Oil
8.4.1 Compressor Oil Market Trends Analysis (2020-2032)
8.4.2 Compressor Oil Market Size Estimates and Forecasts to 2032 (USD Billion)
8.5 Photoresists
8.5.1 Photoresists Market Trends Analysis (2020-2032)
8.5.2 Photoresists Market Size Estimates and Forecasts to 2032 (USD Billion)
8.6 Others
8.6.1 Others Market Trends Analysis (2020-2032)
8.6.2 Others Market Size Estimates and Forecasts to 2032 (USD Billion)
9. Marine Lubricants Market Segmentation, by Ship Type
9.1 Chapter Overview
9.2 Bulk Carriers
9.2.1 Bulk Carriers Market Trends Analysis (2020-2032)
9.2.2 Bulk Carriers Market Size Estimates and Forecasts to 2032 (USD Billion)
9.3 Tankers
9.3.1 Tankers Market Trends Analysis (2020-2032)
9.3.2 Tankers Market Size Estimates and Forecasts to 2032 (USD Billion)
9.4 Container Ships
9.4.1 Container Ships Market Trends Analysis (2020-2032)
9.4. Container Ships Market Size Estimates and Forecasts to 2032 (USD Billion)
9.5 Others
9.5.1 Others Market Trends Analysis (2020-2032)
9.5.2 Others Market Size Estimates and Forecasts to 2032 (USD Billion)
10. Regional Analysis
10.1 Chapter Overview
10.2 North America
10.2.1 Trends Analysis
10.2.2 North America Marine Lubricants Market Estimates and Forecasts, by Country (2020-2032) (USD Billion)
10.2.3 North America Marine Lubricants Market Estimates and Forecasts, by Oil Type (2020-2032) (USD Billion)
10.2.4 North America Marine Lubricants Market Estimates and Forecasts, by Product Type (2020-2032) (USD Billion)
10.2.5 North America Marine Lubricants Market Estimates and Forecasts, by Ship Type (2020-2032) (USD Billion)
10.2.6 USA
10.2.6.1 USA Marine Lubricants Market Estimates and Forecasts, by Oil Type (2020-2032) (USD Billion)
10.2.6.2 USA Marine Lubricants Market Estimates and Forecasts, by Product Type (2020-2032) (USD Billion)
10.2.6.3 USA Marine Lubricants Market Estimates and Forecasts, by Ship Type (2020-2032) (USD Billion)
10.2.7 Canada
10.2.7.1 Canada Marine Lubricants Market Estimates and Forecasts, by Oil Type (2020-2032) (USD Billion)
10.2.7.2 Canada Marine Lubricants Market Estimates and Forecasts, by Product Type (2020-2032) (USD Billion)
10.2.7.3 Canada Marine Lubricants Market Estimates and Forecasts, by Ship Type (2020-2032) (USD Billion)
10.2.8 Mexico
10.2.8.1 Mexico Marine Lubricants Market Estimates and Forecasts, by Oil Type (2020-2032) (USD Billion)
10.2.8.2 Mexico Marine Lubricants Market Estimates and Forecasts, by Product Type (2020-2032) (USD Billion)
10.2.8.3 Mexico Marine Lubricants Market Estimates and Forecasts, by Ship Type (2020-2032) (USD Billion)
10.3 Europe
10.3.1 Eastern Europe
10.3.1.1 Trends Analysis
10.3.1.2 Eastern Europe Marine Lubricants Market Estimates and Forecasts, by Country (2020-2032) (USD Billion)
10.3.1.3 Eastern Europe Marine Lubricants Market Estimates and Forecasts, by Oil Type (2020-2032) (USD Billion)
10.3.1.4 Eastern Europe Marine Lubricants Market Estimates and Forecasts, by Product Type (2020-2032) (USD Billion)
10.3.1.5 Eastern Europe Marine Lubricants Market Estimates and Forecasts, by Ship Type (2020-2032) (USD Billion)
10.3.1.6 Poland
10.3.1.6.1 Poland Marine Lubricants Market Estimates and Forecasts, by Oil Type (2020-2032) (USD Billion)
10.3.1.6.2 Poland Marine Lubricants Market Estimates and Forecasts, by Product Type (2020-2032) (USD Billion)
10.3.1.6.3 Poland Marine Lubricants Market Estimates and Forecasts, by Ship Type (2020-2032) (USD Billion)
10.3.1.7 Romania
10.3.1.7.1 Romania Marine Lubricants Market Estimates and Forecasts, by Oil Type (2020-2032) (USD Billion)
10.3.1.7.2 Romania Marine Lubricants Market Estimates and Forecasts, by Product Type (2020-2032) (USD Billion)
10.3.1.7.3 Romania Marine Lubricants Market Estimates and Forecasts, by Ship Type (2020-2032) (USD Billion)
10.3.1.8 Hungary
10.3.1.8.1 Hungary Marine Lubricants Market Estimates and Forecasts, by Oil Type (2020-2032) (USD Billion)
10.3.1.8.2 Hungary Marine Lubricants Market Estimates and Forecasts, by Product Type (2020-2032) (USD Billion)
10.3.1.8.3 Hungary Marine Lubricants Market Estimates and Forecasts, by Ship Type (2020-2032) (USD Billion)
10.3.1.9 Turkey
10.3.1.9.1 Turkey Marine Lubricants Market Estimates and Forecasts, by Oil Type (2020-2032) (USD Billion)
10.3.1.9.2 Turkey Marine Lubricants Market Estimates and Forecasts, by Product Type (2020-2032) (USD Billion)
10.3.1.9.3 Turkey Marine Lubricants Market Estimates and Forecasts, by Ship Type (2020-2032) (USD Billion)
10.3.1.10 Rest of Eastern Europe
10.3.1.10.1 Rest of Eastern Europe Marine Lubricants Market Estimates and Forecasts, by Oil Type (2020-2032) (USD Billion)
10.3.1.10.2 Rest of Eastern Europe Marine Lubricants Market Estimates and Forecasts, by Product Type (2020-2032) (USD Billion)
10.3.1.10.3 Rest of Eastern Europe Marine Lubricants Market Estimates and Forecasts, by Ship Type (2020-2032) (USD Billion)
10.3.2 Western Europe
10.3.2.1 Trends Analysis
10.3.2.2 Western Europe Marine Lubricants Market Estimates and Forecasts, by Country (2020-2032) (USD Billion)
10.3.2.3 Western Europe Marine Lubricants Market Estimates and Forecasts, by Oil Type (2020-2032) (USD Billion)
10.3.2.4 Western Europe Marine Lubricants Market Estimates and Forecasts, by Product Type (2020-2032) (USD Billion)
10.3.2.5 Western Europe Marine Lubricants Market Estimates and Forecasts, by Ship Type (2020-2032) (USD Billion)
10.3.2.6 Germany
10.3.2.6.1 Germany Marine Lubricants Market Estimates and Forecasts, by Oil Type (2020-2032) (USD Billion)
10.3.2.6.2 Germany Marine Lubricants Market Estimates and Forecasts, by Product Type (2020-2032) (USD Billion)
10.3.2.6.3 Germany Marine Lubricants Market Estimates and Forecasts, by Ship Type (2020-2032) (USD Billion)
10.3.2.7 France
10.3.2.7.1 France Marine Lubricants Market Estimates and Forecasts, by Oil Type (2020-2032) (USD Billion)
10.3.2.7.2 France Marine Lubricants Market Estimates and Forecasts, by Product Type (2020-2032) (USD Billion)
10.3.2.7.3 France Marine Lubricants Market Estimates and Forecasts, by Ship Type (2020-2032) (USD Billion)
10.3.2.8 UK
10.3.2.8.1 UK Marine Lubricants Market Estimates and Forecasts, by Oil Type (2020-2032) (USD Billion)
10.3.2.8.2 UK Marine Lubricants Market Estimates and Forecasts, by Product Type (2020-2032) (USD Billion)
10.3.2.8.3 UK Marine Lubricants Market Estimates and Forecasts, by Ship Type (2020-2032) (USD Billion)
10.3.2.9 Italy
10.3.2.9.1 Italy Marine Lubricants Market Estimates and Forecasts, by Oil Type (2020-2032) (USD Billion)
10.3.2.9.2 Italy Marine Lubricants Market Estimates and Forecasts, by Product Type (2020-2032) (USD Billion)
10.3.2.9.3 Italy Marine Lubricants Market Estimates and Forecasts, by Ship Type (2020-2032) (USD Billion)
10.3.2.10 Spain
10.3.2.10.1 Spain Marine Lubricants Market Estimates and Forecasts, by Oil Type (2020-2032) (USD Billion)
10.3.2.10.2 Spain Marine Lubricants Market Estimates and Forecasts, by Product Type (2020-2032) (USD Billion)
10.3.2.10.3 Spain Marine Lubricants Market Estimates and Forecasts, by Ship Type (2020-2032) (USD Billion)
10.3.2.11 Netherlands
10.3.2.11.1 Netherlands Marine Lubricants Market Estimates and Forecasts, by Oil Type (2020-2032) (USD Billion)
10.3.2.11.2 Netherlands Marine Lubricants Market Estimates and Forecasts, by Product Type (2020-2032) (USD Billion)
10.3.2.11.3 Netherlands Marine Lubricants Market Estimates and Forecasts, by Ship Type (2020-2032) (USD Billion)
10.3.2.12 Switzerland
10.3.2.12.1 Switzerland Marine Lubricants Market Estimates and Forecasts, by Oil Type (2020-2032) (USD Billion)
10.3.2.12.2 Switzerland Marine Lubricants Market Estimates and Forecasts, by Product Type (2020-2032) (USD Billion)
10.3.2.12.3 Switzerland Marine Lubricants Market Estimates and Forecasts, by Ship Type (2020-2032) (USD Billion)
10.3.2.13 Austria
10.3.2.13.1 Austria Marine Lubricants Market Estimates and Forecasts, by Oil Type (2020-2032) (USD Billion)
10.3.2.13.2 Austria Marine Lubricants Market Estimates and Forecasts, by Product Type (2020-2032) (USD Billion)
10.3.2.13.3 Austria Marine Lubricants Market Estimates and Forecasts, by Ship Type (2020-2032) (USD Billion)
10.3.2.14 Rest of Western Europe
10.3.2.14.1 Rest of Western Europe Marine Lubricants Market Estimates and Forecasts, by Oil Type (2020-2032) (USD Billion)
10.3.2.14.2 Rest of Western Europe Marine Lubricants Market Estimates and Forecasts, by Product Type (2020-2032) (USD Billion)
10.3.2.14.3 Rest of Western Europe Marine Lubricants Market Estimates and Forecasts, by Ship Type (2020-2032) (USD Billion)
10.4 Asia Pacific
10.4.1 Trends Analysis
10.4.2 Asia Pacific Marine Lubricants Market Estimates and Forecasts, by Country (2020-2032) (USD Billion)
10.4.3 Asia Pacific Marine Lubricants Market Estimates and Forecasts, by Oil Type (2020-2032) (USD Billion)
10.4.4 Asia Pacific Marine Lubricants Market Estimates and Forecasts, by Product Type (2020-2032) (USD Billion)
10.4.5 Asia Pacific Marine Lubricants Market Estimates and Forecasts, by Ship Type (2020-2032) (USD Billion)
10.4.6 China
10.4.6.1 China Marine Lubricants Market Estimates and Forecasts, by Oil Type (2020-2032) (USD Billion)
10.4.6.2 China Marine Lubricants Market Estimates and Forecasts, by Product Type (2020-2032) (USD Billion)
10.4.6.3 China Marine Lubricants Market Estimates and Forecasts, by Ship Type (2020-2032) (USD Billion)
10.4.7 India
10.4.7.1 India Marine Lubricants Market Estimates and Forecasts, by Oil Type (2020-2032) (USD Billion)
10.4.7.2 India Marine Lubricants Market Estimates and Forecasts, by Product Type (2020-2032) (USD Billion)
10.4.7.3 India Marine Lubricants Market Estimates and Forecasts, by Ship Type (2020-2032) (USD Billion)
10.4.8 Japan
10.4.8.1 Japan Marine Lubricants Market Estimates and Forecasts, by Oil Type (2020-2032) (USD Billion)
10.4.8.2 Japan Marine Lubricants Market Estimates and Forecasts, by Product Type (2020-2032) (USD Billion)
10.4.8.3 Japan Marine Lubricants Market Estimates and Forecasts, by Ship Type (2020-2032) (USD Billion)
10.4.9 South Korea
10.4.9.1 South Korea Marine Lubricants Market Estimates and Forecasts, by Oil Type (2020-2032) (USD Billion)
10.4.9.2 South Korea Marine Lubricants Market Estimates and Forecasts, by Product Type (2020-2032) (USD Billion)
10.4.9.3 South Korea Marine Lubricants Market Estimates and Forecasts, by Ship Type (2020-2032) (USD Billion)
10.4.10 Vietnam
10.4.10.1 Vietnam Marine Lubricants Market Estimates and Forecasts, by Oil Type (2020-2032) (USD Billion)
10.4.10.2 Vietnam Marine Lubricants Market Estimates and Forecasts, by Product Type (2020-2032) (USD Billion)
10.4.10.3 Vietnam Marine Lubricants Market Estimates and Forecasts, by Ship Type (2020-2032) (USD Billion)
10.4.11 Singapore
10.4.11.1 Singapore Marine Lubricants Market Estimates and Forecasts, by Oil Type (2020-2032) (USD Billion)
10.4.11.2 Singapore Marine Lubricants Market Estimates and Forecasts, by Product Type (2020-2032) (USD Billion)
10.4.11.3 Singapore Marine Lubricants Market Estimates and Forecasts, by Ship Type (2020-2032) (USD Billion)
10.4.12 Australia
10.4.12.1 Australia Marine Lubricants Market Estimates and Forecasts, by Oil Type (2020-2032) (USD Billion)
10.4.12.2 Australia Marine Lubricants Market Estimates and Forecasts, by Product Type (2020-2032) (USD Billion)
10.4.12.3 Australia Marine Lubricants Market Estimates and Forecasts, by Ship Type (2020-2032) (USD Billion)
10.4.13 Rest of Asia Pacific
10.4.13.1 Rest of Asia Pacific Marine Lubricants Market Estimates and Forecasts, by Oil Type (2020-2032) (USD Billion)
10.4.13.2 Rest of Asia Pacific Marine Lubricants Market Estimates and Forecasts, by Product Type (2020-2032) (USD Billion)
10.4.13.3 Rest of Asia Pacific Marine Lubricants Market Estimates and Forecasts, by Ship Type (2020-2032) (USD Billion)
10.5 Middle East and Africa
10.5.1 Middle East
10.5.1.1 Trends Analysis
10.5.1.2 Middle East Marine Lubricants Market Estimates and Forecasts, by Country (2020-2032) (USD Billion)
10.5.1.3 Middle East Marine Lubricants Market Estimates and Forecasts, by Oil Type (2020-2032) (USD Billion)
10.5.1.4 Middle East Marine Lubricants Market Estimates and Forecasts, by Product Type (2020-2032) (USD Billion)
10.5.1.5 Middle East Marine Lubricants Market Estimates and Forecasts, by Ship Type (2020-2032) (USD Billion)
10.5.1.6 UAE
10.5.1.6.1 UAE Marine Lubricants Market Estimates and Forecasts, by Oil Type (2020-2032) (USD Billion)
10.5.1.6.2 UAE Marine Lubricants Market Estimates and Forecasts, by Product Type (2020-2032) (USD Billion)
10.5.1.6.3 UAE Marine Lubricants Market Estimates and Forecasts, by Ship Type (2020-2032) (USD Billion)
10.5.1.7 Egypt
10.5.1.7.1 Egypt Marine Lubricants Market Estimates and Forecasts, by Oil Type (2020-2032) (USD Billion)
10.5.1.7.2 Egypt Marine Lubricants Market Estimates and Forecasts, by Product Type (2020-2032) (USD Billion)
10.5.1.7.3 Egypt Marine Lubricants Market Estimates and Forecasts, by Ship Type (2020-2032) (USD Billion)
10.5.1.8 Saudi Arabia
10.5.1.8.1 Saudi Arabia Marine Lubricants Market Estimates and Forecasts, by Oil Type (2020-2032) (USD Billion)
10.5.1.8.2 Saudi Arabia Marine Lubricants Market Estimates and Forecasts, by Product Type (2020-2032) (USD Billion)
10.5.1.8.3 Saudi Arabia Marine Lubricants Market Estimates and Forecasts, by Ship Type (2020-2032) (USD Billion)
10.5.1.9 Qatar
10.5.1.9.1 Qatar Marine Lubricants Market Estimates and Forecasts, by Oil Type (2020-2032) (USD Billion)
10.5.1.9.2 Qatar Marine Lubricants Market Estimates and Forecasts, by Product Type (2020-2032) (USD Billion)
10.5.1.9.3 Qatar Marine Lubricants Market Estimates and Forecasts, by Ship Type (2020-2032) (USD Billion)
10.5.1.10 Rest of Middle East
10.5.1.10.1 Rest of Middle East Marine Lubricants Market Estimates and Forecasts, by Oil Type (2020-2032) (USD Billion)
10.5.1.10.2 Rest of Middle East Marine Lubricants Market Estimates and Forecasts, by Product Type (2020-2032) (USD Billion)
10.5.1.10.3 Rest of Middle East Marine Lubricants Market Estimates and Forecasts, by Ship Type (2020-2032) (USD Billion)
10.5.2 Africa
10.5.2.1 Trends Analysis
10.5.2.2 Africa Marine Lubricants Market Estimates and Forecasts, by Country (2020-2032) (USD Billion)
10.5.2.3 Africa Marine Lubricants Market Estimates and Forecasts, by Oil Type (2020-2032) (USD Billion)
10.5.2.4 Africa Marine Lubricants Market Estimates and Forecasts, by Product Type (2020-2032) (USD Billion)
10.5.2.5 Africa Marine Lubricants Market Estimates and Forecasts, by Ship Type (2020-2032) (USD Billion)
10.5.2.6 South Africa
10.5.2.6.1 South Africa Marine Lubricants Market Estimates and Forecasts, by Oil Type (2020-2032) (USD Billion)
10.5.2.6.2 South Africa Marine Lubricants Market Estimates and Forecasts, by Product Type (2020-2032) (USD Billion)
10.5.2.6.3 South Africa Marine Lubricants Market Estimates and Forecasts, by Ship Type (2020-2032) (USD Billion)
10.5.2.7 Nigeria
10.5.2.7.1 Nigeria Marine Lubricants Market Estimates and Forecasts, by Oil Type (2020-2032) (USD Billion)
10.5.2.7.2 Nigeria Marine Lubricants Market Estimates and Forecasts, by Product Type (2020-2032) (USD Billion)
10.5.2.7.3 Nigeria Marine Lubricants Market Estimates and Forecasts, by Ship Type (2020-2032) (USD Billion)
10.5.2.8 Rest of Africa
10.5.2.8.1 Rest of Africa Marine Lubricants Market Estimates and Forecasts, by Oil Type (2020-2032) (USD Billion)
10.5.2.8.2 Rest of Africa Marine Lubricants Market Estimates and Forecasts, by Product Type (2020-2032) (USD Billion)
10.5.2.8.3 Rest of Africa Marine Lubricants Market Estimates and Forecasts, by Ship Type (2020-2032) (USD Billion)
10.6 Latin America
10.6.1 Trends Analysis
10.6.2 Latin America Marine Lubricants Market Estimates and Forecasts, by Country (2020-2032) (USD Billion)
10.6.3 Latin America Marine Lubricants Market Estimates and Forecasts, by Oil Type (2020-2032) (USD Billion)
10.6.4 Latin America Marine Lubricants Market Estimates and Forecasts, by Product Type (2020-2032) (USD Billion)
10.6.5 Latin America Marine Lubricants Market Estimates and Forecasts, by Ship Type (2020-2032) (USD Billion)
10.6.6 Brazil
10.6.6.1 Brazil Marine Lubricants Market Estimates and Forecasts, by Oil Type (2020-2032) (USD Billion)
10.6.6.2 Brazil Marine Lubricants Market Estimates and Forecasts, by Product Type (2020-2032) (USD Billion)
10.6.6.3 Brazil Marine Lubricants Market Estimates and Forecasts, by Ship Type (2020-2032) (USD Billion)
10.6.7 Argentina
10.6.7.1 Argentina Marine Lubricants Market Estimates and Forecasts, by Oil Type (2020-2032) (USD Billion)
10.6.7.2 Argentina Marine Lubricants Market Estimates and Forecasts, by Product Type (2020-2032) (USD Billion)
10.6.7.3 Argentina Marine Lubricants Market Estimates and Forecasts, by Ship Type (2020-2032) (USD Billion)
10.6.8 Colombia
10.6.8.1 Colombia Marine Lubricants Market Estimates and Forecasts, by Oil Type (2020-2032) (USD Billion)
10.6.8.2 Colombia Marine Lubricants Market Estimates and Forecasts, by Product Type (2020-2032) (USD Billion)
10.6.8.3 Colombia Marine Lubricants Market Estimates and Forecasts, by Ship Type (2020-2032) (USD Billion)
10.6.9 Rest of Latin America
10.6.9.1 Rest of Latin America Marine Lubricants Market Estimates and Forecasts, by Oil Type (2020-2032) (USD Billion)
10.6.9.2 Rest of Latin America Marine Lubricants Market Estimates and Forecasts, by Product Type (2020-2032) (USD Billion)
10.6.9.3 Rest of Latin America Marine Lubricants Market Estimates and Forecasts, by Ship Type (2020-2032) (USD Billion)
11. Company Profiles
11.1 ExxonMobil Corporation
11.1.1 Company Overview
11.1.2 Financial
11.1.3 Products/ Services Offered
11.1.4 SWOT Analysis
11.2 Shell plc
11.2.1 Company Overview
11.2.2 Financial
11.2.3 Products/ Services Offered
11.2.4 SWOT Analysis
11.3 Chevron
11.3.1 Company Overview
11.3.2 Financial
11.3.3 Products/ Services Offered
11.3.4 SWOT Analysis
11.4 Royal Dutch Shell plc
11.4.1 Company Overview
11.4.2 Financial
11.4.3 Products/ Services Offered
11.4.4 SWOT Analysis
11.5 Lubmarine (Total Group)
11.5.1 Company Overview
11.5.2 Financial
11.5.3 Products/ Services Offered
11.5.4 SWOT Analysis
11.6 Gulf Oil Marine Ltd.
11.6.1 Company Overview
11.6.2 Financial
11.6.3 Products/ Services Offered
11.6.4 SWOT Analysis
11.7 BP Marine
11.7.1 Company Overview
11.7.2 Financial
11.7.3 Products/ Services Offered
11.7.4 SWOT Analysis
11.8 JXTG Nippon Oil & Energy Corporation
11.8.1 Company Overview
11.8.2 Financial
11.8.3 Products/ Services Offered
11.8.4 SWOT Analysis
11.9 BASF SE
11.9.1 Company Overview
11.9.2 Financial
11.9.3 Products/ Services Offered
11.9.4 SWOT Analysis
11.10 Valvoline Inc.
11.10.1 Company Overview
11.10.2 Financial
11.10.3 Products/ Services Offered
11.10.4 SWOT Analysis
12. Use Cases and Best Practices
13. Conclusion
An accurate research report requires proper strategizing as well as implementation. There are multiple factors involved in the completion of good and accurate research report and selecting the best methodology to compete the research is the toughest part. Since the research reports we provide play a crucial role in any company’s decision-making process, therefore we at SNS Insider always believe that we should choose the best method which gives us results closer to reality. This allows us to reach at a stage wherein we can provide our clients best and accurate investment to output ratio.
Each report that we prepare takes a timeframe of 350-400 business hours for production. Starting from the selection of titles through a couple of in-depth brain storming session to the final QC process before uploading our titles on our website we dedicate around 350 working hours. The titles are selected based on their current market cap and the foreseen CAGR and growth.
The 5 steps process:
Step 1: Secondary Research:
Secondary Research or Desk Research is as the name suggests is a research process wherein, we collect data through the readily available information. In this process we use various paid and unpaid databases which our team has access to and gather data through the same. This includes examining of listed companies’ annual reports, Journals, SEC filling etc. Apart from this our team has access to various associations across the globe across different industries. Lastly, we have exchange relationships with various university as well as individual libraries.
Step 2: Primary Research
When we talk about primary research, it is a type of study in which the researchers collect relevant data samples directly, rather than relying on previously collected data. This type of research is focused on gaining content specific facts that can be sued to solve specific problems. Since the collected data is fresh and first hand therefore it makes the study more accurate and genuine.
We at SNS Insider have divided Primary Research into 2 parts.
Part 1 wherein we interview the KOLs of major players as well as the upcoming ones across various geographic regions. This allows us to have their view over the market scenario and acts as an important tool to come closer to the accurate market numbers. As many as 45 paid and unpaid primary interviews are taken from both the demand and supply side of the industry to make sure we land at an accurate judgement and analysis of the market.
This step involves the triangulation of data wherein our team analyses the interview transcripts, online survey responses and observation of on filed participants. The below mentioned chart should give a better understanding of the part 1 of the primary interview.
Part 2: In this part of primary research the data collected via secondary research and the part 1 of the primary research is validated with the interviews from individual consultants and subject matter experts.
Consultants are those set of people who have at least 12 years of experience and expertise within the industry whereas Subject Matter Experts are those with at least 15 years of experience behind their back within the same space. The data with the help of two main processes i.e., FGDs (Focused Group Discussions) and IDs (Individual Discussions). This gives us a 3rd party nonbiased primary view of the market scenario making it a more dependable one while collation of the data pointers.
Step 3: Data Bank Validation
Once all the information is collected via primary and secondary sources, we run that information for data validation. At our intelligence centre our research heads track a lot of information related to the market which includes the quarterly reports, the daily stock prices, and other relevant information. Our data bank server gets updated every fortnight and that is how the information which we collected using our primary and secondary information is revalidated in real time.
Step 4: QA/QC Process
After all the data collection and validation our team does a final level of quality check and quality assurance to get rid of any unwanted or undesired mistakes. This might include but not limited to getting rid of the any typos, duplication of numbers or missing of any important information. The people involved in this process include technical content writers, research heads and graphics people. Once this process is completed the title gets uploader on our platform for our clients to read it.
Step 5: Final QC/QA Process:
This is the last process and comes when the client has ordered the study. In this process a final QA/QC is done before the study is emailed to the client. Since we believe in giving our clients a good experience of our research studies, therefore, to make sure that we do not lack at our end in any way humanly possible we do a final round of quality check and then dispatch the study to the client.
By Oil type
Mineral Oil
Synthetic Oil
Bio-based Oil
By Product Type
Engine Oil
Hydraulic Fluid
Compressor Oil
Others
By Ship type
Bulk Carriers
Tankers
Container Ships
Others
Request for Segment Customization as per your Business Requirement: Segment Customization Request
Regional Coverage:
North America
US
Canada
Mexico
Europe
Eastern Europe
Poland
Romania
Hungary
Turkey
Rest of Eastern Europe
Western Europe
Germany
France
UK
Italy
Spain
Netherlands
Switzerland
Austria
Rest of Western Europe
Asia Pacific
China
India
Japan
South Korea
Vietnam
Singapore
Australia
Rest of Asia Pacific
Middle East & Africa
Middle East
UAE
Egypt
Saudi Arabia
Qatar
Rest of Middle East
Africa
Nigeria
South Africa
Rest of Africa
Latin America
Brazil
Argentina
Colombia
Rest of Latin America
Request for Country Level Research Report: Country Level Customization Request
Available Customization
With the given market data, SNS Insider offers customization as per the company’s specific needs. The following customization options are available for the report:
Product Analysis
Criss-Cross segment analysis (e.g. Product X Application)
Product Matrix which gives a detailed comparison of product portfolio of each company
Geographic Analysis
Additional countries in any of the regions
Company Information
Detailed analysis and profiling of additional market players (Up to five)
Explore the Morocco Argan Oil Market, highlighting its demand in cosmetics, food, and wellness industries. Learn about Morocco's argan oil production, quality, and rising global interest in this eco-friendly oil for skincare, haircare, and nutritional sup
The Furfural Market Size was valued at USD 595.7 million in 2023, and is expected to reach USD 1095.2 million by 2032, and grow at a CAGR of 7.0% over the forecast period 2024-2032.
The Epoxy Resins Market Size was valued at USD 12.89 billion in 2023 and is expected to reach USD 20.85 billion by 2032 and grow at a CAGR of 5.49% over the forecast period 2024-2032.
The Asphalt Market size was valued at USD 249.2 million in 2023. It is expected to grow to USD 389.9 million by 2032 and grow at a CAGR of 5.1% by 2024-2032.
The Vanillic Acid Market size was valued at USD 20.35 billion in 2023 and is expected to grow to USD 24.48 billion by 2031 and grow at a CAGR of 2.3% over the forecast period of 2024-2031.
The Synthetic Fibers Market Size was valued at USD 70.5 billion in 2023 and is expected to reach USD 117.7 billion by 2032 and grow at a CAGR of 5.9% over the forecast period 2024-2032.
Hi! Click one of our member below to chat on Phone