Industrial Lubricants Market Report Scope & Overview:
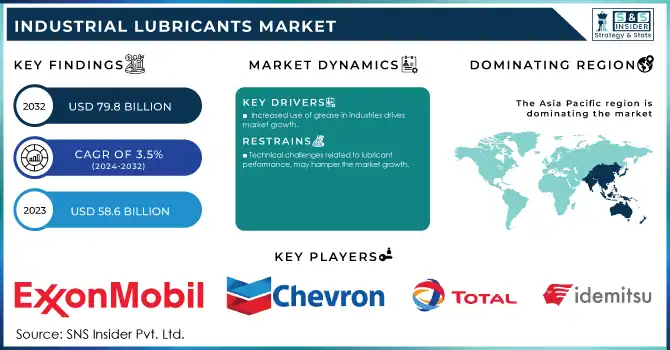
The Industrial Lubricants Market size was USD 58.6 billion in 2023 and is expected to reach USD 79.8 billion by 2032 and grow at a CAGR of 3.5% over the forecast period of 2024-2032.
Get More Information on Industrial Lubricants Market - Request Sample Report
The industrial lubricants market growth is driven by the rising energy sector, due to the growing number of renewable energy projects and increasing dependence on conventional power generation systems. Lubricants play a significant role in the operation of wind turbines, solar panels, and hydroelectric plants by ensuring optimal efficiency for equipment, reducing friction and wear, and extending the life of critical components. For example, wind turbine gear oils must handle extreme temperatures and heavy loads; hydraulic fluids that power solar tracking systems; and lubricating greases that provide stability and consumer satisfaction throughout the power system. The oil & gas sector also remains one of the primary end-users of industrial individual lubricants for their drilling, refining, and conveyance activities. Increasing energy requirements across the world, along with investment in renewable energy projects including offshore wind farms and solar projects is expected to result in rapid and high-performance lubricants adoption to deliver enhanced operational efficiency while reducing maintenance costs. In line with the growing emphasis on sustainable energy solutions and the incorporation of innovative lubrication technologies to meet the changing needs of the energy sector.
According to the International Renewable Energy Agency (IRENA), global renewable energy capacity reached 3,865 gigawatts (GW) in 2023, marking the largest yearly growth on record.
The demand for industrial robots is increasing which in turn is driving the increase in consumption of customized lubricants as per robotic and precision machinery needs. High-performance lubricants are necessary for automated systems in manufacturing environments (robotic arms, CNC machines, assembly lines, etc.) that are continuously subjected to high loads, fast movements, and extreme conditions. These lubricants help to minimize friction, reduce wear, extend the life of the components in the machinery, and keep the operations smooth. Since automation usually involves well-defined, repetitive tasks that require consistent performance, stability in lubricants under variable temperatures and pressures is also important. The advanced lubricants market, used for high-tech applications is experiencing high growth due to the rise in the adoption of automation by various industries such as automotive, electronics, aerospace, etc. To increase productivity and efficiency. The growing trend of predictive maintenance for industrial equipment is also supported by the use of smart lubricants, which can provide real-time feedback on machinery performance to ensure that only the necessary maintenance is performed and system downtime is minimized.
ExxonMobil launched Mobil SHC Aware series of lubricants designed specifically for the demanding needs of robotics and automation applications. These lubricants offer superior wear protection, reducing friction and extending the lifespan of automated systems, while also being environmentally friendly and compliant with sustainability standards.
Industrial Lubricants Market Dynamics
Drivers
-
Increased use of grease in industries drives market growth.
Rising demand for grease in different sectors have been offering significant employment to the industrial lubricants market. A semi-solid lubricant (grease) has certain advantages over oils in particular applications including load bearing, corrosion resistance, and higher protection against wear under high pressure conditions. Grease is used heavily in an automotive field as well as other machineries and equipment such as manufacturing and mining that has high exposure to extreme temperature, vibrations, and loads as part of the lubrication of bearings, gears, and other machinery components. Grease remains in location longer than oils, which allows lubrication less often while offering a more extensive duration of protection. The expanding acceptance of these automated systems, in which precision and dependability are critical, is also driving the demand for grease in robotics, conveyors, and heavy equipment. As the manufacturing sector grows and calls for dependable machinery efficiency increase, industries are looking toward newer grease formulations which, while delivering optimum performance, also improve energy efficiency and equipment longevity. This demand trend is expected to continue as there is a need for improved operational efficiency while keeping maintenance and downtime costs low in the industries.
Restraint
-
Technical challenges related to lubricant performance, may hamper the market growth.
The Technical challenges associated with lubricant performance are making lubricant a significant restraint for the industrial lubricants market as these challenges can slow the progress towards next-generation lubrication. Numerous industries, particularly the high-performance ones like automotive, aerospace, and heavy machinery, need lubricants that handle the most extreme operational conditions with high heat, severe loads, and high vibrations. Nevertheless, not all lubricants succeed to meet the modern-day approach of the abrasive environment of modern-day machinery despite advancements in the lubricant technology. Lubricants, for instance, may rapidly degrade, underperform under pressure, or may not be effective against wear and corrosion, to name a few examples. Such degradations can lead to higher maintenance costs and shorter equipment life, resulting in more frequent down times and inefficiencies for end users. Additionally, the development of lubricants must also ensure compatibility with different machinery types and industrial environments, which further adds complexity to the process.
Industrial Lubricants Market Segments
By Type
Mineral oil held the largest market hare around 47% in 2023. It is owing to its cost-effectiveness, availability and proven performance in various industrial applications. Mineral oil is a product of crude oil that has been refined to create a general-purpose lubricant used in various types of machinery, including automotive engines and industrial machinery. It is highly popular and majorly used with the economy argument, being inexpensive, especially in comparison with synthetic oils and bio-based alternatives partially; obviously, large parts of those industries are price-sensitive, like manufacturing and automotive. Also, Mineral oil has good lubrication properties such as reducing friction, removing heat, and preventing rust, which are important to the efficiency and life of machines.
By Product Type
Process oil held the largest market share around 35% in 2023. It is attributed to its significance in the majority of the manufacturing processes, especially in rubber, plastic, and chemical industries. Process oils serve as an additive to enhance the performance, stability, and quality of the end products. In the rubber industry, process oils may be added to improve the processing characteristics of rubber compounds, such as workability, viscosity, and ingredient dispersion. In the same way, the usage process oils are also used in the plastic industry, which is also playing an important role in improving the flow property and processing ease of plastics for improved quality and consistency of the end product. Process oils are an integral part of these industries, owing to their diverse functional properties that help increase the efficiency of the process, reduce the production costs, or enhance the performance of the final product.
By Application
Chemical segment held the largest market share around 22% in 2023. The demand for specialized lubricants in various industrial sectors, including automotive, manufacturing, and energy, continues to grow. Chemical-based lubricants also include synthetic oils, esters, and specialty formulations, to help balance the specialized needs or high-performance applications that demand higher-performance lubrication properties such as extreme temperature stability, corrosion resistance, and high-pressure endurance. These lubricants are especially useful in sectors with sophisticated machinery and tough working environments, such as aerospace, automotive, and power generation. This directly results in greater efficiency, increased equipment life, lower energy consumption, and overall performance which is particularly important in industries that have a focus on lowering downtime and maintenance expenses thus chemical lubricants are also among the top choices.
Industrial Lubricants Market Regional Analysis
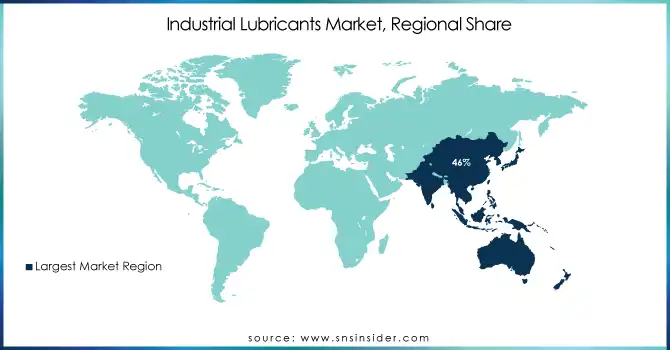
Asia Pacific held the largest market share around 46% in 2023. It is driven by rapid industrialization, a large manufacturing base, and rising demand from different sectors. It is a place where some of the largest automobile, manufacturing, and heavy machinery industries in the world exist from many countries, especially China, India, Japan, and South Korea. With the expansion of these sectors, there has also been an increase in demand for high-performance lubricants to ensure trouble-free operations, help in increasing machine performance, and reduce downtime. Moreover, the rapid industrialization coupled with the growing needs for infrastructure development specific to construction, energy, and transportation in the emerging economies in the Asia Pacific region, further assists the booming industrial lubricants demand across multiple applications such as engine oils, process oils, and greases. Additionally, the region's emphasis on the improvement of its industrial infrastructure for greater levels of global automation, energy efficiency, and sustainability is another factor driving the demand for advanced lubricants. These include the presence of the major lubricant manufacturing companies in the region and favorable government policies that groom the industrial growth and technological advancement in such countries, thereby dominating this regional market. Asia Pacific continues to lead in terms of industrial output, and is therefore one of the significant markets for industrial lubricants, holding the largest global market share.
Get Customized Report as per Your Business Requirement - Request For Customized Report
Key Players
-
ExxonMobil (Mobil 1, Mobil SHC)
-
Chevron Corporation (Chevron Rando HD, Delo)
-
Total S.A. (Total Azolla, Total Nevastane)
-
Idemitsu Kosan Co. Ltd. (Idemitsu Synthetic Lubricants, Idemitsu Marine Oils)
-
Fuchs Petrolub AG (Fuchs Titan, Fuchs Renolin)
-
Valvoline (Valvoline Advanced Full Synthetic, Valvoline Premium Blue)
-
Lukoil (Lukoil Avtomobilnoe, Lukoil Genesis)
-
Petronas (Petronas Syntium, Petronas Urania)
-
Gazprom Neft (Gazprom Neft Lux, Gazprom Neft Fleet)
-
Pertamina (Pertamina Enduro, Pertamina Meditran)
-
Royal Dutch Shell (Shell Helix, Shell Gadus)
-
BP p.l.c. (Castrol GTX, Castrol EDGE)
-
PetroChina Company Limited (PetroChina T-Lubricant, PetroChina Long-Life Oil)
-
Sinopec Limited (Sinopec Lubricant, Sinopec Gear Oil)
-
Castrol (Castrol EDGE, Castrol Vecton)
-
Indian Oil Corporation Limited (Servo, IOCL Engine Oil)
-
Luberef (Luberef Super, Luberef Premium)
-
SK Lubricants (SK ZIC, SK Cleantec)
-
Chevron Phillips Chemical Company (Chevron Phillips Naphthenic Oils, Chevron Phillips Process Oils)
-
Hyundai Oilbank (Hyundai Oilbank Auto Oil, Hyundai Oilbank Industrial Oil)
Recent Development:
-
In 2024, Idemitsu introduced its Idemitsu K-20 synthetic automotive lubricant, offering enhanced fuel economy and improved engine protection for high-performance engines, particularly in regions with extreme climate conditions. The product aligns with the industry’s increasing focus on fuel efficiency and engine longevity.
-
In 2023, Chevron introduced its Delo 400 ZFA, a heavy-duty diesel engine oil specifically formulated to support the growing demand for cleaner and more efficient engines. The product is part of Chevron's ongoing commitment to enhance fuel efficiency and reduce environmental impacts across the industrial sectors.
-
In 2023, Total launched its Total Fluide 980, a new fluid for electric vehicles (EVs) and hybrid vehicles, designed to enhance the performance and efficiency of EV systems, including cooling and lubrication. This development aligns with Total's focus on sustainability and supporting the growing electric vehicle market.
| Report Attributes | Details |
|---|---|
| Market Size in 2023 | USD 58.6 Billion |
| Market Size by 2032 | USD 79.8 Billion |
| CAGR | CAGR of 3.5% From 2024 to 2032 |
| Base Year | 2023 |
| Forecast Period | 2024-2032 |
| Historical Data | 2020-2022 |
| Report Scope & Coverage | Market Size, Segments Analysis, Competitive Landscape, Regional Analysis, DROC & SWOT Analysis, Forecast Outlook |
| Key Segments |
• By oil (Mineral Oil, Synthetic Oil, Bio-based Oil) • By Product Type (Process Oils, General Industrial Oils, Metalworking Fluids, Industrial Engine Oils, Greases, Others) |
| Regional Analysis/Coverage | North America (US, Canada, Mexico), Europe (Eastern Europe [Poland, Romania, Hungary, Turkey, Rest of Eastern Europe] Western Europe] Germany, France, UK, Italy, Spain, Netherlands, Switzerland, Austria, Rest of Western Europe]), Asia Pacific (China, India, Japan, South Korea, Vietnam, Singapore, Australia, Rest of Asia Pacific), Middle East & Africa (Middle East [UAE, Egypt, Saudi Arabia, Qatar, Rest of Middle East], Africa [Nigeria, South Africa, Rest of Africa], Latin America (Brazil, Argentina, Colombia, Rest of Latin America) |
| Company Profiles | ExxonMobil, Chevron Corporation, Total S.A., Idemitsu Kosan Co. Ltd., Fuchs Petrolub AG, Valvoline, Lukoil, Petronas, Gazprom Neft, Pertamina,Royal Dutch Shell, BP p.l.c., PetroChina Company Limited, Sinopec Limited |
| Drivers | • Increased use of grease in industries drives the market growth. |
| Restraints | • Technical challenges related to lubricant performance, may hamper the market growth. |
Frequently Asked Questions
The Industrial Lubricants Market size was USD 58.6 billion in 2023 and is expected to reach USD 79.8 billion by 2032 and grow at a CAGR of 3.5% over the forecast period of 2024-2032.
Technical challenges related to lubricant performance, may hamper the market growth.
By oil, By Application, By product type are segments of the global Industrial Lubricants market.
The Asia-Pacific region, has the biggest market share in the global market.
Manufacturers, Consultant, aftermarket players, association, Research institute, private and universities libraries, suppliers and distributors of the product.
Get in Touch
