Methanol Market Report Scope & Overview:
The Methanol Market Size was valued at USD 33.7 billion in 2023, and is expected to reach USD 54.5 billion by 2032, and grow at a CAGR of 5.5% over the forecast period 2024-2032.

Get More Information on Methanol Market - Request Sample Report
Methanol experiences substantial transformations in the market due to environmental considerations, technological trends, and regulatory frameworks that are changing. As such, today, countries are focusing more on ensuring a lower carbon footprint and transition to sustainable sources of energy, while methanol has been playing an increasingly significant role in achieving this objective. It is used as a clean fuel as well as in various chemical and transport industries. In addition, renewable methanol derived from biomass or CO2 is increasingly coming to the fore, which enhances the significance of the fuel as a standalone solution towards net zero.
The strategic investment and collaborations in the methanol sector were gauged through recent developments that confirmed a sizeable investment in Nigeria based on a landmark April 2024 deal. Shell signed an agreement with local stakeholders under-investment amounting to $3.8 billion for developing a methanol project. This would enhance methanol production locally, thereby freeing it from the claws of import dependence and strengthening the local economy. Such projects help them showcase their increasing commitment to diversified alternatives in comparison to traditional energy companies. Such a growth commitment will eventually propel this fuel and stabilize the supply chain.
The other major driver for the methanol market is technological innovations. In April 2024, Wärtsilä said it had secured the largest methanol newbuild order ever for China, which was testimony to the still very strong demand for methanol-powered vessels. It is also a manifestation of the shift in the maritime world toward methanol as a cleaner alternative fuel option, more so in light of international regulations geared toward lower sulfur emissions. This is in the context of maritime initiatives for the sustainable operational environment of the global fleet. To this end, to date, methanol has been viewed as a valid alternative fuel by many sectors.
In June 2024, one of the biggest companies in Japan outlined initiatives focused on renewable source methanol production. This new development will increase methanol production by leaps and bounds while trying to put to zero the environmental degradation and, thereby, making sustainability an integral part of business systems. This is indeed in line with the general trend wherein companies invest in traditional methanol production but also engage in innovating new routes to produce green methanol and meet global sustainability targets while responding to consumers' call for more sustainable products in the marketplace.
With further progress toward a green economy, Masdar and TotalEnergies announced in August 2024 a partnership on a commercial project to be set up as producing methanol in combination with the generation of green hydrogen. This partnership is to form part of the building blocks of a sustainable energy ecosystem in which methanol will be an important intermediate for both energy storage and transportation. This integration will see green hydrogen build a case for better carbon footprints in the production process for methanol. It will, therefore, indicate how it will take that mantle for achieving future energy demands in the erstwhile traditional industries.
The Methanol Market: Expect a change of pace, in the future, using strategic investments, technology development, and the growing desire toward sustainable development. Improvements coming from collaborations among various stakeholders in reducing carbon emissions and cleaner alternatives will ensure methanol is a vital player in the global energy landscape.
Methanol Market Dynamics:
Drivers:
-
The shift towards sustainable energy solutions boosts methanol's appeal as a cleaner alternative for transportation and industrial applications.
However, the move towards sustainable energy solutions amplifies the attractiveness of methanol for cleaner fuel alternatives in transportation and industrial applications. That this fuel emits fewer carbon emissions compared to the traditional fossil fuel increases the appeal. As war is waged by governments and organizations against greenhouse gas emissions, methanol becomes increasingly a viable alternative fit for these sustainability goals. For instance, it can be made from renewable sources such as biomass or from captured carbon dioxide in industrial processes, so it is carbon carbon-neutral fuel. Major car manufacturers also consider it to be a fuel for their internal combustion engines, thus bringing down poisonous emissions and not reducing efficiency. Even to date, countries such as Sweden and Germany continue to invest in methanol fuel cell technology for vehicles with intentions of boosting energy efficiency and reducing the environmental impact of transportation. In the maritime field, also, methanol is also gaining interest as marine fuel because shipping companies will look forward to meeting stricter emission regulations. For example, due to the ability of the fuel to be used on methanol, several vessels have already been retrofit. Because of flexibility, methanol is also a feedstock for producing important chemicals and plastics. Hence, it has gradually been able to contribute to the effort toward greener manufacturing. Such multifaceted application in various industries emphasizes that methanol is indeed one of the key agents for meeting the goal of sustainability in energy systems and could serve as an attractive option for those industries seeking to reduce their footprint on earth.
-
Innovations in production methods and renewable feedstocks enhance methanol's efficiency and environmental profile, driving market growth.
New production technologies and renewable feedstocks are significantly improving the energy efficiency of methanol, the abatement of critical greenhouse gases, and its general environmental profile. Advanced technologies, such as CCU "carbon capture and utilization," are being developed to convert captured carbon dioxide emissions from industrial processes into methanol, thereby recycling greenhouse gases and overall carbon footprints. Besides, the renewable energy sources in the form of wind and solar power are integrated into methanol production processes, hence allowing the water electrolysis to produce hydrogen. This can then be catalytically converted with carbon dioxide to form methanol via a synthesis reaction. This is achieved while employing renewable energy and reducing dependence on fossil fuels to some extent, thus striking in line with sustainability objectives set by the world. Companies are now investing in better catalytic processes that maximize the yield of methanol and save energy in the production process, making the whole procedure more economical as well as environmentally friendly. For example, scientists are looking into the application of highly advanced catalysts that take over at lower conditions to increase the conversion ratio of biomass and waste to methanol. New Paradigm: The Rise of Biorefineries The biorefinery, which will convert all the organic waste materials and agricultural residues in novel pathways into methanol, providing a sustainable feedstock and addressing related problems concerning waste management, in effect spurring methanol's position as a green alternative to the status quo in the chemical industry. Such new developments in production technologies and feedstock application are critical in setting methanol as a more competitive and attractive choice in the energy market globally, thus making it widely adopted across various markets.
Restraint:
-
Fluctuations in raw material costs, particularly natural gas and coal, can impact methanol pricing and profitability, creating uncertainty in the market.
The primary constraint on the methanol market is the volatile movement of input costs of raw materials, which are both natural gas and coal. While a fluctuating cost of input impacts the price at which the merchant sells and its profitability, it generates uncertainty among the producers and consumers. Natural gas is among the primary feeds used in methanol production, and any volatility in this cost directly impacts the final costs of production. For example, geopolitical tensions or disruption of supply chains can cause sharp price hikes for natural gas, either one passed on to customers or absorbed by the methanol producer, depending on the actual costs, which will shift demand. Market dynamics will similarly determine coal prices, and environmental regulations may further be a factor, raising the complexity of the cost structure for methanol produced through coal gasification. Such fluctuating prices act as a deterring factor in investment in fresh production facilities or expansion since companies are reluctant to invest in long-term projects where costs are uncertain. Such price uncertainty sends waves into methanol in the marketplace, which makes it less competitive with other fuels and chemicals. It hampers its potential growth.
Opportunity:
-
Increasing investments in green methanol production present significant opportunities for growth, aligning with global sustainability initiatives and carbon reduction goals.
New investments in green methanol production will have a huge impact on the growth of the methanol market as these investments reflect more closely the global sustainability and carbon reduction goals. Decarbonization efforts are taking precedence for many companies and governments, which tend to consider the future prospects of green methanol, which can be derived from renewable sources, such as biomass, or by electrolysis of water using renewable energy source to provide hydrogen. For instance, the captured carbon dioxide is being used to produce green methanol for a number of developments through partnership programs. In this respect, even though the maritime sector continues to push for open waters, green methanol is eyed as a possibility for low-emitting shipping fuel under strict environmental regulations applied to vessels that emit greenhouse gases. Continuing strong and driven further by more and more automotive manufacturers including green methanol in their fuel strategy, and without negatively impacting its profitability scenario. As such, green methanol positions itself as a fundamental enabler in the transition toward a low-carbon energy future, hence presenting one of the most promising opportunities for players in every other sector as well.
Challenge:
-
Navigating complex environmental regulations and policies can pose challenges for methanol producers, affecting compliance costs and operational strategies.
The environmental regulations and policies introduced are so complex that producers of methanol have to comply regardless of the cost incurred. There would be costs related to compliance, and changes in strategies of operations shall be necessary. Regions impose varied regulations related to emissions as well as on safety and production processes. This might add a complexity to the methanol manufacturing landscape. Monitoring and reduction of emissions might require advanced technologies and systems. Therefore, capital expenditures could be significant., increased pressure on greenhouse gas emissions fuels a surge in regulation that creates tremendous compliance pushes within organizations and hampers well-practiced operations, increases the level of operational complexity. This regulatory setting might also deter investment since potential stakeholders are going to weigh the financial risks associated with fluctuating compliance costs. Furthermore, failure to adhere to such regulations may attract stern penalties or even sanctions, thus affecting the profitability and reputation of methanol producers. Therefore, though regulations might help to drive environmental sustainability, they simultaneously establish a competitive hassle for manufacturers looking to gain and maintain marketability.
Methanol Market Segmentation Analysis
By Feedstock
The natural gas segment dominated the methanol market in 2023 and accounted for a market share of about 75%. This was because natural gas was in adequate supply and relatively inexpensive for the production of methanol, specifically in regions characterized by vast reserves of the resource, such as North America and the Middle East. For example, large producers such as Methanex and OCI Resources use natural gas so efficiently in methanol production that big costs -and competitiveness-increase the cost of production. The growth in concern for sustainability also forces companies to maximize natural gas use, thereby making it the preferred feedstock for synthesizing methanol.
By Derivatives
In 2023, the formaldehyde segment dominated the methanol derivatives market, with a share estimated at around 35%. Form of formaldehyde is important to form a large number of resins as well as chemicals. For this reason, it serves huge applications in industries such as construction, automotive as well as textiles. For example, the companies BASF and Dynea utilize methanol as a raw material to form formaldehyde, which further develops applications in the manufacture of adhesives, coatings, as well as wood products. Formaldehyde market growth, caused by an increasing formaldehyde demand due to newer applications in combination with the growing construction sector and furniture manufacturing companies, has helped formaldehyde achieve market leadership among methanol derivatives.
By Sub-derivatives
In 2023, the gasoline additives segment dominated and accounted for the highest share of methanol sub-derivatives with approximately 40%. This is highly attributed to the increasing use of methanol as a blending agent in gasoline to improve the octane ratings and decrease emissions. Several companies like Methanex and OCI have focused on producing ultra-pure methanol only for this purpose, as demand for cleaner fuels has been upsurging with new environmental restrictions. The turn towards cleaner-burning fuels, especially in vehicles, has greatly benefited the use of methanol-based gasoline additives and has thereby become the largest sub-derivative in the market.
By End-use Industry
In 2023, the construction segment is expected to lead the methanol market, accounting for approximately 30% market share. The cause of this supremacy is the critical feedstock application of methanol in the production of formaldehyde, which bears a leading role in a good number of resin and adhesive products crucial for building materials. High-performance adhesives and insulation materials, being crucial for modern construction practices that are considered to be taken to mean as energy-efficient and environmentally friendly, are formulated using methanol by companies such as BASF and Momentive. Methanol's increasing importance in the construction sector is further fueled by increasing demand for green building products, and thus the segment of end use is the biggest in the market.
Methanol Market Regional Outlook
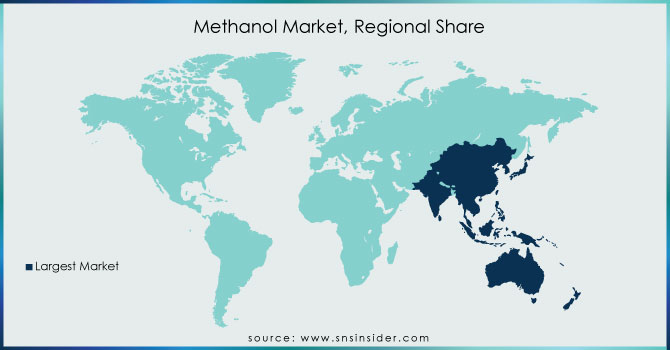
In 2023, the Asia-Pacific region dominated the methanol market, accounting for 50% market share. Rapid industrialization in the region, brisk demand for methanol derivatives, and investments in production facilities were some of the contributory factors. In this region, important players like China and India dominated global figures in the production and consumption of methanol. For example, such companies as Sinopec and China National Petroleum Corporation (CNPC) have built capacities of methanol production large enough to drive their manufacturing chemical businesses mainly into formaldehyde and acetic acid. The growing concentration of clean energy solutions in the region and the development of methanol as a transport fuel also strengthen its position in the Asia-Pacific market.
Get Customized Report as per your Business Requirement - Request For Customized Report
Major Companies
-
BASF SE (formaldehyde, acetic acid, methyl methacrylate)
-
Cleanse Corporation (cleaning agents, fuel additives)
-
HELM AG (methanol, acetic acid)
-
LyondellBasell Industries Holdings B.V. (methanol, MTBE)
-
Methanex Corporation (methanol, methanol derivatives)
-
Mitsubishi Gas Chemical Company, Inc. (formaldehyde, methyl methacrylate)
-
Mitsui & Co. LTD (methanol, acetic acid)
-
OCI N.V. (methanol, ammonia)
-
SABIC (methanol, urea)
-
Zagros Petrochemical Company (methanol, formaldehyde)
-
AkzoNobel (methanol-based coatings, epoxy resins)
-
Celanese Corporation (acetic acid, methanol)
-
Eastman Chemical Company (methanol, acetate esters)
-
Formosa Plastics Corporation (methanol, acetic acid)
-
Haldor Topsoe (methanol synthesis catalysts, methanol reforming technology)
-
PetroChina Company Limited (methanol, gasoline additives)
-
Reliance Industries Limited (methanol, petrochemicals)
-
Singapore Methanol Plant (methanol)
-
Syntroleum Corporation (synthetic fuels, methanol)
-
TotalEnergies (methanol, biofuels)
Recent Developments
-
July 2024: A MAN genset was retrofitted, giving the machine a retrofit kit that enabled the machine to work on methanol. This made power plants more efficient with higher performance and cleaner fuel.
-
February 2024: Lake Charles Methanol has announced a $3.2 billion manufacturing plant in Southwest Louisiana, intended to increase local job creation and meet emerging demand for methanol.
-
January 2024: BASF announced additional enhancements of its methanol production technology in pursuit of greater efficiency, sustainability, and ambient impact, keeping pace with steadily increasing global demand.
| Report Attributes | Details |
|---|---|
| Market Size in 2023 | US$ 33.7 Billion |
| Market Size by 2032 | US$ 54.5 Billion |
| CAGR | CAGR of 5.5% From 2024 to 2032 |
| Base Year | 2023 |
| Forecast Period | 2024-2032 |
| Historical Data | 2020-2022 |
| Report Scope & Coverage | Market Size, Segments Analysis, Competitive Landscape, Regional Analysis, DROC & SWOT Analysis, Forecast Outlook |
| Key Segments | •By Feedstock (Coal, Natural Gas, Others) •By Derivatives (Gasoline, MTO/MTP, Formaldehyde, Methyl Tertiary Butyl Ether (MTBE), Acetic Acid, Dimethyl Ether (DME), Methyl Methacrylate (MMA), Biodiesel, Others) •By Sub-derivatives (Gasoline additives, Olefins, UF/PF resins, VAM, Polyacetals, MDI, PTA, Acetate Esters, Acetic anhydride, Fuels, Others) •By End-use Industry (Construction, Automotive, Electronics, Appliances, Paints & Coatings, Insulation, Pharmaceuticals, Packaging (PET bottles), Solvents, Others) |
| Regional Analysis/Coverage | North America (USA, Canada, Mexico), Europe (Germany, UK, France, Italy, Spain, Netherlands, Rest of Europe), Asia-Pacific (Japan, South Korea, China, India, Australia, Rest of Asia-Pacific), The Middle East & Africa (Israel, UAE, South Africa, Rest of Middle East & Africa), Latin America (Brazil, Argentina, Rest of Latin America) |
| Company Profiles | Zagros Petrochemical Company, Mitsui & Co., LTD, HELM AG, Lyondellbasell Industries Holdings B.V, OCI N.V., Cleanse Corporation, SABIC, Mitsubishi Gas Chemical Company, Inc., BASF SE, Methanex Corporation |
| Drivers | •Methanol is being used as a feedstock in more and more applications. •Methanol is being used more and more in building projects. |
| Restraints | •Effects that are bad for people's health from methanol |
Get in Touch
