Green Hydrogen Market Size:
Get More Information on Green Hydrogen Market - Request Sample Report
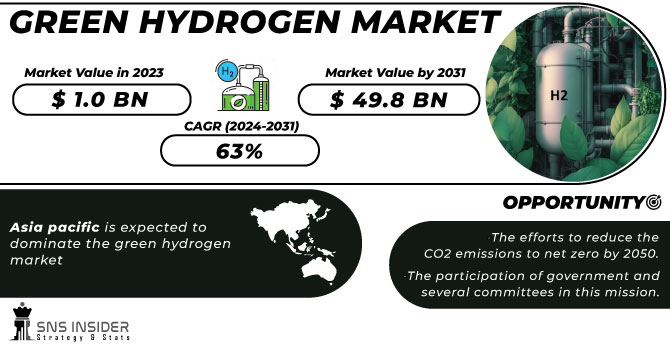
The Green Hydrogen Market was USD 6.6 billion in 2023 and is expected to reach USD 133.50 billion by 2032, growing at a CAGR of 39.6% over the forecast period of 2024-2032.
The increasing demand for mobility and industry is driving the green hydrogen market. Hydrogen fuel cells are emerging in mobility as a clean replacement technology to fossil fuel use, which is of particular relevance for heavy-duty vehicles such as buses, trucks, and trains. Hydrogen outperforms battery-electric solutions in terms of energy density and refueling speed, which are important for these types of vehicles. Germany is already running hydrogen-powered trains, and many governments are working to promote buses based on hydrogen fuel cells to help reduce urban emission levels. Similarly, among industrial applications, green hydrogen is being increasingly used for decarbonizing processes with high energy consumption, such as ammonia, steel, and oil refining. Green hydrogen is, for example, being utilized instead of coal in Direct Reduced Iron (DRI) processes in steelmaking, which represent a key enabler to decarbonize the steelmaking sector and achieve net-zero emissions. Driven by government incentives and technology improvements, this need in both sectors is beginning to drive green hydrogen into the global supply chain.
Governments are promoting the use of green hydrogen to decarbonize hard-to-abate industrial sectors. For example, the U.S. Government Accountability Office (GAO) highlights hydrogen's potential in reducing greenhouse gas emissions in steel manufacturing and power generation.
Decarbonization of energy systems is a key factor driving the adoption of green hydrogen globally. As countries strive to achieve their net-zero emissions targets, green hydrogen offers a sustainable solution to replace fossil fuels in energy-intensive sectors. It serves as a clean energy carrier, enabling the storage and transport of renewable energy from sources like solar and wind. This capability addresses the intermittency challenges of renewables and supports grid stability. Furthermore, green hydrogen is pivotal in reducing carbon emissions in hard-to-abate sectors such as steel, cement, and chemicals, where electrification is less viable. For example, hydrogen can be used in steel manufacturing to replace coking coal in Direct Reduced Iron (DRI) processes, significantly lowering CO2 emissions. Governments worldwide are setting ambitious targets and providing subsidies to promote green hydrogen projects. For instance, the European Union aims to produce 10 million tons of green hydrogen annually by 2030 under its Hydrogen Strategy. Such initiatives, combined with technological advancements and declining costs of renewables, are accelerating the transition to low-carbon energy systems.
Drivers
-
Rising Demand in hard-to-abate sectors drives market growth.
The rising demand for green hydrogen in hard-to-abate sectors is a major driver of market growth, as these industries face significant challenges in reducing their carbon emissions. Sectors such as steel, cement, and chemicals rely heavily on fossil fuels for energy-intensive processes, making traditional decarbonization methods insufficient. Green hydrogen offers a viable solution by acting as a clean energy source to replace coal, natural gas, and other carbon-heavy inputs. For instance, in steel manufacturing, green hydrogen is increasingly being used in Direct Reduced Iron (DRI) processes to replace coking coal, leading to a significant reduction in CO2 emissions. Similarly, in the chemical industry, green hydrogen is critical for producing ammonia and methanol sustainably. Governments and industries are prioritizing these applications, supported by incentives and funding to scale up adoption. For example, the European Commission has highlighted green hydrogen as essential to decarbonize energy-intensive industries under its "Fit for 55" package. This growing focus on hard-to-abate sectors not only drives innovation but also accelerates the global transition toward net-zero emissions.
The International Energy Agency (IEA) reports that, as of 2023, global hydrogen demand reached 97 million tons, with a significant portion utilized in the chemical sector. This underscores the critical role of hydrogen in chemical processes and the potential impact of green hydrogen adoption.
Restraint
-
Several energy losses during the process of hydrogen creation which may hamper the market growth.
One of the key challenges hindering the growth of the green hydrogen market is the energy losses that occur during the hydrogen production process, particularly when using renewable energy sources like wind and solar. Hydrogen is typically produced through water electrolysis; a process where electricity splits water molecules into hydrogen and oxygen. However, this process is not 100% efficient; energy is lost at various stages, including during the conversion of electricity into hydrogen. The efficiency of electrolyzers, which can range from 60% to 80%, means that a significant portion of the renewable energy is lost during the process. Additionally, further energy losses can occur when hydrogen is stored, transported, and converted back into usable energy, such as in fuel cells or power plants. These inefficiencies increase the overall cost of green hydrogen production, making it less competitive compared to other energy sources like natural gas or coal. This issue is particularly concerning as the green hydrogen market strives for cost parity with traditional fuels, and continued energy losses could slow down large-scale adoption unless technological advancements in electrolysis efficiency and energy storage systems can overcome these barriers.
Opportunities
-
The efforts to reduce the CO2 emissions to net zero by 2050.
-
The participation of government and several committees in this mission.
Market segmentation
By Technology
Electrolyzers held the largest revenue share 68% in 2023. It is owing to an indispensable role in the generation of hydrogen via water electrolysis. Electrolyzers are the main technology for green hydrogen production since they utilize electricity, which is generally from renewable sources, and break the water molecules into hydrogen and oxygen. Electrolyzers have an important role in green hydrogen demand, especially in mobility, industry, and energy storage sectors. Demand for clean hydrogen needed to decarbonize hard-to-abate value chains including steel, cement, and chemicals has increasingly driven the uptake of electrolyzers. In addition, the efficiency of electrolyzers is being improved and the cost is dropping, making it commercially competitive.
By Distribution Channel
Pipeline held a significant revenue share of around 62% in 2023. This is owing to their critical role in efficiently transporting hydrogen across large distances from sources of production to end-users. With the growing demand for green hydrogen, the immediate focus will be on its bulk movement since most of the large-scale industrial applications and fuel-cell vehicles play a crucial role in the development of efficient, safe, and cost-effective hydrogen transportation infrastructure. Hydrogen pipelines are the most trustable and most cost-effective way to transport hydrogen at scale given that they provide a continuous flow of hydrogen and are generally cheaper than alternatives such as trucks or shipping for large amounts. Apart from this, the rising investments in hydrogen infrastructure, such as dedicated hydrogen transportation networks, have also bolstered revenue earned from the pipelines.
By Application
The transport segment held the largest market share around 44% in 2023. It is because of the rising demand for cleaner, sustainable fuel alternatives for the transport sector. Especially in the case of applications like trucks, buses, trains, and ships which belong to the heavy-duty transport segment, hydrogen and fuel cell technology presents highly promising solutions to reduce emissions. For some transport sectors, hydrogen fuel cells can be better than BEVs as hydrogen gives longer driving ranges, shorter refueling times, and the ability to carry heavy loads. Global governments are doing their part as well, offering incentives, subsidies, and investing in infrastructure designed for hydrogen-based transport, including hydrogen fueling stations.
Get Customised Report as per Your Business Requirement - Enquire Now
Regional Analysis
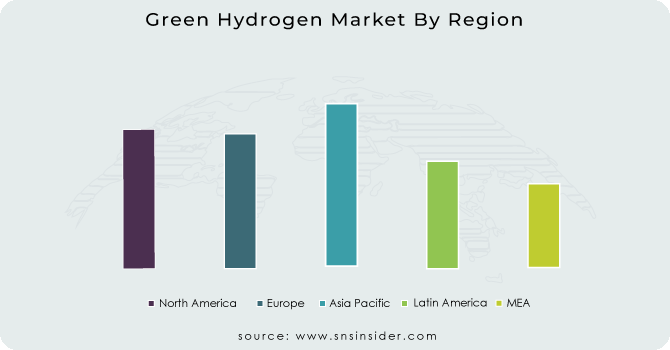
Asia Pacific held the largest market share around 44% in 2023. It is one of the leading regions for the highest renewable energy adoption and industry transformation in the region with the largest market share in green hydrogen. China, Japan, and South Korea the world's three largest economies are all looking to green hydrogen as part of their energy transition and are heavily investing, making this a potentially lucrative market within the region. All of these countries have ambitious decarbonization targets and are searching for sustainable solutions toward a reduction in fossil fuel demand. China, the biggest CO2 emitter, sees green hydrogen as a main way to decarbonize sectors including steel and chemicals; Japan and South Korea also are investing heavily in hydrogen as a central plank of their energy futures, with Japan's prime minister having called for a "hydrogen society." The region is also endowed with low-cost renewable energy, including solar and wind, which are key elements of green hydrogen production. The rapid growth of hydrogen infrastructure, large funding, and government-backed initiatives like Japan's hydrogen highway and China's hydrogen development roadmap, contribute to the overwhelming dominance of Asia Pacific in the green hydrogen market. Asia Pacific is well placed to lead and is already leading the global shift towards green hydrogen with a perfect storm of government support, industrial demand, and tech development.
Key Players
-
Linde plc (Hydrogen Production Plants, Electrolyzers)
-
Air Liquide (Hydrogen Liquefiers, Hydrogen Refueling Stations)
-
Siemens Energy AG (Silyzer Electrolyzers, Haru Oni Project)
-
Air Products and Chemicals, Inc. (Hydrogen Fueling Stations, Hydrogen Liquefaction Plants)
-
Plug Power Inc. (ProGen Fuel Cell Engines, GenFuel Hydrogen Solutions)
-
Bloom Energy Corporation (Bloom Energy Server, Electrolyzers)
-
Cummins Inc. (HyLYZER Electrolyzers, Hydrogen Fuel Cells)
-
Engie SA (Hydrogen Production Facilities, Hydrogen Storage Solutions)
-
Nel ASA (Alkaline Electrolyzers, Proton PEM Electrolyzers)
-
Toshiba Energy Systems & Solutions Corporation (Hydrogen Energy Research, Hydrogen Production Systems)
-
Uniper SE (Green Hydrogen Projects, Hydrogen Storage Solutions)
-
Ballard Power Systems Inc. (FCmove Fuel Cell Modules, FCgen Fuel Cell Products)
-
Iberdrola, S.A. (Green Hydrogen Production Plants, Renewable Energy Integration)
-
Repsol S.A. (Hydrogen Production Facilities, Renewable Hydrogen Projects)
-
China Petroleum & Chemical Corporation (Sinopec) (Hydrogen Refueling Stations, Hydrogen Production Plants)
-
Green Hydrogen Systems A/S (GHS HyProvide Electrolyzers, Hydrogen Generation Units)
-
McPhy Energy (McLyzer Electrolyzers, McFilling Hydrogen Stations)
-
ITM Power PLC (HGas Electrolyzers, Hydrogen Refueling Stations)
-
Reliance Industries Limited (Hydrogen Production Projects, Renewable Energy Integration)
-
Enapter (AEM Electrolyzers, Hydrogen Generators)
Recent Development:
-
In April 2023, Sinopec unveiled intentions to build a 400 km green hydrogen pipeline connecting Inner Mongolia with Beijing. The pipeline, with a capacity of 100,000 tonnes per year, aims to transport hydrogen generated from renewable sources, marking a significant step in reducing carbon emissions.
-
In April 2024, Oman's Hydrom signed an agreement worth USD 11 billion with Electricité de France (EDF Group) to develop two green hydrogen production projects.
-
In June 2022, Siemens Energy and Air Liquide S.A. announced a joint venture to manufacture industrial-scale renewable hydrogen electrolyzers. This collaboration aims to facilitate the development of a sustainable hydrogen economy in Europe.
| Report Attributes | Details |
| Market Size in 2023 | US$ 6.6 Bn |
| Market Size by 2032 | US$ 133.50 Bn |
| CAGR | CAGR of 39.6% From 2024 to 2032 |
| Base Year | 2023 |
| Forecast Period | 2024-2032 |
| Historical Data | 2020-2022 |
| Report Scope & Coverage | Market Size, Segments Analysis, Competitive Landscape, Regional Analysis, DROC & SWOT Analysis, Forecast Outlook |
| Key Segments |
• By Technology (Alkaline electrolyze, Polymer electrolyte Membrane (PEM Electrolyte), SOEC Electrolyzer) |
| Regional Analysis/Coverage | North America (USA, Canada, Mexico), Europe (Germany, UK, France, Italy, Spain, Netherlands, Rest of Europe), Asia-Pacific (Japan, South Korea, China, India, Australia, Rest of Asia-Pacific), The Middle East & Africa (Israel, UAE, South Africa, Rest of Middle East & Africa), Latin America (Brazil, Argentina, Rest of Latin America) |
| Company Profiles | Linde plc, Air Liquide, Siemens Energy AG, Air Products and Chemicals, Inc., Plug Power Inc. , Bloom Energy Corporation, Cummins Inc. , Engie SA, Nel ASA, Toshiba Energy Systems & Solutions Corporation, Uniper SE, Ballard Power Systems Inc. , Iberdrola, S.A., Repsol S.A., China Petroleum & Chemical Corporation (Sinopec), Green Hydrogen Systems A/S , McPhy Energy, ITM Power PLC, Reliance Industries Limited, Enapter |
| Key Drivers | • Rising Demand in hard-to-abate sectors drives market growth. |
| Market Opportunities | • The efforts to reduce the CO2 emissions to net zero by 2050. • The participation of government and several committees in this mission. |
Frequently Asked Questions
Rise in demand of green hydrogen production due to the decarbonization benefit.
- Legal Issues all around the globe.
- Social concerns and the cost factor which includes the maintenance operations and functioning costs.
Covid-19 had a negative impact on the green hydrogen market.
The Green Hydrogen Market was USD 6.6 billion in 2023 and is expected to reach USD 133.50 billion by 2032, growing at a CAGR of 39.6% over the forecast period of 2024-2032.
The CAGR rate is expected to be 39.6% during the forecasted period.
Get in Touch
