Oil & Gas Pipeline Leak Detection Market Report Scope & Analysis:
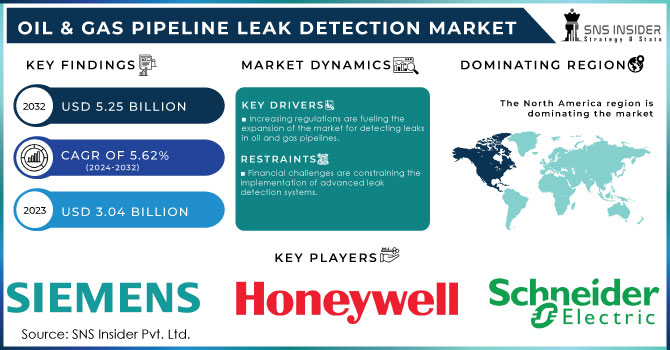
The Oil & Gas Pipeline Leak Detection Market size was valued at USD 3.04 Billion in 2023. It is expected to grow to USD 5.25 Billion by 2032 and grow at a CAGR of 5.62% over the forecast period of 2024-2032
Increasing safety concerns, regulations, and technological advances have supported significant development of the Oil & Gas Pipeline Leak Detection Market. The expansion is mainly driven by growing investments and financial backing for the safety of pipelines and hazardous materials. A division of the U.S. Department of Transportation — the PHMSA has granted more than USD 41 million to improve pipeline safety and assist first responders. Specifically, USD 2.4 million has been awarded to Pipeline Emergency Response grants, and USD 2 million has been allocated to Pipeline Safety Technical Assistance, both important in improving leak detection and reaction.
To get more information on Oil & Gas Pipeline Leak Detection Market - Request Free Sample Report
Additionally, the funding granted to Hazardous Materials Emergency Preparedness and training grants demonstrates the efforts to upgrade the safety responses and training of first responders. These investments have been made as the necessity for high-quality leak detection and response technologies is expanding. Acoustic sensors, fiber optics, and infrared devices are required by the regulations and necessary for protecting the environment and public health. As a result, there has been a significant increase in grant funding to improve the safety infrastructure and the reaction to emergencies. The growth includes a 50% increase for Federally Recognized Indian tribes and contains notable funds for new pipeline safety programs. Overall, this correlation demonstrates the essential link between the presence of high-quality, sophisticated leak detection systems and the ability of the market to grow and the devices to advance.
The Oil & Gas Pipeline Leak Detection Market is seeing significant growth due to the increasing necessity to tackle methane emissions from natural gas pipelines. Methane, a powerful greenhouse gas that is more than 80 times as effective at trapping heat as carbon dioxide, is facing greater scrutiny because of its substantial environmental effects. In 2021, the International Energy Agency stated around 70 million tonnes of methane were released from pipelines, accounting for about 5% of all energy-related methane emissions. The increasing worry is leading the sector to embrace sophisticated detection technologies in order to achieve strict climate goals, as laid out in the UK's Methane Action Plan, aiming for a 50% reduction in methane emissions by 2030 from 2018 levels and to decrease methane intensity below 0.20%.
As a reaction, the Oil & Gas Pipeline Leak Detection Market is experiencing an increase in the adoption of creative solutions such as gas analyzer systems based on drones. These flying systems improve leak detection capabilities significantly, allowing operators to monitor and manage methane emissions more efficiently. Incorporating these technologies reflects an industry shift towards advanced and preventative leak detection methods, necessary for regulatory compliance and reducing environmental harm. Increased funding for pipeline safety initiatives, totaling over USD 41 million in grants from PHMSA, further bolsters the market's expansion, including funding for pipeline emergency response and technical support. This funding enhances the advancement and implementation of state-of-the-art leak detection systems, strengthening the industry's dedication to enhancing safety and environmental protection in alignment with worldwide climate objectives.
MARKET DYNAMICS:
Drivers
-
Increasing regulations are fueling the expansion of the market for detecting leaks in oil and gas pipelines.
The Oil & Gas Pipeline Leak Detection Market is experiencing a rapid increase due to increased regulatory attention and the acknowledgment of methane emissions as a major environmental concern. Recent discoveries of undisclosed methane emissions emphasize the need for better detection methods. Between 2019 and late 2023, about 274.7 million cubic meters of natural gas were accidentally leaked from pipelines in the U.S., which is equal to the emissions of four typical coal-fired power plants. Presently, these emissions are not included in the official greenhouse gas inventory because of federal exemptions; however, the Biden administration is advocating for more stringent reporting requirements. Suggested EPA rules may require charges of $900 to $1,500 per metric ton of methane surpassing a specific limit, creating a drastic impact on companies facing penalties of up to $40 million for their methane releases. Next year, new rules will require reporting of significant leaks, set at 14,000 cubic meters or higher, which is a lower limit than current rules. The change in regulations is leading to more funding being put into advanced leak detection technologies, like gas analyzers mounted on drones, and other complex systems made to improve monitoring and decrease emissions. With environmental groups and researchers pointing out the differences in real and reported emissions, which could be as high as 2.6 million tons of methane leaks every year, much more reliable detection solutions are essential. The market is experiencing growth due to regulatory changes and the demand for more precise emissions information, driving the use of advanced technologies to reduce environmental effects and meet new strict regulations.
-
Innovation in Pipeline Leak Detection Technologies is driven by Regulatory Compliance
The strict regulations for plumbing products, set by the EPA's final rule on "Use of Lead Free Pipes, Fittings, Fixtures, Solder, and Flux for Drinking Water," have greatly influenced the industry. Starting on September 1, 2023, all plumbing items must comply with a new regulation requiring them to have a certification of being "lead free," which means that they can only contain a maximum of 0.25% lead on wet surfaces and 0.2% for solder and flux. The revised rules, in accordance with RLDWA and changes to SDWA, focus on a consistent benchmark to guarantee clean water for drinking and reduce the hazards of lead contamination. The need to meet new standards has pushed manufacturers to innovate and improve their products. This regulatory pressure is having a similar influence on the market for detecting leaks in oil and gas pipelines. The plumbing industry is adjusting to stricter regulations on lead-free requirements, while the pipeline sector is also facing regulatory pressures on emissions and leak detection. Similar to how the EPA mandates a decrease in lead levels to safeguard human health, new regulations focusing on methane emissions and unintended pipeline leaks are spurring the demand for improved detection technologies.
For instance, the suggested EPA regulations regarding methane emissions may result in substantial penalties for companies that surpass emission limits, promoting the implementation of better detection and monitoring systems. Compliance with lead-free regulations in plumbing has driven advancements in product testing and verification, which is comparable to this situation. The push for regulatory compliance in both industries stimulates the advancement of innovative technologies to adhere to environmental regulations and improve operational safety. As a result, the pipeline leak detection industry is experiencing a rise in funding for advanced methods like drone technology and sensor innovations to tackle regulatory issues and reduce environmental risks.
Restraints
-
Financial challenges are constraining the implementation of advanced leak detection systems.
The significant obstacle to the implementation of advanced leak detection systems in the oil and gas pipeline industry is the high initial costs. An article from 2023 brings attention to the challenges that SMEs face in adopting advanced technologies because of financial restrictions. Sophisticated leak detection systems, like fiber optic sensors and monitoring using drones, require significant initial financial commitments. As an example, fiber optic systems can range from USD 10,000 to USD 30,000 per mile of pipeline, while drone-based systems could cost over USD 200,000, depending on their features and capabilities.
Furthermore, the complex process of retrofitting existing pipeline infrastructure to integrate these technologies can significantly increase costs. According to the PHMSA, meeting strict leak detection requirements may necessitate billions of upgrades throughout the industry. The financial difficulties result in numerous companies, especially smaller businesses or those in areas with constrained budgets, struggling to invest in advanced leak detection solutions. Therefore, even though the significance of efficient leak detection in reducing environmental and safety hazards is acknowledged, the financial obstacles hinder the widespread implementation of these technologies. This restriction impacts not just the efficiency of pipelines but also hinders market growth and the ability to adhere to regulations and protect the environment. Therefore, it is essential to address these financial challenges in order to further develop and implement leak detection systems in the oil and gas industry.
KEY MARKET SEGMENTATION
By Medium
Based on Medium, NATURAL Gas is capturing the largest share in oil and gas pipeline Leak detection market with 70% of share in 2023. This leadership is caused by the crucial requirement for increased safety and adherence to regulations in the vast natural gas infrastructure, which acts as a significant energy source on a global scale. Major companies like Siemens and Honeywell have made significant progress in creating advanced leak detection systems designed specifically for natural gas pipelines. For example, Siemens has launched the innovative Siveillance Video platform, which combines high-definition cameras with artificial intelligence algorithms to identify and examine leaks immediately (Siemens). OptiGas system uses fiber optic sensors to constantly monitor pipeline conditions, detecting potential leaks early on. Honeywell's Experion Process Knowledge System improves leak detection by using advanced algorithms and real-time data integration, providing strong safety and compliance measures. The increased focus on preventing leaks, minimizing environmental effects, and ensuring the safe and effective running of natural gas pipelines is evident in the substantial investment in these technologies. With stricter regulations and increased focus on protecting the environment, the demand for advanced leak detection systems in natural gas pipelines is projected to grow due to innovations and the ongoing necessity for enhanced safety and efficiency.
By Location
Based on Location, Onshore is holding the largest share in oil and gas pipeline leak detection market with 60% of share in 2023. Onshore pipelines, often situated in densely populated or ecologically sensitive areas, demand robust leak detection solutions to prevent catastrophic environmental and economic consequences. Major players such as Siemens, Emerson, and Schneider Electric are leading the development of advanced technologies tailored for onshore applications. Siemens has introduced its Siveillance Video system, integrating high-resolution cameras with AI for real-time leak detection (Siemens). Emerson's Rosemount X-well system utilizes acoustic sensors to monitor pipeline integrity and detect leaks early (Emerson). Schneider Electric offers the EcoStruxure platform, which combines data analytics and IoT connectivity to provide comprehensive monitoring and leak detection (Schneider Electric).
REGIONAL ANALYSIS:
In 2023, North America has the biggest portion of the market for oil and gas leak detection, accounting for 32% of the share. This large portion highlights the region's crucial position in the worldwide energy scene, where pipelines are necessary for moving hydrocarbons from production areas to refineries, distribution centers, and final users. The strong regulatory framework in the region requires the use of sophisticated leak detection technologies, as enforced by agencies like the EPA and Canada's National Energy Board. These rules compel pipeline operators to use advanced systems to guarantee compliance and reduce environmental risks. In the United States, the EPA mandates that operators must utilize advanced leak detection technology to accurately monitor and report methane emissions. Emerson, Honeywell, and Siemens are leading the way in creating and implementing these technologies. Emerson's Rosemount 3D acoustic sensor technology improves pipeline safety by detecting leaks in real-time, alerting early to prevent accidents (Emerson). The Enraf Tank Gauging System by Honeywell provides enhanced leak detection for storage tanks, improving operational efficiency and safety. Siemens' Siveillance Video platform combines HD cameras with advanced analytics to identify abnormalities and possible leaks instantly (Siemens). These advancements not only aid in following regulations but also boost efficiency and safety, providing a positive environment for technology suppliers in the area. The continuous funding for advanced leak detection systems demonstrates North America's dedication to upholding strict environmental and safety standards for its pipeline network.
Asia Pacific is the second largest region in oil and gas pipeline leak detection market with 26% of share in 2023. The significant market presence is a result of the area's growing energy infrastructure and rising investments in pipeline safety and environmental protection. With the rapid industrialization and urbanization of Asia Pacific, there has been a significant increase in the need for strong and dependable pipeline systems due to the high levels of oil and gas production and consumption. Nations such as China, India, and Australia are leading the way in this expansion, dealing with the difficulties of overseeing large pipeline systems while also tackling environmental issues.
In China, the increased use of state-of-the-art leak detection technologies is a result of the government's emphasis on protecting the environment and enforcing strict regulations on methane emissions. Corporations like Coriolis and Neptune are actively engaged in offering cutting-edge solutions specifically designed for the requirements of the region. Coriolis' robots for inspecting pipelines utilize innovative sensors to accurately identify leaks and structural problems (Coriolis). Neptune's surveillance systems provide thorough live analysis and detection abilities for improving pipeline safety. In India, the oil and gas industry's growth, along with increasing regulatory demands, has led to advancements in modern leak detection systems. Schneider Electric are essential participants in this industry. Schneider Electric's EcoStruxure platform, offers solutions for real-time monitoring and predictive maintenance to avoid leaks and maintain compliance with changing regulations.

Need any customization research on Oil & Gas Pipeline Leak Detection Market - Enquiry Now
KEY PLAYERS:
The major key players are Honeywell International, Inc., Atmos International Inc., Siemens AG, FLIR Systems Inc., Schneider Electric SA, Bridger Photonics Inc., ClampOn AS, Pentair PLC, Pure Technologies Ltd., Ttk-Leak Detection System, Yokogawa Electric Corporation.
Recent Trends in the Oil & Gas Pipeline Leak Detection Market:
Pipelines transmit various types of oil and condensates, as well as natural gas, across great distances, necessitating the most precise leakage monitoring and detection techniques. Modern leak detection systems used in oil and natural gas production facilities and transmission pipelines contain E-RTTM as one of the most extensively utilized technologies. This device is devoid of false alarms and delivers reliable information on leaks. As a result, the market's E-RTTM category is expected to develop at the fastest rate over the forecast period. The E-RTTM technology can detect minor leaks (less than 1% of the flow), precisely identify leak sizes, and simulate all dynamic fluid features (flow, pressure, and temperature). Furthermore, the time it takes to discover leaks is longer.
Recent Development
-
In November 2021: Schneider Electric, French energy, and automation digital solution provider, and Prisma Photonics, an Israeli next-generation fiber sensing for smart infrastructure, announced their partnership to provide real-time intelligence and precise monitoring of oil and infrastructure.
| Report Attributes | Details |
|---|---|
| Market Size in 2023 | US$ 3.04 Billion |
| Market Size by 2032 | US$ 5.25 Billion |
| CAGR | CAGR 5.62% From 2024 to 2032 |
| Base Year | 2023 |
| Forecast Period | 2024-2032 |
| Historical Data | 2020-2022 |
| Report Scope & Coverage | Market Size, Segments Analysis, Competitive Landscape, Regional Analysis, DROC & SWOT Analysis, Forecast Outlook |
| Key Segments | • by Technology (Acoustic/Ultrasonic, E-RTTM, Fiber Optic, Mass/Volume Balance, Thermal Imaging, Laser Absorption, and LiDAR, Vapor Sensing) • by Medium (Oil and condensate and Natural gas) • by Location (Onshore and offshore) |
| Regional Analysis/Coverage | North America (US, Canada, Mexico), Europe (Eastern Europe [Poland, Romania, Hungary, Turkey, Rest of Eastern Europe] Western Europe] Germany, France, UK, Italy, Spain, Netherlands, Switzerland, Austria, Rest of Western Europe]), Asia Pacific (China, India, Japan, South Korea, Vietnam, Singapore, Australia, Rest of Asia Pacific), Middle East & Africa (Middle East [UAE, Egypt, Saudi Arabia, Qatar, Rest of Middle East], Africa [Nigeria, South Africa, Rest of Africa], Latin America (Brazil, Argentina, Colombia, Rest of Latin America) |
| Company Profiles | Honeywell International, Inc., Atmos International Inc., Siemens AG, FLIR Systems Inc., Schneider Electric SA, Bridger Photonics Inc., ClampOn AS, Pentair PLC, Pure Technologies Ltd., Ttk-Leak Detection System, Yokogawa Electric Corporation. |
| Key Drivers |
• Increasing regulations are fueling the expansion of the market for detecting leaks in oil and gas pipelines. |
| Restraints |
• Financial challenges are constraining the implementation of advanced leak detection systems. |
Frequently Asked Questions
Ans: - Key Stakeholders Considered in the study are Raw material vendors, Regulatory authorities, including government agencies and NGOs, Commercial research, and development (R&D) institutions, Importers and exporters, etc.
Ans: - The major key players of the market are Altus Intervention, Calfrac Well Services Ltd., Baker Hughes Company, Halliburton, Step Energy Services, Key Energy Services, Llc., Oceaneering International, Inc., Schlumberger Limited, Trican, Weatherford International Plc
Ans: - 3 segments of the Oil & Gas Pipeline Leak Detection Market.
Ans: - Upstream, middle, and downstream oil and gas leaks are all common.
Ans: - Oil & Gas Pipeline Leak Detection Market Size was valued at USD 3.04 Bn in 2023.
Get in Touch
