Passenger Boarding Bridges Market Report Scope and Overview:
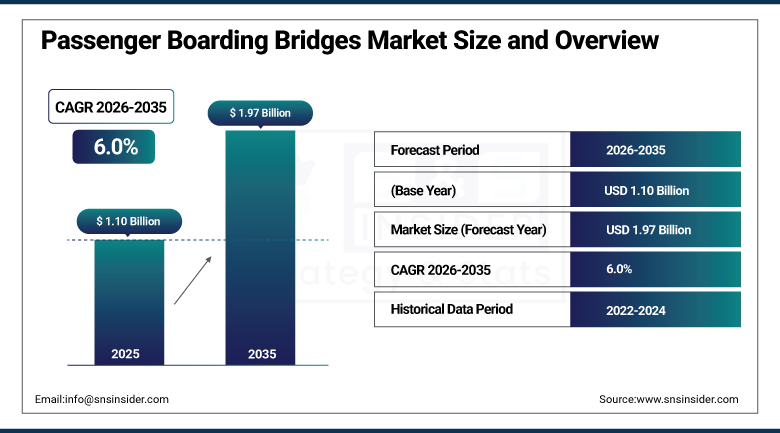
The Passenger Boarding Bridges Market was valued at USD 1.10 Billion in 2025 and is projected to reach USD 1.97 Billion by 2035, registering a CAGR of 6.0% from 2026 to 2035.
Passenger boarding bridges, which are also referred to as aerobridges, jet bridges, jetways, or sky bridges, are moving structures which connect an airport terminal gate with an airplane, offering passengers a weather-protected route to board and alight safely. Global recovery in air transport, along with an unprecedented boom in the construction and development of terminals, is still fueling the market's growth, and growing volumes of air passengers, development of terminals around the world, and innovations in bridge designs are still contributing to the demand for improved efficiency and passenger experience. The manufacturers are continually developing innovative solutions to increase the efficiency, functionality, and safety of passenger boarding bridges, and innovations in this sphere such as automated docking systems, flexibility of aircraft size adjustment, and architectural innovation are still contributing to the stable market growth.
The technology portfolio of the ADELTE Group expanded in 2025 as it offered its products to international hub airports aiming to increase their efficiency and passenger experience infrastructure in the wake of the terminal construction boom around the globe.
Market Size and Forecast
-
Market Size in 2026E: USD 1.17 Billion
-
Market Size by 2035: USD 1.97 Billion
-
CAGR: 6.0% from 2026 to 2035
-
Fastest Growing Region: Asia Pacific
-
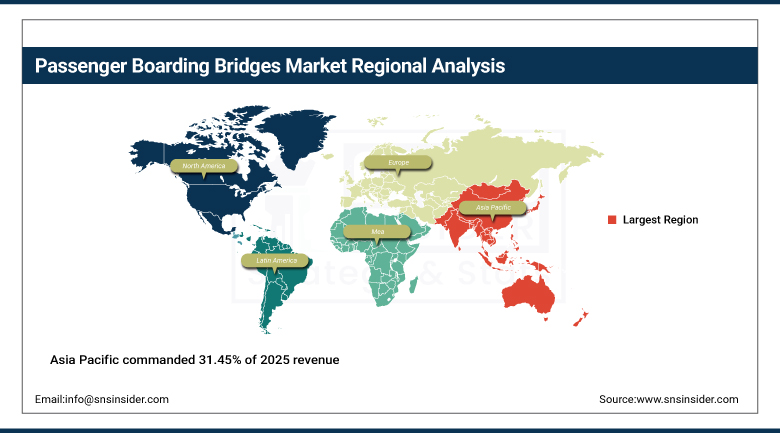
Largest Region: Asia Pacific (31.45% share in 2025)
To Get more information On Passenger Boarding Bridges Market - Request Free Sample Report
Passenger Boarding Bridges Market Trends
-
Recovery in global air travel, combined with an unprecedented wave of terminal construction and expansion projects, continues underpinning market acceleration.
-
Rising investments in airport aesthetics and safety standards continue driving demand for premium, modern architectural boarding bridge designs.
-
Integration with automated docking systems continues supporting reduced aircraft turnaround time across major commercial airports.
-
GSE manufacturers continue promoting glass-steel composite bridges for terminals requiring both structural robustness and modern architectural alignment.
-
Growing adoption in regional airports and smaller terminals continues expanding the addressable market beyond traditional large international hub deployments.
The US Passenger Boarding Bridges Market Outlook
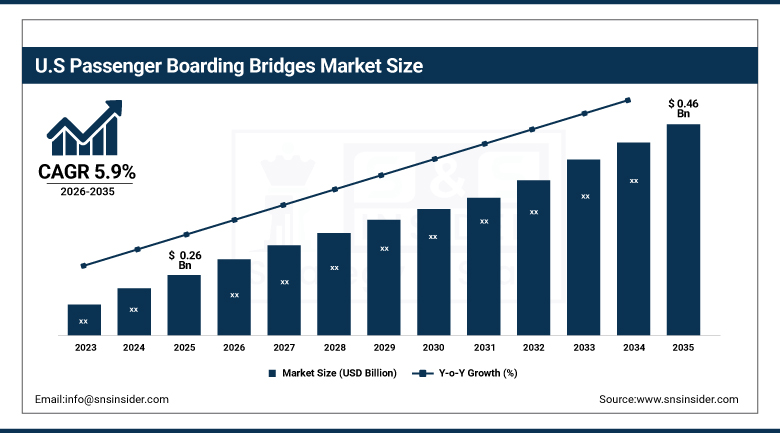
The US Passenger Boarding Bridges Market was valued at approximately USD 0.26 Billion in 2025 and is projected to reach approximately USD 0.46 Billion by 2035, registering a CAGR of approximately 5.9% from 2026 to 2035.
The demand for bridges in the US continued to be influenced by the modernization of major airports, as well as an increase in passengers' flow through such airports. The constant development of terminal construction and a focus on automated and safer boarding bridges were the main drivers of continuous purchases within the year. Increased recovery of passengers' flow in both domestic and international flights continued driving demand for not only installation of new bridges but also for modernization of existing ones at the terminal gates, while the increased investment into premium passenger experience infrastructure kept boosting demand for glass-walled and technologically advanced bridges in American airports.
John Bean Technologies Corporation continued growing their passenger boarding bridge manufacturing and services capabilities in 2025, addressing airport operators in the US who are looking for automated docking technology and modern bridge design able to accommodate various narrowbody and widebody aircrafts.
Passenger Boarding Bridges Market Segment Analysis
-
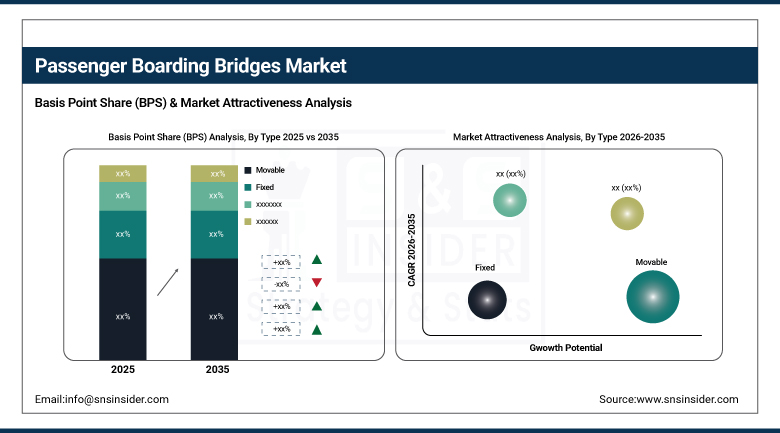
By Type, Movable led the market with an estimated 59.5% share in 2025 and was also the fastest-growing type, tracking a projected 8.3% CAGR.
-
By Model, Apron-Drive Bridge led the market with an estimated 41.3% share in 2025, while Over-The-Wing Bridge was the fastest-growing model, tracking a projected 8.9% CAGR.
-
By Technology, Electro-Mechanical led the market with an estimated 64.6% share in 2025, while Hydraulic was the fastest-growing technology.
-
By Structure, Steel-Walled led the market with an estimated 68.1% share in 2025, while Glass-Walled was the fastest-growing structure, tracking a projected 7.7% CAGR.
By Type, Movable led the market and grew fastest
Movable bridges held 59.5% of the market share in 2025, reflecting their genuine operational flexibility in accommodating a wide range of aircraft types and gate configurations across commercial airport terminals. That combination of adaptability and proven reliability across the broadest range of gate layouts kept movable bridges the dominant type category by a considerable margin over fixed alternatives.
Movable bridges are also expanding at the fastest CAGR among types during the forecast period, at approximately 8.3%. Recovery in global air travel combined with an unprecedented wave of terminal construction and expansion projects continues driving airports to prioritize the flexibility movable bridges provide, keeping this segment simultaneously the largest and fastest-expanding category as new terminal construction increasingly favors configurable, multi-aircraft-compatible boarding infrastructure over fixed alternatives.
By Model, Apron-Drive Bridge led the market, Over-The-Wing Bridge grew fastest
The Apron-Drive systems accounted for a revenue share of 41.3% in 2025 due to their ability to flexibly change according to the size of the aircraft and true integration with automated docking facilities. The preference of airlines and airport operators towards apron drive bridges was due to the safety and efficiency offered by the bridges for direct transfer of passengers from the boarding gate to the aircraft door without any delays, making this type the biggest single category in the market.
The Over-The-Wing systems are expected to witness the highest CAGR of around 8.9% amongst all the types during the forecast period. Increasing application of over-the-wing systems in the type of aircraft that requires a specialized boarding system is responsible for the increasing growth rate of over-the-wing bridges.
By Technology, Electro-Mechanical led the market, Hydraulic grew fastest
Electro-Mechanical bridges accounted for 64.6% of market revenue in 2025, reflecting the technology's genuine reliability and lower maintenance requirements relative to hydraulic alternatives. That combination of operational dependability and reduced servicing burden kept electro-mechanical systems the dominant technology across the broadest range of airport terminal deployments.
Hydraulic technology is recording accelerated growth among technology categories during the forecast period. Rising demand for bridges capable of handling heavier structural loads and providing smoother elevation control continues driving this growth, as certain premium terminal applications and larger bridge configurations increasingly favor hydraulic systems' genuine load-handling advantages over electro-mechanical alternatives.
By Structure, Steel-Walled led the market, Glass-Walled grew fastest
Steel-Walled designs maintained their market share of 68.1% in 2025 due to the high level of durability and cost-effectiveness in the widest application range of commercial airport and regional terminal use. Steel-walled bridge design was still dominating due to its high durability and cost-efficiency.
Glass-Walled designs are growing with the highest CAGR among other types of bridges, at the level of 7.7%. The growth is stimulated by growing investments in airport attractiveness and safety standards and increasing passenger flow at the international airports. Glass-walled bridges are still preferred in the modern airports due to transparency and natural light provided by them. The increasing popularity of glass-walled bridges at newly built terminals ensures that segment growth is outpacing steel-walled bridges' growth.
Regional Analysis
|
Region |
Major Country |
Share within Region, 2025 (%) |
|
Asia Pacific |
China |
34.60% |
|
North America |
United States |
78.95% |
|
Europe |
Germany |
23.75% |
|
Middle East and Africa |
UAE |
27.35% |
|
Latin America |
Brazil |
34.10% |
North America Passenger Boarding Bridges Market Insights
North America held a substantial share of global revenue, supported by modernization of large airports and increasing passenger traffic across the continent's major hub facilities. Recovery in global air travel continued driving sustained procurement of both new bridge installations and modernization retrofits at existing terminal gates throughout the year.
The United States accounted for roughly 78.95% of regional revenue, anchored by extensive airport terminal expansion projects and rising passenger traffic recovery. Canada added further regional demand through its own airport modernization investment, and that combined strength kept the continent a genuinely significant contributor to global passenger boarding bridges revenue.
Europe Passenger Boarding Bridges Market Insights
Europe accounted for significant revenues globally owing to the investments being made in the modernization of terminals and increasing focus on the infrastructure for providing superior passenger experience at major aviation airports across Europe. Increasing investments in the aesthetic appeal and safety standards of airports were fueling the adoption of glass-walled and automated docking bridges.
Germany led demand at roughly 23.75% of European revenue, supported by its substantial aviation infrastructure and continued terminal modernization investment. The UK and France contributed substantial additional demand, and continued European investment in premium airport infrastructure should keep regional demand climbing through the forecast period.
Asia Pacific Passenger Boarding Bridges Market Insights
Asia Pacific commanded 31.45% of 2025 revenue and is projected to grow at an 8.66% CAGR through the forecast period, driven by rapid airport infrastructure investment and expanding domestic and international air travel demand across the region's largest economies. That combination of new terminal construction and expanding passenger volume kept the region firmly positioned as the market's clear leader on both dominance and growth simultaneously.
China led the pack, supported by its massive airport construction and expansion program and rapidly growing domestic aviation market. India and Southeast Asian economies contributed meaningful additional demand, with rising middle-class air travel demand and continued government investment in airport infrastructure across the broader region continuing to reinforce Asia Pacific's structural leadership in both new installations and modernization retrofits.
Get Customized Report as per Your Business Requirement - Enquiry Now
MEA and Latin America Passenger Boarding Bridges Market Insights
The Middle East and Africa and Latin America both showed steady growth, driven by expanding airport infrastructure investment, growing air travel demand, and rising government focus on aviation sector modernization across both areas. As these markets continued building out modern terminal infrastructure, boarding bridge adoption grew correspondingly from a considerably smaller base than in more mature aviation markets.
Middle East/Africa region was dominated by the UAE on account of the country’s positioning as a large regional aviation center due to investments made into airport infrastructure. In addition, Saudi Arabia made another significant contribution to regional demand on account of investments into its aviation infrastructure. The biggest contributor of regional revenue from Latin America was Brazil due to increasing air travel demand.
Market Dynamics
Growth Drivers: Air Travel Recovery and Terminal Construction Expansion
Recovery in global air travel, combined with an unprecedented wave of terminal construction and expansion projects, continues underpinning market acceleration. Increasing air passenger traffic, airport expansions worldwide, and technological advancements in bridge design for enhanced efficiency and passenger experience continue serving as key driving factors for market growth.
With increasing numbers of people choosing air travel for both business and recreational purposes, airports continue being forced to increase their capacity and improve their services. This added passenger capacity provides genuinely higher demand for more streamlined boarding facilities, and passenger boarding bridges continue becoming an increasingly important part of modern airport infrastructure, streamlining the boarding and exiting of airplanes, especially during periods of heavy or adverse weather when covered, weather-protected boarding matters most.
Restraints: High Installation Costs and Terminal Retrofit Complexity
The substantial capital investment required for passenger boarding bridge installation and integration with existing terminal infrastructure continues posing a genuine restraint on faster market-wide expansion, particularly for smaller regional airports operating on constrained capital budgets. That cost profile has kept the most sophisticated bridge configurations concentrated among larger, well-resourced international hub airports.
The technical complexity of retrofitting boarding bridges into older terminal buildings not originally designed for modern bridge configurations continues posing genuine engineering challenges, as structural modifications and gate reconfiguration work often add meaningful cost and construction timeline beyond the bridge equipment itself. That retrofit complexity keeps full-terminal modernization a genuinely multi-year undertaking for many airport operators.
Opportunities: Regional Airport Expansion and Premium Passenger Experience Investment
Increasing adoption in regional airports and smaller terminals represents a genuinely significant opportunity, as commuter bridge and compact boarding solutions continue expanding the addressable market beyond traditional large international hub deployments. Vendors offering genuinely cost-effective, right-sized bridge solutions for smaller terminals stand to capture meaningful share as regional airport infrastructure investment continues expanding globally.
The increased emphasis on the aesthetic value of airport facilities and the premium passenger experience provides the second major opportunity for vendors, as modern bridge concepts are increasing their market presence against the backdrop of increasing traveler demand for premium terminal experience. Companies providing distinctive and aesthetic bridge solutions will be able to attract significant market share.
Recent Developments:
-
2025: Thyssenkrupp continued expanding its passenger boarding bridge manufacturing capability, targeting airport operators seeking modernized, automated docking-compatible bridge technology across major terminal expansion projects.
-
2025: CIMC Tianda continued advancing its glass-steel composite bridge product line, targeting airports seeking hybrid structures capable of withstanding environmental stress while maintaining modern architectural design flexibility.
-
2024: Mitsubishi Heavy Industries continued expanding its passenger boarding bridge product portfolio, targeting Asian and international airport operators seeking reliable, cost-effective terminal gate infrastructure for growing regional air travel demand.
Passenger Boarding Bridges Market key players are:
-
Thyssenkrupp AG
-
CIMC Tianda Holdings Co., Ltd.
-
Mitsubishi Heavy Industries, Ltd.
-
ShinMaywa Industries, Ltd.
-
Vataple Group Ltd.
-
Ameribridge, Inc.
-
The Boeing Company
-
Hangzhou XZB Tech Co., Ltd.
-
Curtiss-Wright Corporation
-
TCR International N.V.
-
Amsterdam Bridges International B.V.
-
Trepel Airport Equipment GmbH
-
DEW Engineering and Development ULC
-
Hydro Systems KG
-
ITW GSE ApS
-
Aviramp Limited
-
JBT AeroTech Corporation
Passenger Boarding Bridges Market Report Scope:
| Report Attributes | Details |
|---|---|
| Market Size in 2025 | USD 1.10 Billion |
| Market Size by 2035 | USD 1.97 Billion |
| CAGR | CAGR of 6.00% From 2026 to 2035 |
| Base Year | 2025 |
| Forecast Period | 2026-2035 |
| Historical Data | 2022-2024 |
| Report Scope & Coverage | Market Size, Segments Analysis, Competitive Landscape, Regional Analysis, DROC & SWOT Analysis, Forecast Outlook |
| Key Segments | • By Type (Movable, Fixed) • By Model (Apron-Drive Bridge, Commuter Bridge, Nose-Loader Bridge, Over-The-Wing Bridge, T-Bridge) • By Technology (Electro-Mechanical, Hydraulic) • By Structure (Steel-Walled, Glass-Walled) |
| Regional Analysis/Coverage | North America (US, Canada), Europe (Germany, UK, France, Italy, Spain, Russia, Poland, Rest of Europe), Asia Pacific (China, India, Japan, South Korea, Australia, ASEAN Countries, Rest of Asia Pacific), Middle East & Africa (UAE, Saudi Arabia, Qatar, South Africa, Rest of Middle East & Africa), Latin America (Brazil, Argentina, Mexico, Colombia, Rest of Latin America). |
| Company Profiles | Thyssenkrupp AG, John Bean Technologies Corporation, CIMC Tianda Holdings Co., Ltd., FMT Aircraft AB, ADELTE Group, Mitsubishi Heavy Industries, Ltd., ShinMaywa Industries, Ltd., Vataple Group Ltd., Ameribridge, Inc., The Boeing Company, Hangzhou XZB Tech Co., Ltd., Curtiss-Wright Corporation, TCR International N.V., Amsterdam Bridges International B.V., Trepel Airport Equipment GmbH, DEW Engineering and Development ULC, Hydro Systems KG, ITW GSE ApS, Aviramp Limited, JBT AeroTech Corporation |
Frequently Asked Questions
The Passenger Boarding Bridges Market is expected to grow at a CAGR of approximately 6.0% from 2026 to 2035, based on triangulated secondary research estimates.
The Passenger Boarding Bridges Market was valued at approximately USD 1.10 Billion in 2025, based on triangulation across multiple independent research sources.
The major growth factor is recovery in global air travel combined with an unprecedented wave of terminal construction and expansion projects worldwide.
The Movable segment dominated the Passenger Boarding Bridges Market by type, representing an estimated 59.5% of revenue in 2025.
Asia Pacific dominated the Passenger Boarding Bridges Market in 2025, holding an estimated 31.45% share of total global market revenue.
Get in Touch
