Pay TV Market Report Scope & Overview:
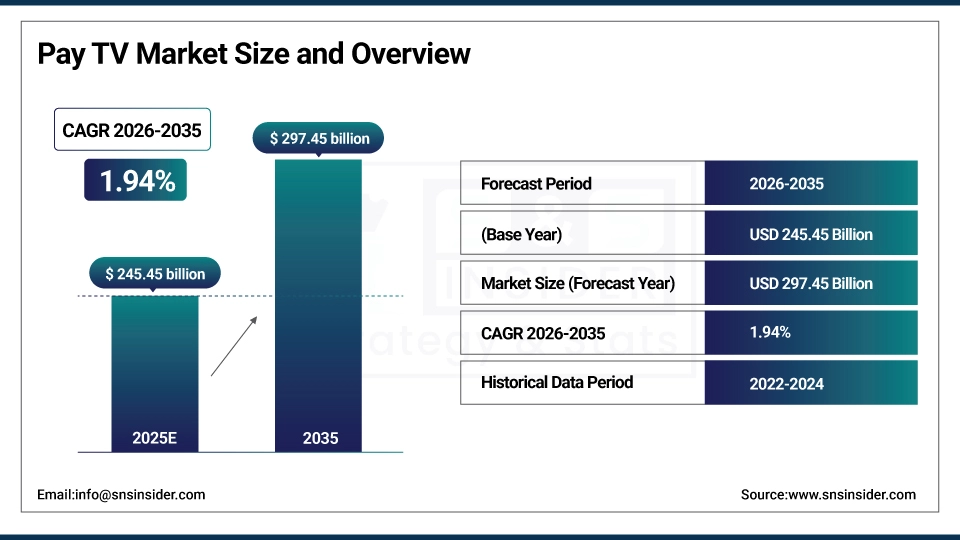
The Pay TV Market was valued at USD 245.45 billion in 2025 and is expected to reach USD 297.45 billion by 2035, growing at a CAGR of 1.94% from 2026-2035.
The Pay TV market remains buoyant, primarily due to the consistent demand for live sports, virtuous appetite for regional and local language content and for exclusive broadcast rights that streaming platforms could scarcely garner. Retention is also aided by bundle offering, better picture quality, and monetization on broadband and OTT platforms. Consolidation in subscribers continues, thanks to the rising discretionary income and the fast-developing digital infrastructure in emerging economy as well as the introduction of more streaming services.
Pay TV Market Size and Forecast
-
Market Size in 2025: USD 245.45 Billion
-
Market Size by 2035: USD 297.45 Billion
-
CAGR: 1.94% from 2026 to 2035
-
Base Year: 2025
-
Forecast Period: 2026–2035
-
Historical Data: 2022–2024
To Get more information on Pay TV Market - Request Free Sample Report
Pay TV Market Trends
-
Rising demand for high-quality video content and premium entertainment is driving the pay TV market.
-
Growing adoption of digital cable, satellite, and IPTV services is boosting market growth.
-
Expansion of HD, 4K, and on-demand content offerings is fueling subscriber engagement.
-
Increasing focus on personalized viewing, multi-screen access, and interactive features is shaping adoption trends.
-
Advancements in streaming integration, cloud DVR, and content recommendation engines are enhancing user experience.
-
Rising disposable income and urbanization are supporting market expansion.
-
Collaborations between content providers, telecom operators, and technology vendors are accelerating innovation and global adoption.
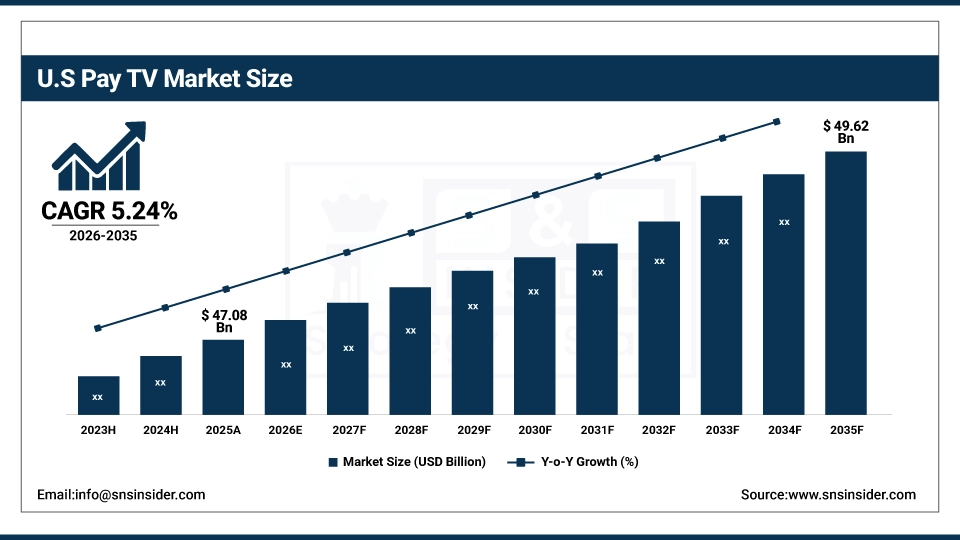
U.S. Pay TV Market was valued at USD 47.08 billion in 2025 and is expected to reach USD 49.62 billion by 2035, growing at a CAGR of 0.54% from 2026-2035.
The growth of the U.S. Pay TV market is steady despite slow adoption of hybrid Pay TV–OTT offerings by large providers that primarily focus on live sports and premium news as well as bundling of cable-internet services, and despite a loyal base of legacy subscribers.
Pay TV Market Growth Drivers:
-
High Demand for Exclusive Live Sports Content and Premium Channels Drives Continued the Pay TV Market Growth
The ongoing expansion of the market is driven by high consumer demand for stand-alone live sports content, as well as top tier leisure channels and cross-selling products. The unquenchable thirst for that kind of content is one of the primary reasons for the popularity of live TV services, particularly in the States where entities with NFL, NBA, and other marquee league access really are attracting eyeballs like moths to a flame. These timed and PAY services provide exclusivity of live events and keep the audience on their toes in this format. Even as streaming players make inroads, service providers strike a balance of content deals and partnerships to stay on-trend with shifting consumer preferences for experiences based on real-time viewing.
For example, in April 2024, Comcast extended its multiyear agreement with the NFL to renew exclusive Pay TV and affiliate rights for Thursday Night Football through 2024. This emphasizes the continued importance of channel exclusivity as a growth driver that helps maintain subscriber churn and prop up Pay TV against OTT competition.
Pay TV Market Restraints:
-
Cord-Cutting and Streaming Service Proliferation Significantly Restricts the Growth Potential of the Traditional Pay TV Market
Availability of internet and high-speed broadband have become the biggest threats to Pay TV industry, considering the evolving consumer preference towards flexible, lowest-cost, on-demand streaming from reliable platforms. Beyond 30% of the audience not satisfied with standard Fixed Pay TV Packages and high Subscription charges have progressed towards the likes of Netflix, Hulu, Disney+ who give custom made packages at a lower Subscription charge. It has also hastened cord-cutting, particularly among a mobile-first, cross-platform generation. The classic Pay TV model has been slow moving to adjust how and what we view, tempered by multi-year agreements, channel bundling and expense.
Pay TV Market Opportunities:
-
Emergence of Hybrid Pay TV Models Creates Significant Growth Opportunities in Response to Changing Viewer Preferences
The potential is in hybrid service models that leverage traditional cable and streaming. This is due to the need to hold on to customers whilst addressing the increasing demand for flexibility, multi-platform accessibility and cost savings. The introduction of hybrid offerings with live television and on-demand content in one interface contributes to enhanced user convenience and experience. And wonder if the streaming services will ride the wave, and whether Pay TV providers will be able to do smart set-top or smart cloud DVR, or a whole smart box (smart TV sets), in order to try to nip subscriber churn in the bud and at least make strides meeting contemporary viewing habits.
For instance, in March of 2024, Spectrum released its own "Xumo Stream Box" (in collaboration with Comcast), providing a hybrid Pay TV/streaming app platform. You're seeing this development as the industry seeks this semblance of convergence, with an attempt to provide a consistent viewing experience, circumvention of constraints posed by legacy TV models by bringing some of the flexibility of the Internet without losing the kernel of the Pay TV models' eyeball components.
Pay TV Market Segment Analysis
By Delivery Platform
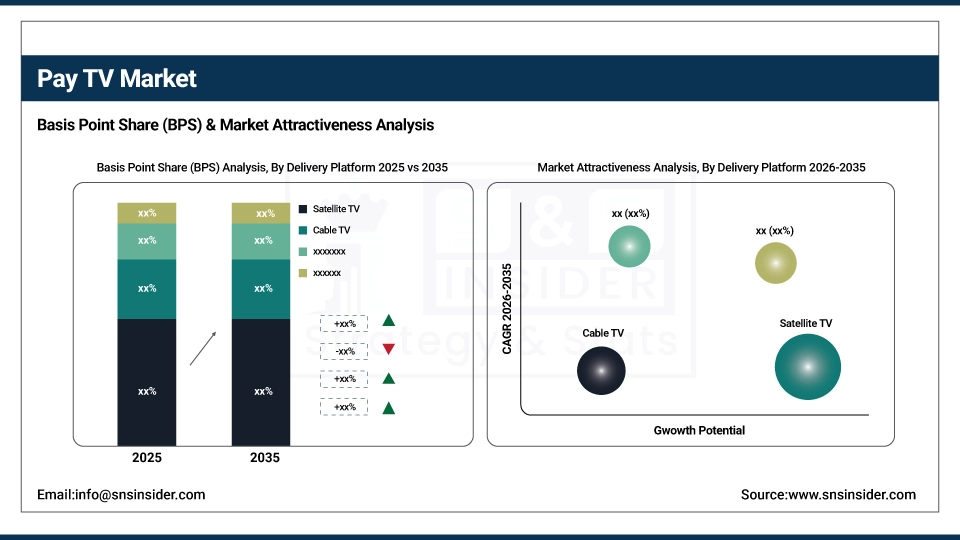
Satellite TV dominates the market with a 39% revenue share in 2025, mainly because of its overall rural coverage and superior broadcasting quality. The major players in the industry, such as DirecTV, have improved their HD services and combined them with DVR functionality to retain their customer base, particularly in regions with underdeveloped cable and IPTV networks. This is why Satellite TV remains an essential part of Pay TV’s revenue model.
IPTV benefits from its direct accessibility with Internet-enabled devices and the opportunity for customizing content delivery, which advances its growth, registering a CAGR of 3.60%. The major factor that is fuelling the growth of the IPTV industry is the consumer demand for flexible and on-demand access and interactive features such as pause, rewind, and recommendations. AT&T and Verizon have developed their IPTV offerings in 2025 with more 4K content and use with multiple devices aimed at a digital-first household.
By Revenue Model
The Subscription-Based model is the leading model, accounting for 57% of pay TV market share by value in 2025, as it targets stable revenue sources and high-quality bundles. As we can notice in the statistics, consumers continue to pay for SVOD and MVPD services for their exclusive content, ability to access multiple channels, and other benefits such as DVR functionality or parental controls. However, in 2025, Comcast changed its Xfinity bundle packages, and now you can customize the services and the value tier level of the apps you use.
The Ad-Supported + Subscription Hybrid model is growing at 2.96% CAGR as it balances affordability with content quality. Viewers increasingly accept ads in exchange for lower subscription fees, creating a win-win for providers and consumers. In early 2024, Hulu expanded its hybrid tier by integrating local channels and live news, appealing to value-conscious viewers. This dual-revenue stream supports sustained market growth and reflects the evolving economics of content consumption in the Pay TV ecosystem.
By Content Type
In 2025, entertainment will dominate the content type segment, with a revenue share of 49%, driven by consumer demand for drama, reality, and film content. And this drives longer retention times and higher content repeatability, both of which contribute to ad revenue and retention. HBO Max expanded its content offering in the Pay TV bundles in 2025, which drove the overall household penetration of the platform. This regular consumption of entertainment content proves the foundation of the ongoing value proposition that Pay TV maintains.
Sports is growing at a CAGR of 3.46% as it has the distinct advantage of being a real-time activity, and the audience loyalty is quite high. The live sports of the NFL, NBA, and global sports provide entertainment to the audiences every weekend. In mid-March 2024, ESPN renewed its Pay TV rights to broadcast games exclusively on linear and hybrid services. This agreement is a reflection of the importance of sports in the Pay TV space and the sports genre in the ever-changing media landscape.
By Customer
The residential segment commands a 65% revenue share in 2025, owing to the steady demand for home-based entertainment, particularly across families and older demographics. This audience still prefers the pay TV bundle convenience and accessibility. In early 2025, providers such as Spectrum began launching more family-centered channel packs, which boosted subscriber loyalty. Reflecting the size and stability of this segment, the domestic user accounts forms the backbone of Pay TV market overall.
Commercial segment, with a growing CAGR of 4.10%, driven by increasing usage in the hospitality, business, and institutional sectors. Currently, hotels and commercial establishments in general would like to have an entertainment offering that can be customized according to their needs. In February 2024, DISH Business Unveils New Bulk Package Offerings for the Lodging and Health Care Industries. This is a trend that indicates the growing commercial nature of non-residential establishments, which are an attractive growth opportunity in the pay-TV industry.
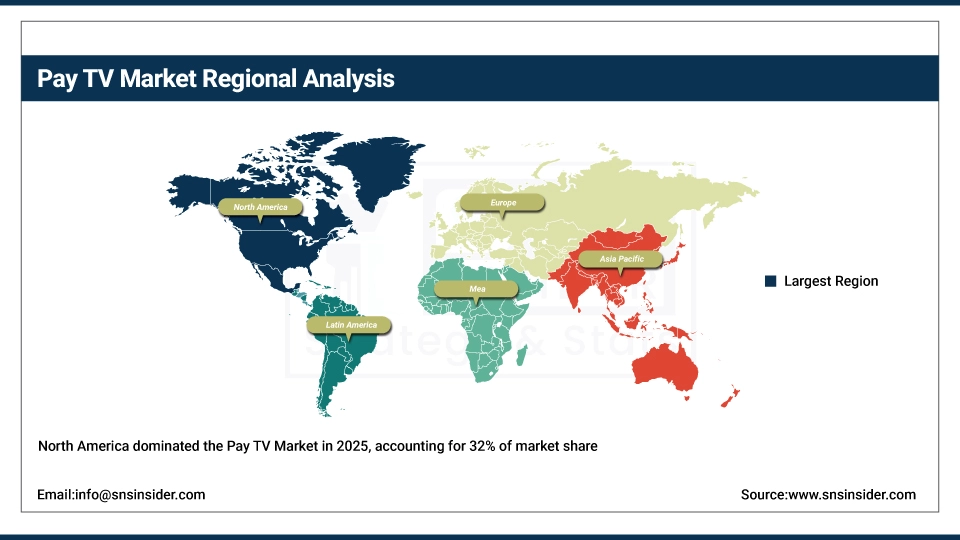
Pay TV Market Regional Analysis
North America Pay TV Market Insights
In 2025, North America held the highest share of Pay TV Market, contributing to 32% of the overall revenue. This is primarily due to the demand amongst pay-TV viewers for live sports, premium content and service bundles that remain only available via cable, satellite and IPTV services. Viewing infrastructure is extensive, with major players like Comcast and DirecTV that are prevalent in the region. US dominance in this region is driven by an extensive broadcasting infrastructure, a strong culture of entertainment consumption, and high expenditure on content rights, particularly for live sports and original content.
Get Customized Report as per Your Business Requirement - Enquiry Now
Asia Pacific Pay TV Market Insights
Asia Pacific is the fastest-growing market in the Pay TV Market, with a strong CAGR of 5.22% in 2025. The Internet penetration, affordable Pay TV services, and the need for multi-lingual content from a diverse consumer base are the factors that drive the growth. The Asia Pacific market is also driven by India, which is fueled by a large subscriber base, the need for regional content, and innovations in services that provide cost-effective access to satellite and OTT services, such as low-cost hybrid set-top boxes that are applicable in both urban and rural settings.
Europe Pay TV Market Insights
In the year 2025, Europe represents a well-established and stable part of the Pay TV Market, driven by strong IPTV penetration, widespread broadband networks, and consumer demand for bundled digital services. Support for media access and the transition to digital viewing patterns are key strengths for the region. Market innovations and competitive subscription rates further shape the market. The European market is led by the United Kingdom, driven by its high-tech broadcasting infrastructure and the adoption of hybrid viewing patterns before other European regions, as well as the ongoing commitment to premium sports and entertainment content by companies Sky and BT.
Middle East & Africa and Latin America Pay TV Market Insights
The Middle East & Africa and Latin America are to remain stable, driven by growing regional content demand and hybrid service adoption. In MEA, satellite coverage, the growth of Arabic-language content, and government attempts to digitize the broadcasting space in the region are all opening up opportunities, with the UAE soaring ahead of the rest of the region due to its infrastructure evolution and a more premium content tone. Brazil is the regional powerhouse in Latin America on the back of localized programming demand, a competitive provider landscape, and the integration of streaming options within traditional Pay TV services.
Pay TV Market Competitive Landscape:
Comcast Corporation
Comcast Corporation is a major global media and technology company, offering broadband, entertainment, and pay TV services through its Xfinity and NBCUniversal brands. The company offers content through cable, streaming, and mobile platforms, combining traditional TV with digital and on-demand experiences. Comcast Corporation concentrates on partnerships, platform development, and content acquisition to improve customer engagement. The company’s ecosystem comprises streaming apps, cable networks, and device integration, with the goal of offering flexible access to entertainment content.
-
2025: Comcast NBCUniversal expands entertainment options via multi-year deals with Amazon, offering Prime Video, Peacock, and Universal Pictures content on Xfinity X1 devices.
-
2025: Paramount and Comcast renew broad distribution agreements to continue offering Paramount networks, Paramount+, and Pluto TV to Xfinity pay TV customers.
-
2024: Comcast launches NOW brand, combining pay TV with low-cost internet and mobile, enabling flexible month-to-month access to TV content and streaming.
-
2024: Comcast and Warner Bros. Discovery sign multi-year content deals, expanding Xfinity TV and Sky UK access, including Max app integration.
AT&T Inc.
AT&T Inc. is a worldwide telecommunications giant that provides wireless, broadband, and pay TV services. As a historical leader in the U.S. pay TV market via DirecTV, AT&T has increasingly focused on connectivity, 5G, and business communications solutions. AT&T continues to optimize its portfolio by divesting non-core businesses to enhance its network infrastructure and digital offerings. Through its emphasis on broadband, mobile, and next-generation wireless solutions, AT&T aims to continue its leadership position in connectivity while lessening its dependence on traditional satellite TV businesses.
-
2025: AT&T completes sale of its remaining 70% stake in DirecTV to TPG, fully exiting traditional pay TV and focusing on wireless and broadband.
-
2024: AT&T initiates full exit from pay TV, selling DirecTV stake and enabling its planned acquisition by Dish Network for a larger U.S. pay TV provider.
Dish Network Corporation
Dish Network Corporation is a U.S. satellite television provider and digital pay TV innovator. Dish provides satellite TV services, Sling TV streaming products and programmatic advertising solutions for monetization. Builds Digital Platforms Integration, Demand Optimization and Consolidation for Strengthened Market Position In a pragmatic approach, Dish is using technology to enable flexible content delivery and multi-platform experiences and has ongoing collaborations with partners to expand its network, acquisition opportunities, and reimagined streaming strategies..
-
2024: DirecTV and Dish Network agree on a complex transaction framework, signaling consolidation of U.S. satellite pay TV providers, pending approvals and debt negotiations.
-
2024: DISH Media partners with PubMatic to enhance Sling TV ad demand and monetization, reflecting digital pay TV evolution and programmatic advertising trends.
Sky Group
Sky Group is a European media and entertainment company with satellite and IP TV services in the UK, Italy, and Germany. Sky provides high-end entertainment through platforms such as Sky Q, Sky Glass, Sky Stream, and streaming quality entertainment as well as sports, with substantial investments in original content. The company combining satellite infrastructure and IP delivery capabilities to deliver multi-platform experiences and increase consumer interactivity and reach. Sky, meanwhile, is building its position as a market leader by growing its content library and original sports rights, as well as studio production.
-
2024: Sky UK extends long-term satellite capacity partnership with SES, supporting Sky Q TV services and easing transition to IPTV through 2029.
-
2025: Sky Group invests in content production, expanding original programming and TV offerings via Sky Studios.
-
2025: Sky UK introduces enhanced Premier League coverage and Multiview live sports formats for Sky Glass, Sky Stream, and NOW TV customers.
Key Players
Some of the Pay TV Market Companies
-
Comcast Corporation
-
AT&T Inc.
-
Dish Network Corporation
-
Sky Group
-
Liberty Global
-
Vodafone Group
-
Orange S.A.
-
BT Group plc
-
Proximus Group
-
Deutsche Telekom AG
-
Charter Communications
-
Cox Communications
-
Altice U.S.
-
Tata Play
-
Bharti Airtel
-
Dish TV India
-
Reliance Jio
-
SK Telecom
-
Claro
-
Foxtel Group
-
Others
| Report Attributes | Details |
|---|---|
| Market Size in 2025 | USD 245.45 Billion |
| Market Size by 2035 | USD 297.45 Billion |
| CAGR | CAGR of 1.94% From 2026 to 2035 |
| Base Year | 2025 |
| Forecast Period | 2026-2035 |
| Historical Data | 2022-2024 |
| Report Scope & Coverage | Market Size, Segments Analysis, Competitive Landscape, Regional Analysis, DROC & SWOT Analysis, Forecast Outlook |
| Key Segments | • By Delivery Platform (Cable TV, Satellite TV, Internet Protocol Television (IPTV), Over-The-Top (OTT) Services) • By Revenue Model (Subscription-Based (SVOD / MVPD), Transactional (TVOD), Ad-Supported (AVOD) + Subscription Hybrid) • By Content Type (Entertainment, Sports, News, Kids/Family Programming) • By Customer Segment (Residential, Commercial (Hotels, Businesses, Institutions), Mobile/Remote Users) |
| Regional Analysis/Coverage | North America (US, Canada), Europe (Germany, UK, France, Italy, Spain, Russia, Poland, Rest of Europe), Asia Pacific (China, India, Japan, South Korea, Australia, ASEAN Countries, Rest of Asia Pacific), Middle East & Africa (UAE, Saudi Arabia, Qatar, South Africa, Rest of Middle East & Africa), Latin America (Brazil, Argentina, Mexico, Colombia, Rest of Latin America). |
| Company Profiles | Comcast Corporation, AT&T Inc., Dish Network Corporation, Sky Group, Liberty Global, Vodafone Group, Orange S.A., BT Group plc, Proximus Group, Deutsche Telekom AG, Charter Communications, Cox Communications, Altice USA, Tata Play, Bharti Airtel, Dish TV India, Reliance Jio, SK Telecom, Claro, Foxtel Group, and Others. |
Frequently Asked Questions
North America dominated the Pay TV Market in 2025.
The Satellite TV segment dominated the Pay TV Market.
The major growth factor of the Pay TV market is the sustained demand for live sports, exclusive content, and bundled channel offerings.
The Pay TV Market was valued at USD 245.45 billion in 2025 and is expected to reach USD 297.45 billion by 2035.
The Pay TV Market is expected to grow at a CAGR of 1.94% during 2026-2035.
Get in Touch
