Polyethylene Glycol Market Report Scope & Overview:
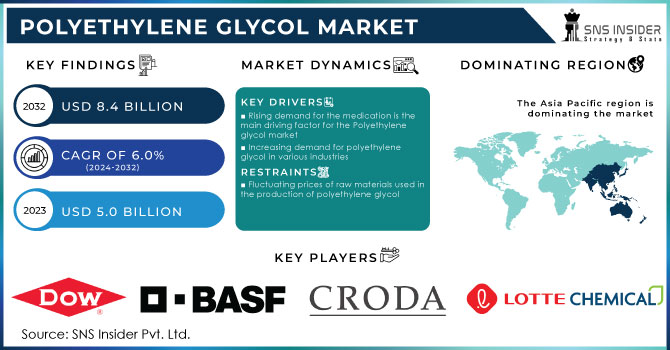
The Polyethylene Glycol Market Size was valued at USD 5.0 billion in 2023, and is expected to reach USD 8.4 billion by 2032, and grow at a CAGR of 6.0% over the forecast period 2024-2032.
Get E-PDF Sample Report on Polyethylene Glycol Market - Request Sample Report
The PEG market has grown tremendously due to the wide range of its application in pharmaceuticals, cosmetics, and industrial processes. PEG is among the polymers used for a lot of uses, such as in drug formulation, as a lubricant, and in a wide array of personal care product manufacturing; hence, it has opened demand in these various sectors, making the market dynamic. The rapidly growing adoption in the development of drug delivery systems in the pharmaceutical industry can be attributed to the fact that PEG is used as a supplement for improving the bioavailability of medications. Its high demand in cosmetics can be attributed to the role it plays as a solvent and emulsifier, particularly used in skincare and haircare products.
A factor driving the PEG market is related to continuous innovation and development in pharmaceutical applications. For instance, in April 2024, Merck KGaA unveiled a new path-breaking development with its PEGylation technology, enhancing the efficiency and stability of biopharmaceuticals. This highlights a growing focus on progress in the field of drug delivery systems and further reinforces the importance that PEG is gaining in the pharmaceutical industry. Similarly, in June 2024, Pfizer Inc. announced its progress in the utilization of PEG-based formulations towards new therapies for chronic diseases, which further surged the demand for high-quality PEG products.
New trends are emerging for the usage of PEG in several innovative baking recipes. In May 2024, L'Oréal Paris launched a new series of skincare products with high-power PEG molecules, adding elegance to textures and improving efficacy. The move plainly underlines the continuous industry pursuit of exploiting the properties of PEGs to further enhance cosmetic applications. In another event, in July 2024, Procter & Gamble extended the line on its personal care products that contain PEG-based ingredients, touting the benefits of smooth and more effective formulations.
The sector of industry also significantly contributes to the dynamics of the market for PEG. Among the key uses of PEG is its application as a surfactant in the preparation of paints and coatings. In March 2024, BASF announced that it will add a new PEG-based surfactant to its existing portfolio for industrial coatings to provide improved performance and environmental compatibility. This emphasizes the increasing significance of PEG in industrial applications and reflects the industry's push for more sustainable and efficient products.
Furthermore, the PEG market is changing regulatory developments on sustainability to gain traction. Just in February 2024, the European Chemicals Agency adopted a set of new guidelines for the use of PEG in consumer products, which were aimed at the safe use of these substances for people and the environment. The majority of these regulations are leading companies to innovate—and pursue newer and better safety standards that directly impact market dynamics. Moreover, companies like Dow Chemical are involved in funding research to develop bio-based alternatives to PEG due to the increased demand for green solutions. This tendency is for more sustainable practices within the PEG market, following wider industry trends toward sustainability and compliance.
Market Dynamics:
Drivers:
-
Rising demand for the medication is the main driving factor for the Polyethylene glycol market
The increased demand for medication acts as the main driving force behind the growth curve of the Polyethylene Glycol market. Because it is soluble, non-toxic, and increases the absorption of a drug, polyethylene glycol finds extensive use in the pharmaceutical industry as an excipient and drug delivery agent. For example, in May 2023, Pfizer Inc. utilized PEG in the development of its new formulation for a high demand vaccine that required PEG's stability and solubility properties to ensure its effectiveness. AbbVie used PEG in January 2024 within its innovative drug delivery system to improve the bioavailability of its rheumatoid arthritis medication, thus displaying a strategic move to improve therapeutic outcomes. As the occurrence of chronic diseases increases and the number of prescriptive drugs also increases, so does the demand for advanced drug delivery systems from pharmaceutical companies—thereby increasing the demand for PEG. In addition, the growing use of PEG in terms of drug modification and targeted delivery, due to increased demand for personalized medicine and biologics, further increased its market presence. This is an upward trend with investments and developments continuing to be made by key market players like Merck & Co., which, in March 2024 alone, announced a sharp ramp-up in PEG-based drug formulations targeting the treatment of rare genetic disorders, showing just how critical PEG has become in the effort to help address evolving medical needs and enhance drug efficacy.
-
Increasing demand for polyethylene glycol in various industries
The growing application demand from various industries is one of the major factors driving the growth of the PEG market, as different areas of application are indicative of its versatility. The significant applications of PEG extend beyond pharmaceuticals into industries such as cosmetics, agriculture, and industrial processes. In cosmetics, PEG is found in many products—so-called moisturizers and shampoos—to which it is added because of its emollient and solvent properties. For instance, in April 2023, L'Oréal formulated PEG in its new line of anti-aging creams for texture and efficacy. In agriculture, the application of PEG as a soil conditioner and in controlled-release fertilizers is gathering noteworthy momentum. For instance, Syngenta launched a PEG-based formulation in August 2023 to enhance delivery and stability of nutrients in its new range of agricultural products. Moreover, the industrial sector has also continued to utilize PEG in a number of manufacturing processes, including as a lubricant and surfactant. For example, in January 2024, BASF launched a new PEG-based lubricant developed for high-performance machinery, illustrating its uses in maximizing operational efficiency. This augmented range of PEG uses across industries underlines its expanding applicability and acts as a market growth driver.
Restraints:
-
Fluctuating prices of raw materials used in the production of polyethylene glycol
The varying prices of raw materials used in manufacturing polyethylene glycol are a major constraint on the market in terms of production costs and overall profitability. The prices of basic raw materials for PEG, comprising ethylene oxide and ethylene glycol, are very volatile due to frequent changes in crude oil prices and disturbances in the supply chain. For instance, in June 2023 ethylene oxide prices suddenly surged on supply shortages and geopolitical tensions, making the manufacture of PEG increasingly difficult for Dow Chemical. And in September 2023, the prevalence of tectonic movement in the crude oil markets drove prices for ethylene glycol up, therefore eroding the profitability margin for PEG manufacturing by companies like Sabic. In addition, these price fluctuations only have an adverse impact on the budget of a manufacturer, thereby sending the costs spiraling upwards for the final consumer, or rather inhibiting growth, resulting in an uncertain market growth and stabilization of PEG supplies and prices.
Opportunities:
-
Increasing adoption of PEG as an additive in paint and coatings
The growing use of PEG as an additive in the paint and coating industry opens up a wonderful avenue for market growth, since it has the potential to improve product performance and application. PEG finds its applications in paints and coatings as a dispersant, thickener, and solvent in bringing about a better texture, stability, and durability in the finished products. For example, in July 2023, AkzoNobel introduced PEG into its new line of eco-friendly paints, targeting its ability to enhance uniformity and smoothness in coatings, particularly in water-borne formulations. In the context of emerging consumer demand for premium and eco-friendly paints with no performance compromise, this will be very key. In February 2024, PPG Industries introduced a range of industrial coatings with PEG to improve flexibility and improve weathering, targeting their automotive and construction market products. The inclusion of PEG as one of its leading additives, with developing demand for uniquely functional broad spectrum coatings, more specifically in perhaps the nations leaning heavily on the principles of sustainability and durability, manufacturers capture more significant market competitiveness. This trend highlights the opportunity for PEG producers to produce more and profit from the higher incorporation of PEG in value-added, novel paint, and coating solutions, thus further enhancing market growth.
Challenges:
-
Stringent regulations imposed by environmental agencies regarding the use of Polyethylene Glycol
The strictness of regulations regarding the use and disposal of polyethylene glycol acts as a major constraint to the growth of the market, as compliance costs increase and complicate its application in other industries. In this respect, regulatory agencies, particularly in Europe and North America, enforce strict guidelines to ensure PEG is used and environment-friendly, considering the risks it may pose towards ecology. For instance, in March 2023, the European Chemicals Agency tightened its guidance, placing a stricter cap on the emission of PEG-containing industrial waste, thereby compelling Clariant and other companies to invest in top-notch waste treatment technologies. In contrast, the U.S. in November 2023—. In 2019, the Environmental Protection Agency tightened controls over the level of PEG content in pharmaceutical and cosmetic products. These raised the burden of production processes to companies such as Johnson & Johnson. Not only do regulatory pressures increase operational costs but also make the process of getting approval and launching new PEG-based products very complex, hence a big challenge for manufacturers to maintain their compliance status and sustain profitability.
KEY MARKET SEGMENTS
By Form
In 2023, the opaque liquid segment dominated and contributed the largest share to the polyethylene glycol market, resulting from large-scale use in pharmaceutical and personal care products. This is forecasted to capture a share of more than 45%, thus showing an extended valuation across several industries. For instance, in April 2023, Unilever manufactured a large quantity of PEG-based liquid formulations for their skincare, thereby reaping exceptional solubility properties from the opaque liquid form, thus easily incorporating it into liquid-based applications. Its liquid form has a wide range of uses and is in high demand in products such as creams, lotions, and liquid pharmaceuticals; thus, this segment dominated the market and emerged as the most prominent in the PEG market in 2023.

Get Customized Report as Per Your Business Requirement - Request For Customized Report
By Application
The medical segment dominated and accounted for as high as close to 50% of the PEG market in 2023. This high segment share can mainly be attributed to the use of PEG in the pharmaceutical industry either as excipients, a drug delivery agent, and in formulations for laxatives and other medicines. For example, in March 2023, Pfizer significantly expanded production of PEG-based drug products, including injectables, as the manufacturer recognized PEG ability to bring about higher solubility and stability for these products. Increased demand for sophisticated and efficient drug delivery systems, coupled with the rapid spread of chronic diseases, has increased demand for PEG in the pharmaceutical industry, thus amplifying the dominance of this segment.
Regional Analysis
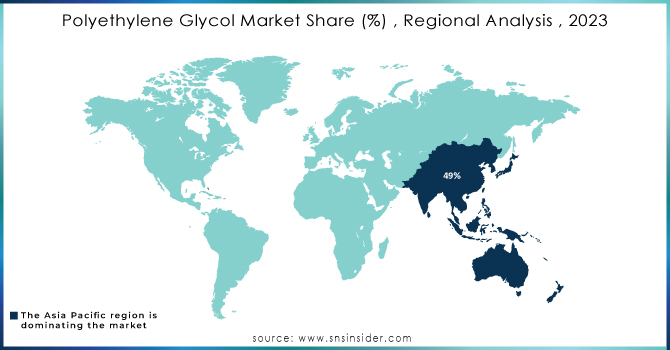
The Asia Pacific dominated the Polyethylene Glycol Market with a revenue share of about 49% in 2023. It is primarily attributed to the rapid industrial growth of the pharmaceutical, automotive, and construction sectors in India and China. Moreover, growing healthcare spending, coupled with an enormous demographic landscape, is expected to create new opportunities for the polyethylene glycol market in the forthcoming future. The pharmaceutical industry is regarded as the principal growth driver of the Chinese economy, and the sector, over the years, has recorded an enormous domestic production investment. These are the factors which accelerate the growth of the Polyethylene Glycol Market in the region.
Moreover, North America accounted for a substantial revenue share of 35% in the polyethylene glycol market and is expected to grow during the forecast period at a CAGR of approximately 6.3%. According to the U.S. Energy Information Administration, current crude oil production in the region is about 11.2 million barrels per day. This, along with the high growth witnessed in the cosmetics & personal care and food industries, is impelling the demand for Polyethylene Glycol. Growth in the North American cosmetics & personal care market is driven by increasing customer demand for multifunctional personal care products and busy lifestyles, along with an increase in the employed population. Also, the dominance of the United States of America in the pharmaceutical industry is likely to boost the Polyethylene Glycol market in the North American region.
Key Players
The major key players are Dow Chemical Company, BASF, Croda, INEOS, India Glycols, LOTTE CHEMICAL, Shanghai Bronkow Chemical, Liaoning Oxiranchem, Jiangsu Haian Petrochemical Plant, Taijie Chemical, and other key players mentioned in the final report.
Recent Developments
-
July 2024: BASF SE received the ISCC+ certification for its product line of Acrylics, Glycol Ethers, Alcohols, and Acetates.
-
May 2024: INEOS Group Ltd. completed the acquisition of the ethylene oxides and derivatives business and the related manufacturing sites in Bayport, Texas, from LyondellBasell.
-
February 2024: Evonik Industries AG partnered with the University of Mainz to commercialize randomized polyethylene glycols and also plans to introduce technical-grade rPEG-lipids by mid-2024.
-
June 2023: BASF commenced construction on a polyethylene (PE) plant at its Verbund site in Zhanjiang, China. This facility, boasting an annual capacity of 500,000 metric tons of PE, aims to cater to the rapidly growing demand in China. The plant is expected to start its operation from 2025.
-
Polyethylene Glycol Market Report Scope
Report Attributes Details Market Size in 2023 US$ 5.0 Billion Market Size by 2032 US$ 8.4 Billion CAGR CAGR of 6.0% From 2024 to 2032 Base Year 2023 Forecast Period 2024-2032 Historical Data 2020-2022 Report Scope & Coverage Market Size, Segments Analysis, Competitive Landscape, Regional Analysis, DROC & SWOT Analysis, Forecast Outlook Key Segments • By Form (White waxy solid, Opaque liquid, and Flakes/ Powder)
• By Application (Medical, Building and Construction, Personal Care, Automotive, and Others)Regional Analysis/Coverage North America (US, Canada, Mexico), Europe (Eastern Europe [Poland, Romania, Hungary, Turkey, Rest of Eastern Europe] Western Europe] Germany, France, UK, Italy, Spain, Netherlands, Switzerland, Austria, Rest of Western Europe]), Asia Pacific (China, India, Japan, South Korea, Vietnam, Singapore, Australia, Rest of Asia Pacific), Middle East & Africa (Middle East [UAE, Egypt, Saudi Arabia, Qatar, Rest of Middle East], Africa [Nigeria, South Africa, Rest of Africa], Latin America (Brazil, Argentina, Colombia, Rest of Latin America) Company Profiles Dow Chemical Company, BASF, Croda, INEOS, India Glycols, LOTTE CHEMICAL, Shanghai Bronkow Chemical, Liaoning Oxiranchem, Jiangsu Haian Petrochemical Plant, Taijie Chemical and other players Key Drivers • Non-toxic nature and biodegradability of polyethylene glycol
• Rising demand for the medication is the main driving factor for the Polyethylene glycol market
• Increasing demand for polyethylene glycol in various industriesRESTRAINTS • Fluctuating prices of raw materials used in the production of polyethylene glycol
Frequently Asked Questions
Yes, you can ask for the customization as per your business requirement.
The Asia Pacific region dominated the Polyethylene Glycol Market.
BASF, Dow Chemical Company, INEOS, Croda, India Glycols, Taijie Chemical, LOTTE CHEMICAL, Liaoning Oxiranchem, Jiangsu Haian Petrochemical Plant, Shanghai Bronkow Chemical are the key players in the Polyethylene Glycol Market.
The projected market size for the Polyethylene Glycol Market is USD 8.4 billion by 2032.
The Compound Annual Growth rate for the Polyethylene Glycol Market over the forecast period is 6.0%.
Get in Touch
