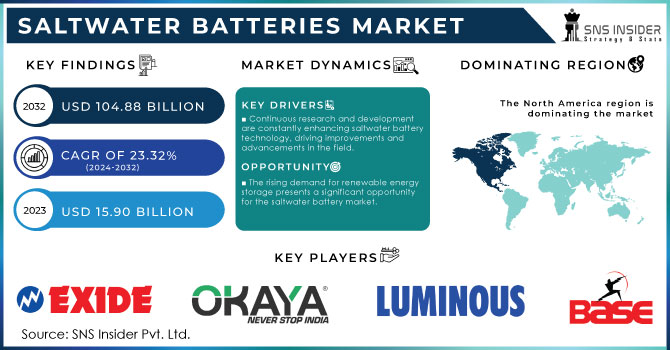
The Saltwater Batteries Market, valued at USD 15.92 billion in 2023, is expected to reach USD 105.03 billion by 2032, growing at a CAGR of 23.32% from 2024-2032. The leading trends include increasing technology adoption, improvements in energy density and performance metrics, and expanding emphasis on carbon footprint reduction and sustainability. Furthermore, investments in R&D are helping innovation & development in battery performance, which are further aiding the growth of this market.
Get More Information on Saltwater Batteries Market - Request Sample Report
Drivers:
The growing demand for cleaner energy is boosting the adoption of eco-friendly saltwater batteries over traditional lithium-ion options.
The ongoing shift towards cleaner energy worldwide is driving demand for sustainable energy storage systems. Eco-friendly saltwater batteries are emerging as a promising alternative to conventional lithium-ion batteries, as they have a lower environmental footprint while addressing issues related to resource scarcity and pollution. As renewable energy demand rises, companies like Salgenx are leading the charge on saltwater-based grid-scale storage systems. However, technologies such as sodium-zinc hybrid batteries with hydrogel electrolytes and E-Dina's Water Light (which produces light from saltwater or urine) have blown the lid off energy storage, proving that sustainability can change the game.
Restraints:
Energy density and high material costs limit the adoption of saltwater batteries in sectors like electric vehicles and grid storage.
Saltwater batteries, including Zn–SA–PSN hydrogel electrolyte-containing saltwater batteries, are capable of achieving a performance of 220 Wh·kg⁻¹ and a 5 C capacity, but they are restricted by their reduced energy density compared with that of lithium-ion batteries (LIBs) in applications within the high-energy field, such as electric vehicles and grid storage. While hybrid-ion batteries have significant sustainability potential, their higher material costs, despite efforts to explore cheaper alternatives such as iron, present a considerable barrier to market adoption. These challenges in energy density and cost hinder the broader use of saltwater batteries, affecting their competitiveness in the rapidly growing energy storage market.
Opportunities:
Exploring the Role of Saltwater Batteries in Grid-Scale Energy Storage
As the demand for sustainable and reliable energy storage solutions grows, saltwater batteries offer significant potential for grid-scale applications, particularly in renewable energy systems. These batteries are particularly useful for bulk storage, allowing them to moderate supply and demand, and making it easier to embrace cleaner energy. Saltwater batteries are an eco-friendly alternative that, due to their lower environmental impact than traditional lithium-ion batteries, align with the worldwide movement toward sustainability. NaS batteries are a type of energy storage solution that can be deployed effectively, used between connected groups of varying scales, and can benefit from an increasing investment in energy storage projects across the world as grid resilience policies are passed and renewable energy is integrated.
Restraints:
Energy efficiency challenges in saltwater batteries limit their competitiveness in high-energy applications.
Despite being eco-friendly, saltwater batteries face significant challenges in terms of energy efficiency, particularly when compared to advanced technologies like lithium-ion batteries. Their performance, especially in fast-charging scenarios, still needs to improve to meet the demands of high-performance applications like electric vehicles and portable devices. Their performance, particularly at fast-charging pending, are still doing not satisfy utility needs in high-performance applications such same electric vehicles and portable devices. Recent progress with sodium energy storage systems, including high-efficiency batteries with 86% energy efficiencies, has shown promise, but saltwater batteries still fall short of achieving competitive energy output. In a particular case, a sodium-air battery showed enhanced energy density and maintained charge efficiency after 200 cycles, displaying considerable prospects for performance optimization. Saltwater batteries need more innovation to provide greater energy efficiency and performance to be competitive and applicable to a broad range of industries.
By Type
In 2023, the 48-volt segment dominated the saltwater batteries market, accounting for 55% of the total market share. This growth is fueled by the rising need for energy storage in sectors like renewable energy, grid storage, and electric vehicles (EVs). Due to the use of environmental friendly components, saltwater batteries can store energy stored at a medium level, but they lack the safety risks associated with lithium-ion batteries. The new 48-volt systems are a preferred choice with increased thermal stability and durability as our demand for renewable energy increases. Advances in technology continue to drive down the cost of these systems, and they will have a role in future sustainable energy solutions and the strengthening of the resilience of the grid.
The 24-volt segment is expected to be the fastest-growing in the saltwater battery market from 2024 to 2032, driven by increasing demand for cost-effective, medium-scale energy storage in residential, commercial, and off-grid systems. As demand rises for relatively inexpensive, medium-scale energy storage in residential, commercial, and off-grid systems. Providing a cheaper alternative to 48-volt systems, 24-volt saltwater batteries are suited for smaller, decentralized energy applications, especially those in locations with unreliable grid infrastructure. They are also cheaper, more environmentally friendly, non-combustible, and have higher efficiency gains, making them desirable for renewable energy systems such as home solar panels.
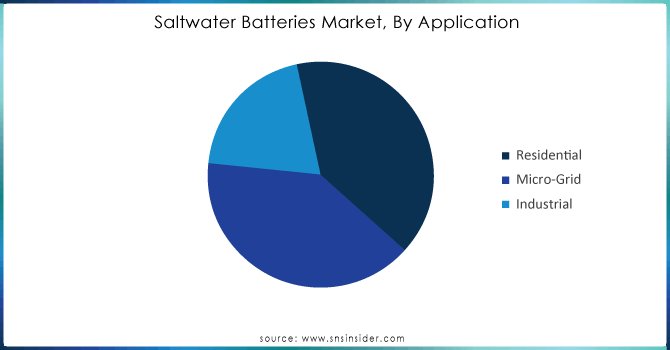
By Application
In 2023, the residential segment held the largest revenue share in the saltwater batteries market, accounting for approximately 39%. Due to the growing adoption of renewable energy sources including solar, rising demand for off-grid energy storage systems for homes, and growing energy efficiency investment. Saltwater batteries will certainly provide a cheaper, eco-friendly solution to lithium-ion batteries with less toxic properties and improved safety. With an increasing number of households looking to adopt reliable back-up power and energy storage systems for optimizing solar energy usage, the residential segment is projected to maintain its expansion trajectory powered by innovations in efficiency and affordability.
The industrial segment is expected to be the fastest-growing segment in the saltwater batteries market from 2024 to 2032. The large-scale industrial applications such as manufacturing facilities, warehouses, as well as energy-intensive operations have strengthened the demand for energy storage, which is driving the market growth. Saltwater batteries, with their enhanced safety, lower cost, and eco-friendly features, offer an ideal solution for industries looking to store renewable energy, reduce dependence on the grid, and optimize energy consumption. Industries are prioritizing sustainability and minimizing carbon footprints and the industrial segment is expected to grow significantly due to technological advancements and increasing regulatory support for green energy solutions.
Get Customized Report as per Your Business Requirement - Request For Customized Report
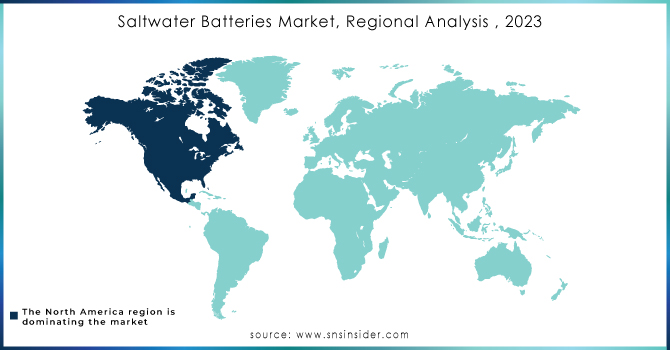
In 2023, North America dominated the saltwater batteries market, capturing around 40% of the total market share. This dominance is attributed to strong investments in renewable energy, grid modernization projects, and increasing government support for green technologies. The United States, in particular, is a major player, with an increasing emphasis on new energy alternatives and transitioning to cleaner energy means. Tax incentives for renewable energy systems and environmental regulations encourage the use of saltwater batteries in energy storage applications. The countries market leadership is further driven by innovative breakthroughs in battery technology due to rising demand for sustainable and economical replacements to lithium-ion batteries.
Asia-Pacific is expected to be the fastest-growing region in the saltwater battery market from 2024 to 2032. Due to Rapid industrialization, rising renewable energy adoption, and governmental efforts to lower carbon emissions are driving this growth. Through an investment in sustainable energy solutions, with energy storage systems such as saltwater batteries, nations such as China, India, and Japan are ready to facilitate the shift toward greener energy. The region's emphasis on renewable energy sources, including solar and wind, as well as the need to produce cost-effective and environmentally friendly energy; storage is driving the adoption of saltwater batteries in the region. In particular, the Asia-Pacific market growth is further driven by increasing demand for decentralized energy systems and off-grid solutions in rural and remote areas.
Some of the major key players in Saltwater Batteries Market along with their product:
Aquion Energy (USA) - Saltwater Batteries
BlueSky Energy (Germany) - Lithium-ion and Saltwater Batteries
Green Energy Storage (USA) - Energy Storage Solutions
SaltX Technology (Sweden) - Saltwater Batteries
ESS Inc. (USA) - Iron Flow Batteries
Faradion Limited (UK) - Sodium-ion Batteries
NantEnergy (USA) - Zinc-air Batteries
Zinc8 Energy Solutions (Canada) - Zinc-air Flow Batteries
Invinity Energy Systems (UK) - Vanadium Flow Batteries
Redflow Limited (Australia) - Zinc-bromine Flow Batteries
EnerVault (USA) - Vanadium Flow Batteries
Primus Power (USA) - Zinc-based Flow Batteries
ViZn Energy Systems (USA) - Zinc-iron Flow Batteries
Eos Energy Storage (USA) - Zinc Hybrid Cathode Batteries
Ambri Inc. (USA) - Liquid Metal Batteries
CellCube Energy Storage Systems Inc. (Canada) - Vanadium Flow Batteries
Sonnen GmbH (Germany) - Lithium-ion Batteries for Energy Storage
UniEnergy Technologies (USA) - Vanadium Flow Batteries
Lockheed Martin (USA) - Advanced Energy Storage Solutions
Sumitomo Electric Industries Ltd. (Japan) - Lithium-ion Batteries and Energy Storage Systems
List of Suppliers who provide Raw material and Component in Saltwater Batteries market:
ESS Tech, Inc. (USA)
Aquion Energy (USA)
BlueSky Energy (Austria)
Innolith AG (Switzerland)
Zynth Energy (India)
Bettery, Inc. (USA)
Salgenx (USA)
Stafl Systems (USA)
Greenrock (Bluesky Energy brand) (Austria)
Seawater Battery Systems (South Korea)
5th February 2025 – Sumitomo Electric started the 4,000 kW redox flow battery business in the Oki Islands to expand renewable energy and strengthen disaster resilience The system is long-lived, very safe to use, and maintenance friendly.
February 6, 2025 – Energy and storage company ESS Tech is also thriving as AI data centers accelerate demand for long-duration energy storage through its iron redox flow batteries They are more fire-resistant than lithium-ion batteries.
Report Attributes | Details |
Market Size in 2023 | USD 15.92 Billion |
Market Size by 2032 | USD 105.03 Billion |
CAGR | CAGR of 23.32% From 2024 to 2032 |
Base Year | 2023 |
Forecast Period | 2024-2032 |
Historical Data | 2020-2022 |
Report Scope & Coverage | Market Size, Segments Analysis, Competitive Landscape, Regional Analysis, DROC & SWOT Analysis, Forecast Outlook |
Key Segments | • By Type(12 Volt, 24 Volt, 48 Volt) • By Application(Residential, Micro-Grid, Industrial) |
Regional Analysis/Coverage | North America (US, Canada, Mexico), Europe (Eastern Europe [Poland, Romania, Hungary, Turkey, Rest of Eastern Europe] Western Europe] Germany, France, UK, Italy, Spain, Netherlands, Switzerland, Austria, Rest of Western Europe]), Asia Pacific (China, India, Japan, South Korea, Vietnam, Singapore, Australia, Rest of Asia Pacific), Middle East & Africa (Middle East [UAE, Egypt, Saudi Arabia, Qatar, Rest of Middle East], Africa [Nigeria, South Africa, Rest of Africa], Latin America (Brazil, Argentina, Colombia, Rest of Latin America) |
Company Profiles | Aquion Energy (USA), BlueSky Energy (Germany), Green Energy Storage (USA), SaltX Technology (Sweden), ESS Inc. (USA), Faradion Limited (UK), NantEnergy (USA), Zinc8 Energy Solutions (Canada), Invinity Energy Systems (UK), Redflow Limited (Australia), EnerVault (USA), Primus Power (USA), ViZn Energy Systems (USA), Eos Energy Storage (USA), Ambri Inc. (USA), CellCube Energy Storage Systems Inc. (Canada), Sonnen GmbH (Germany), UniEnergy Technologies (USA), Lockheed Martin (USA), and Sumitomo Electric Industries Ltd. (Japan). |
Ans: The Saltwater Batteries Market is expected to grow at a CAGR of 23.32%
Ans: Saltwater Batteries Market size was USD 15.92 billion in 2023 and is expected to Reach USD 105.03 billion by 2032.
Ans: Continuous research and development are constantly enhancing saltwater battery technology, driving improvements and advancements in the field.
Ans: Saltwater batteries generally exhibit a lower energy density when compared to alternative energy storage solutions such as lithium-ion batteries.
Ans: .The North America is dominating in the Saltwater Batteries market
Table of Content
1. Introduction
1.1 Market Definition
1.2 Scope (Inclusion and Exclusions)
1.3 Research Assumptions
2. Executive Summary
2.1 Market Overview
2.2 Regional Synopsis
2.3 Competitive Summary
3. Research Methodology
3.1 Top-Down Approach
3.2 Bottom-up Approach
3.3. Data Validation
3.4 Primary Interviews
4. Market Dynamics Impact Analysis
4.1 Market Driving Factors Analysis
4.1.2 Drivers
4.1.2 Restraints
4.1.3 Opportunities
4.1.4 Challenges
4.2 PESTLE Analysis
4.3 Porter’s Five Forces Model
5. Statistical Insights and Trends Reporting
5.1 Technology Adoption Rate, by Region
5.2 Energy Density & Performance Metrics, by Region
5.3 Carbon Footprint and Sustainability Metrics, by Region
5.4 R&D Investment and Innovation
6. Competitive Landscape
6.1 List of Major Companies, By Region
6.2 Market Share Analysis, By Region
6.3 Product Benchmarking
6.3.1 Product specifications and features
6.3.2 Pricing
6.4 Strategic Initiatives
6.4.1 Marketing and promotional activities
6.4.2 Distribution and supply chain strategies
6.4.3 Expansion plans and new product launches
6.4.4 Strategic partnerships and collaborations
6.5 Technological Advancements
6.6 Market Positioning and Branding
7. Saltwater Batteries Market Segmentation, by Type
7.1 Chapter Overview
7.2 12 Volt
7.2.1 12 Volt Market Trends Analysis (2020-2032)
7.2.2 12 Volt Market Size Estimates and Forecasts to 2032 (USD Billion)
7.3 24 Volt
7.3.1 24 Volt Market Trends Analysis (2020-2032)
7.3.2 24 Volt Market Size Estimates and Forecasts to 2032 (USD Billion)
7.3 48 Volt
7.3.1 48 Volt Market Trends Analysis (2020-2032)
7.3.2 48 Volt Market Size Estimates and Forecasts to 2032 (USD Billion)
8. Saltwater Batteries Market Segmentation, by Application
8.1 Chapter Overview
8.2 Residential
8.2.1 Residential Market Trends Analysis (2020-2032)
8.2.2 Residential Market Size Estimates and Forecasts to 2032 (USD Billion)
8.3 Micro-Grid
8.3.1Micro-GridMarket Trends Analysis (2020-2032)
8.3.2 Micro-Grid Market Size Estimates and Forecasts to 2032 (USD Billion)
8.4 Industrial
8.4.1Industrial Market Trends Analysis (2020-2032)
8.4.2 Industrial Market Size Estimates and Forecasts to 2032 (USD Billion)
9. Regional Analysis
9.1 Chapter Overview
9.2 North America
9.2.1 Trends Analysis
9.2.2 North America Saltwater Batteries Market Estimates and Forecasts, by Country (2020-2032) (USD Billion)
9.2.3 North America Saltwater Batteries Market Estimates and Forecasts, by Type (2020-2032) (USD Billion)
9.2.4 North America Saltwater Batteries Market Estimates and Forecasts, by Application (2020-2032) (USD Billion)
9.2.5 USA
9.2.5.1 USA Saltwater Batteries Market Estimates and Forecasts, by Type (2020-2032) (USD Billion)
9.2.5.2 USA Saltwater Batteries Market Estimates and Forecasts, by Application (2020-2032) (USD Billion)
9.2.6 Canada
9.2.6.1 Canada Saltwater Batteries Market Estimates and Forecasts, by Type (2020-2032) (USD Billion)
9.2.6.2 Canada Saltwater Batteries Market Estimates and Forecasts, by Application (2020-2032) (USD Billion)
9.2.7 Mexico
9.2.7.1 Mexico Saltwater Batteries Market Estimates and Forecasts, by Type (2020-2032) (USD Billion)
9.2.7.2 Mexico Saltwater Batteries Market Estimates and Forecasts, by Application (2020-2032) (USD Billion)
9.3 Europe
9.3.1 Eastern Europe
9.3.1.1 Trends Analysis
9.3.1.2 Eastern Europe Saltwater Batteries Market Estimates and Forecasts, by Country (2020-2032) (USD Billion)
9.3.1.3 Eastern Europe Saltwater Batteries Market Estimates and Forecasts, by Type (2020-2032) (USD Billion)
9.3.1.4 Eastern Europe Saltwater Batteries Market Estimates and Forecasts, by Application (2020-2032) (USD Billion)
9.3.1.5 Poland
9.3.1.5.1 Poland Saltwater Batteries Market Estimates and Forecasts, by Type (2020-2032) (USD Billion)
9.3.1.5.2 Poland Saltwater Batteries Market Estimates and Forecasts, by Application (2020-2032) (USD Billion)
9.3.1.6 Romania
9.3.1.6.1 Romania Saltwater Batteries Market Estimates and Forecasts, by Type (2020-2032) (USD Billion)
9.3.1.6.2 Romania Saltwater Batteries Market Estimates and Forecasts, by Application (2020-2032) (USD Billion)
9.3.1.7 Hungary
9.3.1.7.1 Hungary Saltwater Batteries Market Estimates and Forecasts, by Type (2020-2032) (USD Billion)
9.3.1.7.2 Hungary Saltwater Batteries Market Estimates and Forecasts, by Application (2020-2032) (USD Billion)
9.3.1.8 Turkey
9.3.1.8.1 Turkey Saltwater Batteries Market Estimates and Forecasts, by Type (2020-2032) (USD Billion)
9.3.1.8.2 Turkey Saltwater Batteries Market Estimates and Forecasts, by Application (2020-2032) (USD Billion)
9.3.1.9 Rest of Eastern Europe
9.3.1.9.1 Rest of Eastern Europe Saltwater Batteries Market Estimates and Forecasts, by Type (2020-2032) (USD Billion)
9.3.1.9.2 Rest of Eastern Europe Saltwater Batteries Market Estimates and Forecasts, by Application (2020-2032) (USD Billion)
9.3.2 Western Europe
9.3.2.1 Trends Analysis
9.3.2.2 Western Europe Saltwater Batteries Market Estimates and Forecasts, by Country (2020-2032) (USD Billion)
9.3.2.3 Western Europe Saltwater Batteries Market Estimates and Forecasts, by Type (2020-2032) (USD Billion)
9.3.2.4 Western Europe Saltwater Batteries Market Estimates and Forecasts, by Application (2020-2032) (USD Billion)
9.3.2.5 Germany
9.3.2.5.1 Germany Saltwater Batteries Market Estimates and Forecasts, by Type (2020-2032) (USD Billion)
9.3.2.5.2 Germany Saltwater Batteries Market Estimates and Forecasts, by Application (2020-2032) (USD Billion)
9.3.2.6 France
9.3.2.6.1 France Saltwater Batteries Market Estimates and Forecasts, by Type (2020-2032) (USD Billion)
9.3.2.6.2 France Saltwater Batteries Market Estimates and Forecasts, by Application (2020-2032) (USD Billion)
9.3.2.7 UK
9.3.2.7.1 UK Saltwater Batteries Market Estimates and Forecasts, by Type (2020-2032) (USD Billion)
9.3.2.7.2 UK Saltwater Batteries Market Estimates and Forecasts, by Application (2020-2032) (USD Billion)
9.3.2.8 Italy
9.3.2.8.1 Italy Saltwater Batteries Market Estimates and Forecasts, by Type (2020-2032) (USD Billion)
9.3.2.8.2 Italy Saltwater Batteries Market Estimates and Forecasts, by Application (2020-2032) (USD Billion)
9.3.2.9 Spain
9.3.2.9.1 Spain Saltwater Batteries Market Estimates and Forecasts, by Type (2020-2032) (USD Billion)
9.3.2.9.2 Spain Saltwater Batteries Market Estimates and Forecasts, by Application (2020-2032) (USD Billion)
9.3.2.10 Netherlands
9.3.2.10.1 Netherlands Saltwater Batteries Market Estimates and Forecasts, by Type (2020-2032) (USD Billion)
9.3.2.10.2 Netherlands Saltwater Batteries Market Estimates and Forecasts, by Application (2020-2032) (USD Billion)
9.3.2.11 Switzerland
9.3.2.11.1 Switzerland Saltwater Batteries Market Estimates and Forecasts, by Type (2020-2032) (USD Billion)
9.3.2.11.2 Switzerland Saltwater Batteries Market Estimates and Forecasts, by Application (2020-2032) (USD Billion)
9.3.2.12 Austria
9.3.2.12.1 Austria Saltwater Batteries Market Estimates and Forecasts, by Type (2020-2032) (USD Billion)
9.3.2.12.2 Austria Saltwater Batteries Market Estimates and Forecasts, by Application (2020-2032) (USD Billion)
9.3.2.13 Rest of Western Europe
9.3.2.13.1 Rest of Western Europe Saltwater Batteries Market Estimates and Forecasts, by Type (2020-2032) (USD Billion)
9.3.2.13.2 Rest of Western Europe Saltwater Batteries Market Estimates and Forecasts, by Application (2020-2032) (USD Billion)
9.4 Asia Pacific
9.4.1 Trends Analysis
9.4.2 Asia Pacific Saltwater Batteries Market Estimates and Forecasts, by Country (2020-2032) (USD Billion)
9.4.3 Asia Pacific Saltwater Batteries Market Estimates and Forecasts, by Type (2020-2032) (USD Billion)
9.4.4 Asia Pacific Saltwater Batteries Market Estimates and Forecasts, by Application (2020-2032) (USD Billion)
9.4.5 China
9.4.5.1 China Saltwater Batteries Market Estimates and Forecasts, by Type (2020-2032) (USD Billion)
9.4.5.2 China Saltwater Batteries Market Estimates and Forecasts, by Application (2020-2032) (USD Billion)
9.4.6 India
9.4.5.1 India Saltwater Batteries Market Estimates and Forecasts, by Type (2020-2032) (USD Billion)
9.4.5.2 India Saltwater Batteries Market Estimates and Forecasts, by Application (2020-2032) (USD Billion)
9.4.5 Japan
9.4.5.1 Japan Saltwater Batteries Market Estimates and Forecasts, by Type (2020-2032) (USD Billion)
9.4.5.2 Japan Saltwater Batteries Market Estimates and Forecasts, by Application (2020-2032) (USD Billion)
9.4.6 South Korea
9.4.6.1 South Korea Saltwater Batteries Market Estimates and Forecasts, by Type (2020-2032) (USD Billion)
9.4.6.2 South Korea Saltwater Batteries Market Estimates and Forecasts, by Application (2020-2032) (USD Billion)
9.4.7 Vietnam
9.4.7.1 Vietnam Saltwater Batteries Market Estimates and Forecasts, by Type (2020-2032) (USD Billion)
9.2.7.2 Vietnam Saltwater Batteries Market Estimates and Forecasts, by Application (2020-2032) (USD Billion)
9.4.8 Singapore
9.4.8.1 Singapore Saltwater Batteries Market Estimates and Forecasts, by Type (2020-2032) (USD Billion)
9.4.8.2 Singapore Saltwater Batteries Market Estimates and Forecasts, by Application (2020-2032) (USD Billion)
9.4.9 Australia
9.4.9.1 Australia Saltwater Batteries Market Estimates and Forecasts, by Type (2020-2032) (USD Billion)
9.4.9.2 Australia Saltwater Batteries Market Estimates and Forecasts, by Application (2020-2032) (USD Billion)
9.4.10 Rest of Asia Pacific
9.4.10.1 Rest of Asia Pacific Saltwater Batteries Market Estimates and Forecasts, by Type (2020-2032) (USD Billion)
9.4.10.2 Rest of Asia Pacific Saltwater Batteries Market Estimates and Forecasts, by Application (2020-2032) (USD Billion)
9.5 Middle East and Africa
9.5.1 Middle East
9.5.1.1 Trends Analysis
9.5.1.2 Middle East Saltwater Batteries Market Estimates and Forecasts, by Country (2020-2032) (USD Billion)
9.5.1.3 Middle East Saltwater Batteries Market Estimates and Forecasts, by Type (2020-2032) (USD Billion)
9.5.1.4 Middle East Saltwater Batteries Market Estimates and Forecasts, by Application (2020-2032) (USD Billion)
9.5.1.5 UAE
9.5.1.5.1 UAE Saltwater Batteries Market Estimates and Forecasts, by Type (2020-2032) (USD Billion)
9.5.1.5.2 UAE Saltwater Batteries Market Estimates and Forecasts, by Application (2020-2032) (USD Billion)
9.5.1.6 Egypt
9.5.1.6.1 Egypt Saltwater Batteries Market Estimates and Forecasts, by Type (2020-2032) (USD Billion)
9.5.1.6.2 Egypt Saltwater Batteries Market Estimates and Forecasts, by Application (2020-2032) (USD Billion)
9.5.1.7 Saudi Arabia
9.5.1.7.1 Saudi Arabia Saltwater Batteries Market Estimates and Forecasts, by Type (2020-2032) (USD Billion)
9.5.1.7.2 Saudi Arabia Saltwater Batteries Market Estimates and Forecasts, by Application (2020-2032) (USD Billion)
9.5.1.8 Qatar
9.5.1.8.1 Qatar Saltwater Batteries Market Estimates and Forecasts, by Type (2020-2032) (USD Billion)
9.5.1.8.2 Qatar Saltwater Batteries Market Estimates and Forecasts, by Application (2020-2032) (USD Billion)
9.5.1.9 Rest of Middle East
9.5.1.9.1 Rest of Middle East Saltwater Batteries Market Estimates and Forecasts, by Type (2020-2032) (USD Billion)
9.5.1.9.2 Rest of Middle East Saltwater Batteries Market Estimates and Forecasts, by Application (2020-2032) (USD Billion)
9.5.2 Africa
9.5.2.1 Trends Analysis
9.5.2.2 Africa Saltwater Batteries Market Estimates and Forecasts, by Country (2020-2032) (USD Billion)
9.5.2.3 Africa Saltwater Batteries Market Estimates and Forecasts, by Type (2020-2032) (USD Billion)
9.5.2.4 Africa Saltwater Batteries Market Estimates and Forecasts, by Application (2020-2032) (USD Billion)
9.5.2.5 South Africa
9.5.2.5.1 South Africa Saltwater Batteries Market Estimates and Forecasts, by Type (2020-2032) (USD Billion)
9.5.2.5.2 South Africa Saltwater Batteries Market Estimates and Forecasts, by Application (2020-2032) (USD Billion)
9.5.2.6 Nigeria
9.5.2.6.1 Nigeria Saltwater Batteries Market Estimates and Forecasts, by Type (2020-2032) (USD Billion)
9.5.2.6.2 Nigeria Saltwater Batteries Market Estimates and Forecasts, by Application (2020-2032) (USD Billion)
9.5.2.7 Rest of Africa
9.5.2.7.1 Rest of Africa Saltwater Batteries Market Estimates and Forecasts, by Type (2020-2032) (USD Billion)
9.5.2.7.2 Rest of Africa Saltwater Batteries Market Estimates and Forecasts, by Application (2020-2032) (USD Billion)
9.6 Latin America
9.6.1 Trends Analysis
9.6.2 Latin America Saltwater Batteries Market Estimates and Forecasts, by Country (2020-2032) (USD Billion)
9.6.3 Latin America Saltwater Batteries Market Estimates and Forecasts, by Type (2020-2032) (USD Billion)
9.6.4 Latin America Saltwater Batteries Market Estimates and Forecasts, by Application (2020-2032) (USD Billion)
9.6.5 Brazil
9.6.5.1 Brazil Saltwater Batteries Market Estimates and Forecasts, by Type (2020-2032) (USD Billion)
9.6.5.2 Brazil Saltwater Batteries Market Estimates and Forecasts, by Application (2020-2032) (USD Billion)
9.6.6 Argentina
9.6.6.1 Argentina Saltwater Batteries Market Estimates and Forecasts, by Type (2020-2032) (USD Billion)
9.6.6.2 Argentina Saltwater Batteries Market Estimates and Forecasts, by Application (2020-2032) (USD Billion)
9.6.7 Colombia
9.6.7.1 Colombia Saltwater Batteries Market Estimates and Forecasts, by Type (2020-2032) (USD Billion)
9.6.7.2 Colombia Saltwater Batteries Market Estimates and Forecasts, by Application (2020-2032) (USD Billion)
9.6.8 Rest of Latin America
9.6.8.1 Rest of Latin America Saltwater Batteries Market Estimates and Forecasts, by Type (2020-2032) (USD Billion)
9.6.8.2 Rest of Latin America Saltwater Batteries Market Estimates and Forecasts, by Application (2020-2032) (USD Billion)
10. Company Profiles
10.1 Aquion Energy
10.1.1 Company Overview
10.1.2 Financial
10.1.3 Products/ Services Offered
110.1.4 SWOT Analysis
10.2 BlueSky Energy
10.2.1 Company Overview
10.2.2 Financial
10.2.3 Products/ Services Offered
10.2.4 SWOT Analysis
10.3 Green Energy Storage
10.3.1 Company Overview
10.3.2 Financial
10.3.3 Products/ Services Offered
10.3.4 SWOT Analysis
10.4 SaltX Technology
10.4.1 Company Overview
10.4.2 Financial
10.4.3 Products/ Services Offered
10.4.4 SWOT Analysis
10.5 ESS Inc.
10.5.1 Company Overview
10.5.2 Financial
10.5.3 Products/ Services Offered
10.5.4 SWOT Analysis
10.6 Faradion Limited
10.6.1 Company Overview
10.6.2 Financial
10.6.3 Products/ Services Offered
10.6.4 SWOT Analysis
10.7 NantEnergy
10.7.1 Company Overview
10.7.2 Financial
10.7.3 Products/ Services Offered
10.7.4 SWOT Analysis
10.8 Zinc8 Energy Solutions
10.8.1 Company Overview
10.8.2 Financial
10.8.3 Products/ Services Offered
10.8.4 SWOT Analysis
10.9 Invinity Energy Systems
10.9.1 Company Overview
10.9.2 Financial
10.9.3 Products/ Services Offered
10.9.4 SWOT Analysis
10.10 Redflow Limited
10.10.1 Company Overview
10.10.2 Financial
10.10.3 Products/ Services Offered
10.10.4 SWOT Analysis
11. Use Cases and Best Practices
12. Conclusion
An accurate research report requires proper strategizing as well as implementation. There are multiple factors involved in the completion of good and accurate research report and selecting the best methodology to compete the research is the toughest part. Since the research reports we provide play a crucial role in any company’s decision-making process, therefore we at SNS Insider always believe that we should choose the best method which gives us results closer to reality. This allows us to reach at a stage wherein we can provide our clients best and accurate investment to output ratio.
Each report that we prepare takes a timeframe of 350-400 business hours for production. Starting from the selection of titles through a couple of in-depth brain storming session to the final QC process before uploading our titles on our website we dedicate around 350 working hours. The titles are selected based on their current market cap and the foreseen CAGR and growth.
The 5 steps process:
Step 1: Secondary Research:
Secondary Research or Desk Research is as the name suggests is a research process wherein, we collect data through the readily available information. In this process we use various paid and unpaid databases which our team has access to and gather data through the same. This includes examining of listed companies’ annual reports, Journals, SEC filling etc. Apart from this our team has access to various associations across the globe across different industries. Lastly, we have exchange relationships with various university as well as individual libraries.
Step 2: Primary Research
When we talk about primary research, it is a type of study in which the researchers collect relevant data samples directly, rather than relying on previously collected data. This type of research is focused on gaining content specific facts that can be sued to solve specific problems. Since the collected data is fresh and first hand therefore it makes the study more accurate and genuine.
We at SNS Insider have divided Primary Research into 2 parts.
Part 1 wherein we interview the KOLs of major players as well as the upcoming ones across various geographic regions. This allows us to have their view over the market scenario and acts as an important tool to come closer to the accurate market numbers. As many as 45 paid and unpaid primary interviews are taken from both the demand and supply side of the industry to make sure we land at an accurate judgement and analysis of the market.
This step involves the triangulation of data wherein our team analyses the interview transcripts, online survey responses and observation of on filed participants. The below mentioned chart should give a better understanding of the part 1 of the primary interview.
Part 2: In this part of primary research the data collected via secondary research and the part 1 of the primary research is validated with the interviews from individual consultants and subject matter experts.
Consultants are those set of people who have at least 12 years of experience and expertise within the industry whereas Subject Matter Experts are those with at least 15 years of experience behind their back within the same space. The data with the help of two main processes i.e., FGDs (Focused Group Discussions) and IDs (Individual Discussions). This gives us a 3rd party nonbiased primary view of the market scenario making it a more dependable one while collation of the data pointers.
Step 3: Data Bank Validation
Once all the information is collected via primary and secondary sources, we run that information for data validation. At our intelligence centre our research heads track a lot of information related to the market which includes the quarterly reports, the daily stock prices, and other relevant information. Our data bank server gets updated every fortnight and that is how the information which we collected using our primary and secondary information is revalidated in real time.
Step 4: QA/QC Process
After all the data collection and validation our team does a final level of quality check and quality assurance to get rid of any unwanted or undesired mistakes. This might include but not limited to getting rid of the any typos, duplication of numbers or missing of any important information. The people involved in this process include technical content writers, research heads and graphics people. Once this process is completed the title gets uploader on our platform for our clients to read it.
Step 5: Final QC/QA Process:
This is the last process and comes when the client has ordered the study. In this process a final QA/QC is done before the study is emailed to the client. Since we believe in giving our clients a good experience of our research studies, therefore, to make sure that we do not lack at our end in any way humanly possible we do a final round of quality check and then dispatch the study to the client.
Key Segments:
By Type
48 Volt
24 Volt
12 Volt
By Application
Residential
Micro-Grid
Industrial
Request for Segment Customization as per your Business Requirement: Segment Customization Request
Regional Coverage:
North America
US
Canada
Mexico
Europe
Eastern Europe
Poland
Romania
Hungary
Turkey
Rest of Eastern Europe
Western Europe
Germany
France
UK
Italy
Spain
Netherlands
Switzerland
Austria
Rest of Western Europe
Asia Pacific
China
India
Japan
South Korea
Vietnam
Singapore
Australia
Rest of Asia Pacific
Middle East & Africa
Middle East
UAE
Egypt
Saudi Arabia
Qatar
Rest of Middle East
Africa
Nigeria
South Africa
Rest of Africa
Latin America
Brazil
Argentina
Colombia
Rest of Latin America
Request for Country Level Research Report: Country Level Customization Request
Available Customization
With the given market data, SNS Insider offers customization as per the company’s specific needs. The following customization options are available for the report:
Detailed Volume Analysis
Criss-Cross segment analysis (e.g. Product X Application)
Competitive Product Benchmarking
Geographic Analysis
Additional countries in any of the regions
Customized Data Representation
Detailed analysis and profiling of additional market players
The Automated Test Equipment Market size was valued at $7.39 Billion in 2023 & estimated to reach $10.68 Billion by 2032 at a CAGR of 4.21% during 2024-2032
LAN Cable Market Size was valued at USD 14.08 Billion in 2023 and is expected to reach USD 44.41 Billion by 2032 and grow at a CAGR of 13.63% over the forecast period 2024-2032.
The Enterprise Manufacturing Intelligence Market Size was valued at USD 5.18 Billion in 2023 and is expected to grow to USD 16.11 Billion by 2032 and grow at a CAGR of 13.44% over the forecast period of 2024-2032
The Machine Condition Monitoring Market size was valued at USD 2.61 Billion in 2023. It is estimated to reach USD 5.27 Billion at a CAGR of 8.14% by 2032
The Wet Chemicals for Electronics and Semiconductor Applications Market was valued as USD 3.9 Billion in 2023, Growing at a CAGR of 3.68% During 2024-2032
The Virtual Mirror Market Size was valued at USD 10.59 Billion in 2023 and is expected to reach USD 76.55 Billion by 2032 and grow at a CAGR of 24.63% over the forecast period 2024-2032.
Hi! Click one of our member below to chat on Phone