Seafood Market Report Scope & Overview:
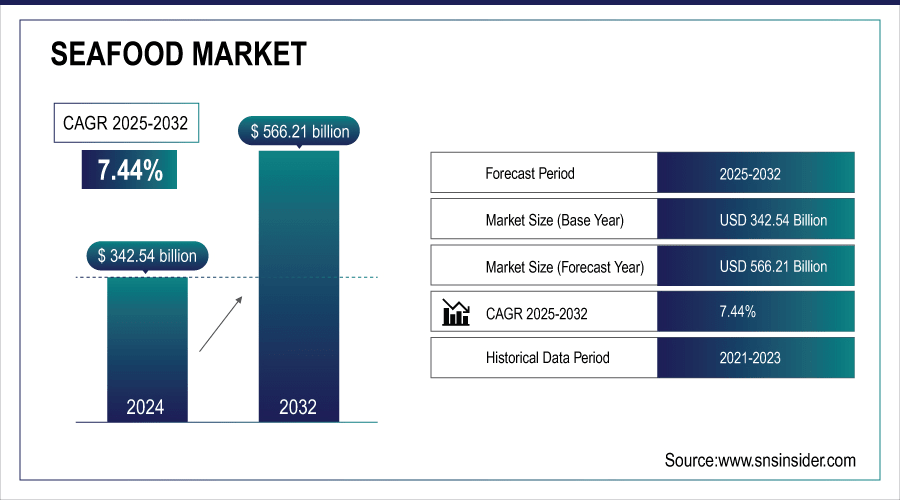
The Seafood Market Size was valued at USD 342.54 Billion in 2024 and is expected to reach USD 566.21 Billion by 2032, growing at a CAGR of 7.44% over the forecast period of 2025-2032.
The global seafood market is expanding due to rising demand for protein-rich diets, aquaculture growth, and technological advancements in processing. Increasing preference for frozen and ready-to-eat products, coupled with sustainability certifications and strong international trade, further boost market growth. Health-conscious consumers and efficient cold chain logistics are shaping future opportunities.
In 2022, global aquaculture production reached 130.9 million tonnes, exceeding capture fisheries (92.3 million tonnes), marking the first time farmed seafood surpassed wild-caught volumes.

To Get More Information On Seafood Market - Request Free Sample Report
Key Seafood Market Trends
-
Rising demand for sustainable and certified seafood.
-
Expansion of aquaculture technologies and offshore farming.
-
Growth in plant-based and lab-grown seafood alternatives.
-
Increasing global seafood trade, led by Asia-Pacific.
-
Popularity of ready-to-eat and value-added seafood products.
-
Strong focus on traceability and digital supply chain.
-
Health-conscious consumers driving omega-3 rich diets.
-
Integration of AI, IoT, and blockchain in aquaculture.

Seafood Market Growth Drivers
-
Rising Global Demand for Protein-Rich Diets Drives the Market Growth
Seafood consumption is expanding rapidly as consumers shift toward healthier, protein-rich diets that are low in saturated fats and high in omega-3 fatty acids. This shift is particularly strong in developed countries like the U.S. and Europe, where health-conscious populations are moving away from red meat. The Food and Agriculture Organization (FAO) reports that global per capita fish consumption increased from 9.9 kg in the 1960s to over 20.5 kg in 2020, showcasing the consistent rise in demand.
In 2023, the Norwegian government invested in expanding sustainable aquaculture to meet the rising domestic and export demand, strengthening Norway’s leadership in seafood exports.
Seafood Market Restraints
-
Overfishing and Depleting Marine Stocks May Hamper the Market Growth
Overfishing continues to threaten the sustainability of wild seafood supplies. According to FAO, nearly 34% of global fish stocks are exploited beyond sustainable biological levels, creating long-term risks for supply security and market pricing. Regulatory restrictions imposed to conserve marine resources often limit supply, affecting exporters and processors. Countries dependent on wild catch face production volatility and uncertain export revenues, which restrain steady market growth.
Seafood Market Opportunities
-
Rising Investment in Alternative Seafood (Plant-Based & Lab-Grown) Creates an Opportunity for the Market
The rise of plant-based diets and concern over ocean sustainability are fueling demand for seafood alternatives, including lab-grown fish and plant-based shrimp or tuna. This creates fresh growth avenues for startups and established food companies. With improving technology, these alternatives are moving closer to commercialization and gaining consumer acceptance.
In 2024, the Singapore government expanded funding for cultivated seafood research, positioning itself as a hub for sustainable protein innovation. This investment highlights the potential of lab-grown seafood to complement traditional supply chains.
Seafood Market Segment Highlights:
-
By Type: Dominating – Fish 52.4%, Fastest-growing – Crustaceans
-
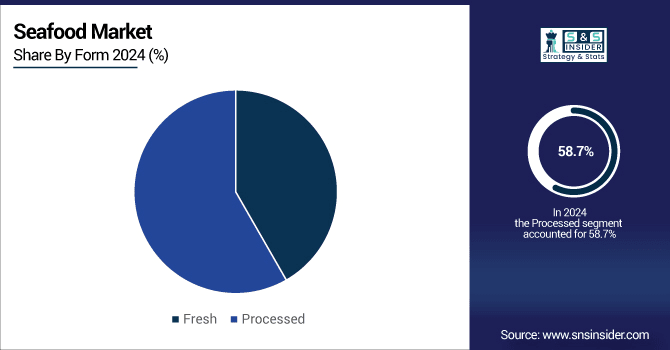
By Form: Dominating – Processed 58.7%, Fastest-growing – Fresh
-
By Distribution Channel: Dominating – B2C (Supermarkets/Hypermarkets) 46.2%, Fastest-growing – Online Sales Channel
Seafood Market Segment Analysis:
By Type:
Fish dominated the seafood market with a 52.4% share in 2024, largely due to its affordability, versatility, and high protein content, making it a staple in diets across Asia-Pacific, Europe, and North America. Crustaceans are the fastest-growing category, supported by rising consumer demand for premium seafood such as shrimp, crab, and lobster, particularly in urban markets where disposable incomes are rising and fine dining culture is expanding.
By Form:
Processed seafood held the largest share at 58.7% in 2024, driven by longer shelf life, global trade, and the increasing popularity of canned, frozen, and ready-to-eat options. Fresh seafood is the fastest-growing form, as consumers in both developed and emerging economies are seeking minimally processed, natural food products, fueled by health consciousness and improved cold chain logistics that ensure freshness and safety during distribution.

By Distribution Channel:
B2C (Supermarkets & Hypermarkets) dominated the market with 46.2% share in 2024, benefiting from their wide product availability, promotional pricing, and ability to cater to mass-market consumers. Online sales channels are the fastest-growing segment, as e-commerce platforms and app-based delivery services are making seafood more accessible, offering traceability, subscription models, and convenience to younger, tech-savvy consumers who prefer doorstep delivery.
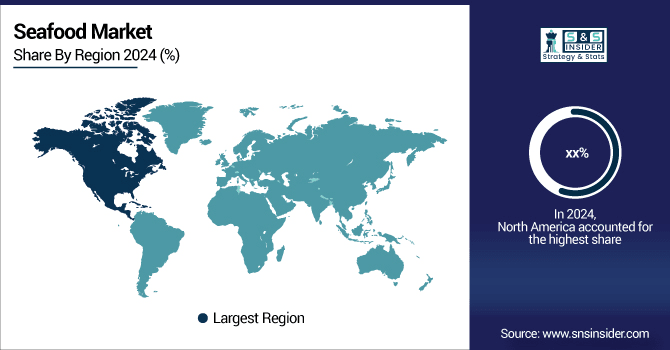
Seafood Market Regional Analysis
North America Seafood Market Insights
North America has emerged as a significant market driven by growing awareness of the health benefits of omega-3-rich seafood, particularly salmon, tuna, and shellfish. Demand is rising in both retail and foodservice channels, with consumers seeking fresh, frozen, and value-added products. The region is also witnessing strong adoption of sustainable and certified seafood, with eco-labels influencing purchase decisions. In 2024, Canada announced an expansion of its sustainable aquaculture program with investments in salmon farming technology, aimed at reducing environmental impact while meeting domestic and export demand. This reflects North America’s focus on balancing production with responsible practices.

Get Customized Report as Per Your Business Requirement - Enquiry Now
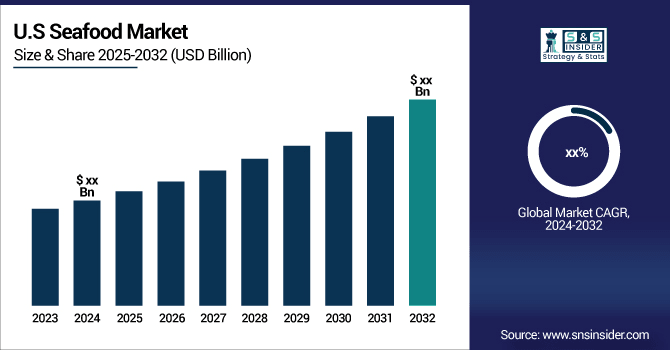
U.S. Seafood Market Insights
The U.S. is one of the largest consumers of seafood in North America, with shrimp, salmon, and tuna dominating consumption trends. Health-conscious diets, rising demand for ready-to-cook meals, and expanding seafood imports have supported market growth. The U.S. also relies heavily on imports from Asia and Latin America, making trade policies critical to supply. In 2024, the U.S. Department of Commerce announced funding for modernizing seafood processing plants to improve efficiency, safety, and competitiveness. This initiative highlights the country’s commitment to strengthening domestic processing capacity while ensuring supply chain resilience.
Asia Pacific Seafood Market Insights
Asia Pacific held the largest seafood market share of around 49% in 2024. It is due to its strong aquaculture base, large coastal resources, and high per capita seafood consumption in countries such as China, Japan, and India. Seafood is a dietary staple, and growing middle-class populations are fueling demand for both fresh and processed products. Governments across the region have been investing in sustainable aquaculture to meet rising demand and reduce import dependence. In 2024, China introduced stricter aquaculture certification standards to enhance traceability and food safety, improving the credibility of its seafood exports. This move not only strengthens domestic confidence but also positions the Asia Pacific as a leader in supplying high-quality seafood globally.
Europe Seafood Industry
Europe remains a major hub for seafood trade and consumption, supported by strong cultural preferences for fish in Mediterranean countries and high per capita seafood intake in Nordic nations. Sustainability regulations and certification schemes under the EU framework are shaping the industry, with traceability and eco-labels driving consumer trust. In 2024, Norway, one of Europe’s leading exporters, expanded its salmon farming operations with advanced offshore aquaculture facilities. This development underscores Europe’s role in combining innovation with strict environmental standards, ensuring its leadership in the premium seafood segment.
Latin America (LATAM) and Middle East & Africa (MEA) Seafood Market Insights
Latin America and the Middle East & Africa are emerging as dynamic regions in the global seafood market, each playing distinct yet complementary roles. Latin America, led by Chile, Peru, and Ecuador, is strengthening its position as a major producer and exporter, with salmon and shrimp driving aquaculture investments and rising domestic consumption fueled by healthier dietary trends. Meanwhile, the Middle East & Africa market is expanding steadily, supported by strong cultural preferences, growing urban populations, and increasing reliance on imports, particularly in Gulf countries.
In 2024, Chile invested heavily in salmon farming with advanced water treatment systems, while Saudi Arabia launched a national aquaculture initiative to boost domestic fish production. Together, these developments highlight both regions’ strategic ambitions to expand seafood supply, balance sustainability, and capture greater value in global trade.
Competitive Landscape for the Seafood Market:
Thai Union Group
Thai Union Group is a leading global seafood company with a diverse portfolio covering canned, frozen, and value-added seafood products. The company emphasizes sustainability, responsible sourcing, and innovative product development.
-
In March 2024, Thai Union expanded its sustainable seafood sourcing program in Thailand and Europe, partnering with MSC-certified suppliers to meet growing demand for eco-friendly seafood.
Mowi ASA
Mowi ASA is one of the world’s largest salmon producers, focusing on sustainable aquaculture, innovative farming techniques, and premium seafood products. The company invests heavily in offshore farming technology.
-
In April 2024, Mowi launched a new offshore salmon farming system in Norway designed to increase production capacity while minimizing environmental impact and improving fish welfare.
Maruha Nichiro Corporation
Maruha Nichiro Corporation is a major seafood company in Japan, offering a wide range of frozen, processed, and ready-to-eat seafood products. The company prioritizes convenience and health-focused innovations.
-
In May 2024, Maruha Nichiro introduced a line of ready-to-eat seafood meals in Japan, targeting busy consumers seeking nutritious and convenient options.
Trident Seafoods Corporation
Trident Seafoods Corporation is a prominent U.S.-based seafood company specializing in frozen, fresh, and value-added products. The company emphasizes quality, safety, and innovation in processing.
-
In June 2024, Trident launched a new range of frozen seafood products for retail chains across North America, focusing on ease of preparation and premium quality.
Seafood Market Key Players
Some of the Seafood Companies
-
Suisan Kaisha, Ltd. (Nissui)
-
Thai Union Group PCL
-
Mowi ASA
-
Charoen Pokphand Foods Public Company Limited (CPF)
-
Trident Seafoods Corporation
-
Marine Harvest ASA
-
High Liner Foods Inc.
-
Austevoll Seafood ASA
-
Clearwater Seafoods Inc.
-
Lerøy Seafood Group
-
Pacific Seafood Group
-
Cooke Aquaculture Inc.
-
Dongwon Industries Co., Ltd.
-
Tassal Group Limited
-
Kyokuyo Co., Ltd.
-
Parlevliet & Van der Plas
-
Bolton Group S.r.l.
-
Sanford Limited
-
Blue Sea Food Company
Report Attributes | Details |
---|---|
Market Size in 2024 | USD342.54 Billion |
Market Size by 2032 | USD 566.21 Billion |
CAGR | CAGR of7.44% From 2025 to 2032 |
Base Year | 2024 |
Forecast Period | 2025-2032 |
Historical Data | 2021-2023 |
Report Scope & Coverage | Market Size, Segments Analysis, Competitive Landscape, Regional Analysis, DROC & SWOT Analysis, Forecast Outlook |
Key Segments | • By Type (Fish, Crustaceans, Molluscs, and Others) • By Form (Fresh, Processed (Canned, Chilled, and Frozen) • By Distribution Channel [(B2C (Supermarkets/Hypermarkets, Convenience Stores & Specialty Stores, Online Sales Channel, and Others), B2B] |
Regional Analysis/Coverage | North America (US, Canada), Europe (Germany, France, UK, Italy, Spain, Poland, Russsia, Rest of Europe), Asia Pacific (China, India, Japan, South Korea, Australia,ASEAN Countries, Rest of Asia Pacific), Middle East & Africa (UAE, Saudi Arabia, Qatar, Egypt, South Africa, Rest of Middle East & Africa), Latin America (Brazil, Argentina, Mexico, Colombia Rest of Latin America) |
Company Profiles | Maruha Nichiro Corporation, Nippon Suisan Kaisha, Ltd. (Nissui), Thai Union Group PCL, Mowi ASA, Charoen Pokphand Foods Public Company Limited (CPF), Trident Seafoods Corporation, Marine Harvest ASA, High Liner Foods Inc., Austevoll Seafood ASA, Clearwater Seafoods Inc., Lerøy Seafood Group, Pacific Seafood Group, Cooke Aquaculture Inc., Dongwon Industries Co., Ltd., Tassal Group Limited, Kyokuyo Co., Ltd., Parlevliet & Van der Plas, Bolton Group S.r.l., Sanford Limited, and Blue Sea Food Company |
Table of Contents
1. Introduction
1.1 Market Definition & Scope
1.2 Research Assumptions & Abbreviations
1.3 Research Methodology
2. Executive Summary
2.1 Market Snapshot
2.2 Market Absolute $ Opportunity Assessment & Y-o-Y Analysis, 2021–2032
2.3 Market Size & Forecast, By Segmentation, 2021–2032
2.3.1 Market Size By Type
2.3.2 Market Size By Form
2.3.3 Market Size By Distribution Channel
2.4 Market Share & Bps Analysis By Region, 2024
2.5 Industry Growth Scenarios – Conservative, Likely & Optimistic
2.6 Industry CxO’s Perspective
3. Market Overview
3.1 Market Dynamics
3.1.1 Drivers
3.1.2 Restraints
3.1.3 Opportunities
3.1.4 Key Market Trends
3.2 Industry PESTLE Analysis
3.3 Key Industry Forces (Porter’s) Impacting Market Growth
3.4 Industry Supply Chain Analysis
3.4.1 Raw Material Suppliers
3.4.2 Manufacturers
3.4.3 Distributors/Suppliers
3.4.4 Customers/End-Users
3.5 Industry Life Cycle Assessment
3.6 Parent Market Overview
3.7 Market Risk Assessment
4. Statistical Insights & Trends Reporting
4.1 Supply Chain & Cold Storage Infrastructure Analysis
4.2 Technological Innovations in Aquaculture & Processing
4.3 Consumer Behavior & Dietary Shifts
4.4 Trade & Regulatory Framework Analysis
4.5 Investment & M&A Activity Tracker
5. Seafood Market Segmental Analysis & Forecast, By Type, 2021 – 2032, Value (USD Billion)
5.1 Introduction
5.2 Fish
5.2.1 Key Trends
5.2.2 Market Size & Forecast, 2021 – 2032
5.3 Crustaceans
5.4 Molluscs
5.5 Others
6. Seafood Market Segmental Analysis & Forecast, By Form, 2021 – 2032, Value (USD Billion)
6.1 Introduction
6.2 Fresh
6.2.1 Key Trends
6.2.2 Market Size & Forecast, 2021 – 2032
6.3 Processed
6.3.1 Canned
6.3.2 Chilled
6.3.3 Frozen
7. Seafood Market Segmental Analysis & Forecast, By Distribution Channel, 2021 – 2032, Value (USD Billion)
7.1 Introduction
7.2 B2C
7.2.1 Key Trends
7.2.2 Market Size & Forecast, 2021 – 2032
7.3 Supermarkets/Hypermarkets
7.4 Convenience Stores & Specialty Stores
7.5 Online Sales Channel
7.6 Others
7.7 B2B
8. Seafood Market Segmental Analysis & Forecast By Region, 2021 – 2025, Value (USD Billion)
8.1 Introduction
8.2 North America
8.2.1 Key Trends
8.2.2 Seafood Market Size & Forecast, By Type, 2021 – 2032
8.2.3 Seafood Market Size & Forecast, By Form, 2021 – 2032
8.2.4 Seafood Market Size & Forecast, By Distribution Channel, 2021 – 2032
8.2.5 Seafood Market Size & Forecast, By Country, 2021 – 2032
8.2.5.1 USA
8.2.5.1.1 Seafood Market Size & Forecast, By Type, 2021 – 2032
8.2.5.1.2 Seafood Market Size & Forecast, By Form, 2021 – 2032
8.2.5.1.3 Seafood Market Size & Forecast, By Distribution Channel, 2021 – 2032
8.2.5.2 Canada
8.2.5.2.1 Seafood Market Size & Forecast, By Type, 2021 – 2032
8.2.5.2.2 Seafood Market Size & Forecast, By Form, 2021 – 2032
8.2.5.2.3 Seafood Market Size & Forecast, By Distribution Channel, 2021 – 2032
8.3 Europe
8.3.1 Key Trends
8.3.2 Seafood Market Size & Forecast, By Type, 2021 – 2032
8.3.3 Seafood Market Size & Forecast, By Form, 2021 – 2032
8.3.4 Seafood Market Size & Forecast, By Distribution Channel, 2021 – 2032
8.3.5 Seafood Market Size & Forecast, By Country, 2021 – 2032
8.3.5.1 Germany
8.3.5.1.1 Seafood Market Size & Forecast, By Type, 2021 – 2032
8.3.5.1.2 Seafood Market Size & Forecast, By Form, 2021 – 2032
8.3.5.1.3 Seafood Market Size & Forecast, By Distribution Channel, 2021 – 2032
8.3.5.2 UK
8.3.5.2.1 Seafood Market Size & Forecast, By Type, 2021 – 2032
8.3.5.2.2 Seafood Market Size & Forecast, By Form, 2021 – 2032
8.3.5.2.3 Seafood Market Size & Forecast, By Distribution Channel, 2021 – 2032
8.3.5.3 France
8.3.5.3.1 Seafood Market Size & Forecast, By Type, 2021 – 2032
8.3.5.3.2 Seafood Market Size & Forecast, By Form, 2021 – 2032
8.3.5.3.3 Seafood Market Size & Forecast, By Distribution Channel, 2021 – 2032
8.3.5.4 Italy
8.3.5.4.1 Seafood Market Size & Forecast, By Type, 2021 – 2032
8.3.5.4.2 Seafood Market Size & Forecast, By Form, 2021 – 2032
8.3.5.4.3 Seafood Market Size & Forecast, By Distribution Channel, 2021 – 2032
8.3.5.5 Spain
8.3.5.5.1 Seafood Market Size & Forecast, By Type, 2021 – 2032
8.3.5.5.2 Seafood Market Size & Forecast, By Form, 2021 – 2032
8.3.5.5.3 Seafood Market Size & Forecast, By Distribution Channel, 2021 – 2032
8.3.5.6 Russia
8.3.5.6.1 Seafood Market Size & Forecast, By Type, 2021 – 2032
8.3.5.6.2 Seafood Market Size & Forecast, By Form, 2021 – 2032
8.3.5.6.3 Seafood Market Size & Forecast, By Distribution Channel, 2021 – 2032
8.3.5.7 Poland
8.3.5.7.1 Seafood Market Size & Forecast, By Type, 2021 – 2032
8.3.5.7.2 Seafood Market Size & Forecast, By Form, 2021 – 2032
8.3.5.7.3 Seafood Market Size & Forecast, By Distribution Channel, 2021 – 2032
8.3.5.8 Rest of Europe
8.3.5.8.1 Seafood Market Size & Forecast, By Type, 2021 – 2032
8.3.5.8.2 Seafood Market Size & Forecast, By Form, 2021 – 2032
8.3.5.8.3 Seafood Market Size & Forecast, By Distribution Channel, 2021 – 2032
8.4 Asia-Pacific
8.4.1 Key Trends
8.4.2 Seafood Market Size & Forecast, By Type, 2021 – 2032
8.4.3 Seafood Market Size & Forecast, By Form, 2021 – 2032
8.4.4 Seafood Market Size & Forecast, By Distribution Channel, 2021 – 2032
8.4.5 Seafood Market Size & Forecast, By Country, 2021 – 2032
8.4.5.1 China
8.4.5.1.1 Seafood Market Size & Forecast, By Type, 2021 – 2032
8.4.5.1.2 Seafood Market Size & Forecast, By Form, 2021 – 2032
8.4.5.1.3 Seafood Market Size & Forecast, By Distribution Channel, 2021 – 2032
8.4.5.2 India
8.4.5.2.1 Seafood Market Size & Forecast, By Type, 2021 – 2032
8.4.5.2.2 Seafood Market Size & Forecast, By Form, 2021 – 2032
8.4.5.2.3 Seafood Market Size & Forecast, By Distribution Channel, 2021 – 2032
8.4.5.3 Japan
8.4.5.3.1 Seafood Market Size & Forecast, By Type, 2021 – 2032
8.4.5.3.2 Seafood Market Size & Forecast, By Form, 2021 – 2032
8.4.5.3.3 Seafood Market Size & Forecast, By Distribution Channel, 2021 – 2032
8.4.5.4 South Korea
8.4.5.4.1 Seafood Market Size & Forecast, By Type, 2021 – 2032
8.4.5.4.2 Seafood Market Size & Forecast, By Form, 2021 – 2032
8.4.5.4.3 Seafood Market Size & Forecast, By Distribution Channel, 2021 – 2032
8.4.5.5 Australia
8.4.5.5.1 Seafood Market Size & Forecast, By Type, 2021 – 2032
8.4.5.5.2 Seafood Market Size & Forecast, By Form, 2021 – 2032
8.4.5.5.3 Seafood Market Size & Forecast, By Distribution Channel, 2021 – 2032
8.4.5.6 ASEAN Countries
8.4.5.6.1 Seafood Market Size & Forecast, By Type, 2021 – 2032
8.4.5.6.2 Seafood Market Size & Forecast, By Form, 2021 – 2032
8.4.5.6.3 Seafood Market Size & Forecast, By Distribution Channel, 2021 – 2032
8.4.5.7 Rest of Asia-Pacific
8.4.5.7.1 Seafood Market Size & Forecast, By Type, 2021 – 2032
8.4.5.7.2 Seafood Market Size & Forecast, By Form, 2021 – 2032
8.4.5.7.3 Seafood Market Size & Forecast, By Distribution Channel, 2021 – 2032
8.5 Latin America
8.5.1 Key Trends
8.5.2 Seafood Market Size & Forecast, By Type, 2021 – 2032
8.5.3 Seafood Market Size & Forecast, By Form, 2021 – 2032
8.5.4 Seafood Market Size & Forecast, By Distribution Channel, 2021 – 2032
8.5.5 Seafood Market Size & Forecast, By Country, 2021 – 2032
8.5.5.1 Brazil
8.5.5.1.1 Seafood Market Size & Forecast, By Type, 2021 – 2032
8.5.5.1.2 Seafood Market Size & Forecast, By Form, 2021 – 2032
8.5.5.1.3 Seafood Market Size & Forecast, By Distribution Channel, 2021 – 2032
8.5.5.2 Argentina
8.5.5.2.1 Seafood Market Size & Forecast, By Type, 2021 – 2032
8.5.5.2.2 Seafood Market Size & Forecast, By Form, 2021 – 2032
8.5.5.2.3 Seafood Market Size & Forecast, By Distribution Channel, 2021 – 2032
8.5.5.3 Mexico
8.5.5.3.1 Seafood Market Size & Forecast, By Type, 2021 – 2032
8.5.5.3.2 Seafood Market Size & Forecast, By Form, 2021 – 2032
8.5.5.3.3 Seafood Market Size & Forecast, By Distribution Channel, 2021 – 2032
8.5.5.4 Colombia
8.5.5.4.1 Seafood Market Size & Forecast, By Type, 2021 – 2032
8.5.5.4.2 Seafood Market Size & Forecast, By Form, 2021 – 2032
8.5.5.4.3 Seafood Market Size & Forecast, By Distribution Channel, 2021 – 2032
8.5.5.5 Rest of Latin America
8.5.5.5.1 Seafood Market Size & Forecast, By Type, 2021 – 2032
8.5.5.5.2 Seafood Market Size & Forecast, By Form, 2021 – 2032
8.5.5.5.3 Seafood Market Size & Forecast, By Distribution Channel, 2021 – 2032
8.6 Middle East & Africa
8.6.1 Key Trends
8.6.2 Seafood Market Size & Forecast, By Type, 2021 – 2032
8.6.3 Seafood Market Size & Forecast, By Form, 2021 – 2032
8.6.4 Seafood Market Size & Forecast, By Distribution Channel, 2021 – 2032
8.6.5 Seafood Market Size & Forecast, By Country, 2021 – 2032
8.6.5.1 UAE
8.6.5.1.1 Seafood Market Size & Forecast, By Type, 2021 – 2032
8.6.5.1.2 Seafood Market Size & Forecast, By Form, 2021 – 2032
8.6.5.1.3 Seafood Market Size & Forecast, By Distribution Channel, 2021 – 2032
8.6.5.2 Saudi Arabia
8.6.5.2.1 Seafood Market Size & Forecast, By Type, 2021 – 2032
8.6.5.2.2 Seafood Market Size & Forecast, By Form, 2021 – 2032
8.6.5.2.3 Seafood Market Size & Forecast, By Distribution Channel, 2021 – 2032
8.6.5.3 Qatar
8.6.5.3.1 Seafood Market Size & Forecast, By Type, 2021 – 2032
8.6.5.3.2 Seafood Market Size & Forecast, By Form, 2021 – 2032
8.6.5.3.3 Seafood Market Size & Forecast, By Distribution Channel, 2021 – 2032
8.6.5.4 Egypt
8.6.5.4.1 Seafood Market Size & Forecast, By Type, 2021 – 2032
8.6.5.4.2 Seafood Market Size & Forecast, By Form, 2021 – 2032
8.6.5.4.3 Seafood Market Size & Forecast, By Distribution Channel, 2021 – 2032
8.6.5.5 South Africa
8.6.5.5.1 Seafood Market Size & Forecast, By Type, 2021 – 2032
8.6.5.5.2 Seafood Market Size & Forecast, By Form, 2021 – 2032
8.6.5.5.3 Seafood Market Size & Forecast, By Distribution Channel, 2021 – 2032
8.6.5.6 Rest of Middle East & Africa
8.6.5.6.1 Seafood Market Size & Forecast, By Type, 2021 – 2032
8.6.5.6.2 Seafood Market Size & Forecast, By Form, 2021 – 2032
8.6.5.6.3 Seafood Market Size & Forecast, By Distribution Channel, 2021 – 2032
9. Competitive Landscape
9.1 Key Players' Positioning
9.2 Competitive Developments
9.2.1 Key Strategies Adopted (%), By Key Players, 2024
9.2.2 Year-Wise Strategies & Development, 2021 – 2025
9.2.3 Number Of Strategies Adopted By Key Players, 2024
9.3 Market Share Analysis, 2024
9.4 Product/Service & Application Benchmarking
9.4.1 Product/Service Specifications & Features By Key Players
9.4.2 Product/Service Heatmap By Key Players
9.4.3 Application Heatmap By Key Players
9.5 Industry Start-Up & Innovation Landscape
9.6 Key Company Profiles
9.6.1 Maruha Nichiro Corporation
9.6.1.1 Company Overview & Snapshot
9.6.1.2 Product/Service Portfolio
9.6.1.3 Key Company Financials
9.6.1.4 SWOT Analysis
9.6.2 Nippon Suisan Kaisha, Ltd.
9.6.3 Thai Union Group PCL
9.6.4 Mowi ASA
9.6.5 Charoen Pokphand Foods Public Company Limited (CPF)
9.6.6 Trident Seafoods Corporation
9.6.7 Marine Harvest ASA
9.6.8 High Liner Foods Inc.
9.6.9 Austevoll Seafood ASA
9.6.10 Clearwater Seafoods Inc.
9.6.11 Lerøy Seafood Group
9.6.12 Pacific Seafood Group
9.6.13 Cooke Aquaculture Inc.
9.6.14 Dongwon Industries Co., Ltd.
9.6.15 Tassal Group Limited
9.6.16 Kyokuyo Co., Ltd.
9.6.17 Parlevliet & Van der Plas
9.6.18 Bolton Group S.r.l.
9.6.19 Sanford Limited
9.6.20 Blue Sea Food Company
10. Analyst Recommendations
10.1 SNS Insider Opportunity Map
10.2 Industry Low-Hanging Fruit Assessment
10.3 Market Entry & Growth Strategy
10.4 Analyst Viewpoint & Suggestions On Market Growth
11. Assumptions
12. Disclaimer
13. Appendix
13.1 List Of Tables
13.2 List Of Figures
Key Segments
By Type
-
Fish
-
Crustaceans
-
Molluscs
-
Others
By Form
-
Fresh
-
Processed
-
Canned
-
Chilled
-
Frozen
-
By Distribution Channel
-
B2C
-
Supermarkets/Hypermarkets
-
Convenience Stores & Specialty Stores
-
Online Sales Channel
-
Others
-
-
B2B
Request for Segment Customization as per your Business Requirement: Segment Customization Request
Regional Coverage:
North America
-
US
-
Canada
Europe
-
Germany
-
UK
-
France
-
Italy
-
Spain
-
Russia
-
Poland
-
Rest of Europe
Asia Pacific
-
China
-
India
-
Japan
-
South Korea
-
ASEAN Countries
-
Australia
-
Rest of Asia Pacific
Latin America
-
Brazil
-
Argentina
-
Mexico
-
Colombia
-
Rest of Latin America
Middle East & Africa
-
UAE
-
Saudi Arabia
-
Qatar
-
Egypt
-
South Africa
-
Rest of Middle East & Africa
Request for Country Level Research Report: Country Level Customization Request
Available Customization
With the given market data, SNS Insider offers customization as per the company’s specific needs. The following customization options are available for the report:
-
Detailed Volume Analysis
-
Criss-Cross segment analysis (e.g. Product X Application)
-
Competitive Product Benchmarking
-
Geographic Analysis
-
Additional countries in any of the regions
-
Customized Data Representation
-
Detailed analysis and profiling of additional market players
An accurate research report requires proper strategizing as well as implementation. There are multiple factors involved in the completion of good and accurate research report and selecting the best methodology to compete the research is the toughest part. Since the research reports we provide play a crucial role in any company’s decision-making process, therefore we at SNS Insider always believe that we should choose the best method which gives us results closer to reality. This allows us to reach at a stage wherein we can provide our clients best and accurate investment to output ratio.
Each report that we prepare takes a timeframe of 350-400 business hours for production. Starting from the selection of titles through a couple of in-depth brain storming session to the final QC process before uploading our titles on our website we dedicate around 350 working hours. The titles are selected based on their current market cap and the foreseen CAGR and growth.
The 5 steps process:
Step 1: Secondary Research:
Secondary Research or Desk Research is as the name suggests is a research process wherein, we collect data through the readily available information. In this process we use various paid and unpaid databases which our team has access to and gather data through the same. This includes examining of listed companies’ annual reports, Journals, SEC filling etc. Apart from this our team has access to various associations across the globe across different industries. Lastly, we have exchange relationships with various university as well as individual libraries.

Step 2: Primary Research
When we talk about primary research, it is a type of study in which the researchers collect relevant data samples directly, rather than relying on previously collected data. This type of research is focused on gaining content specific facts that can be sued to solve specific problems. Since the collected data is fresh and first hand therefore it makes the study more accurate and genuine.
We at SNS Insider have divided Primary Research into 2 parts.
Part 1 wherein we interview the KOLs of major players as well as the upcoming ones across various geographic regions. This allows us to have their view over the market scenario and acts as an important tool to come closer to the accurate market numbers. As many as 45 paid and unpaid primary interviews are taken from both the demand and supply side of the industry to make sure we land at an accurate judgement and analysis of the market.
This step involves the triangulation of data wherein our team analyses the interview transcripts, online survey responses and observation of on filed participants. The below mentioned chart should give a better understanding of the part 1 of the primary interview.

Part 2: In this part of primary research the data collected via secondary research and the part 1 of the primary research is validated with the interviews from individual consultants and subject matter experts.
Consultants are those set of people who have at least 12 years of experience and expertise within the industry whereas Subject Matter Experts are those with at least 15 years of experience behind their back within the same space. The data with the help of two main processes i.e., FGDs (Focused Group Discussions) and IDs (Individual Discussions). This gives us a 3rd party nonbiased primary view of the market scenario making it a more dependable one while collation of the data pointers.
Step 3: Data Bank Validation
Once all the information is collected via primary and secondary sources, we run that information for data validation. At our intelligence centre our research heads track a lot of information related to the market which includes the quarterly reports, the daily stock prices, and other relevant information. Our data bank server gets updated every fortnight and that is how the information which we collected using our primary and secondary information is revalidated in real time.

Step 4: QA/QC Process
After all the data collection and validation our team does a final level of quality check and quality assurance to get rid of any unwanted or undesired mistakes. This might include but not limited to getting rid of the any typos, duplication of numbers or missing of any important information. The people involved in this process include technical content writers, research heads and graphics people. Once this process is completed the title gets uploader on our platform for our clients to read it.
Step 5: Final QC/QA Process:
This is the last process and comes when the client has ordered the study. In this process a final QA/QC is done before the study is emailed to the client. Since we believe in giving our clients a good experience of our research studies, therefore, to make sure that we do not lack at our end in any way humanly possible we do a final round of quality check and then dispatch the study to the client.