Soft Gripper Market Size & Trends:
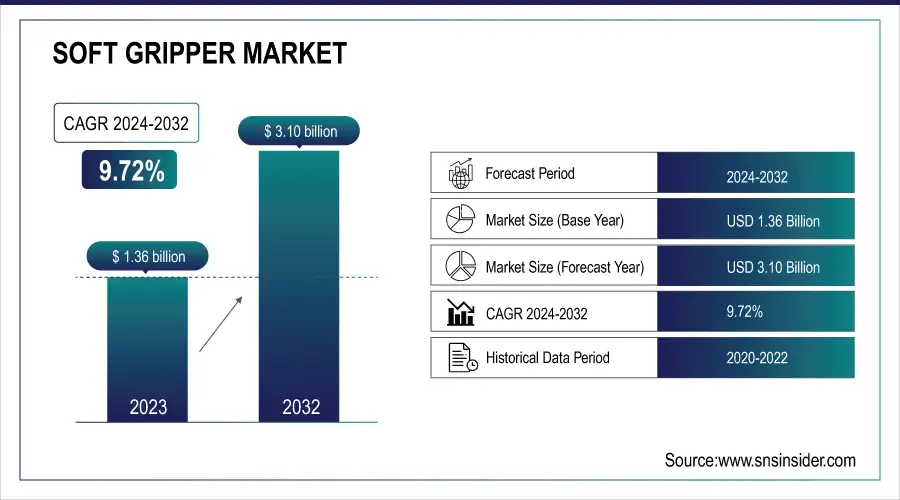
The Soft Gripper Market Size was valued at USD 1.36 billion in 2023 and is expected to reach USD 3.10 billion by 2032 and grow at a CAGR of 9.72% over the forecast period 2024-2032.
This development is fueled by growing demand for automation across multiple industries, such as food and beverage, healthcare, and logistics. Soft grippers are preferred for their gentleness in handling fragile and oddly shaped products, which makes them perfect for applications involving delicate manipulation. Advances in material science and robotics technology are also driving the capabilities and uptake of soft grippers. With industries increasingly valuing efficiency and flexibility, the Soft Gripper Market is ready for continued growth over the next few years.
To Get more information on Soft Gripper Market - Request Free Sample Report
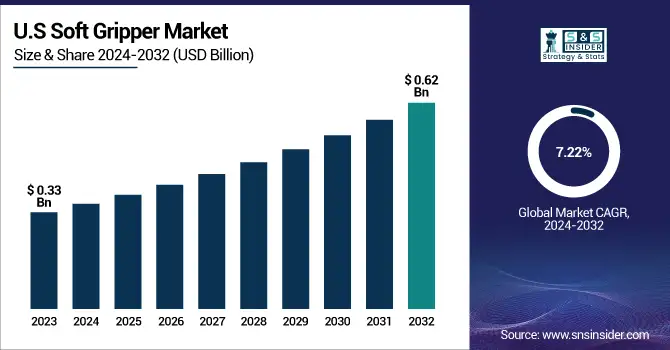
The U.S. Soft Gripper Market size was USD 0.33 billion in 2023 and is expected to reach USD 0.62 billion by 2032, growing at a CAGR of 7.22% over the forecast period of 2024–2032.
Soft grippers are preferred over others due to their capability to support sensitive and oddly shaped objects, thus proving most suitable for applications involving soft manipulation. The improvements in materials science and robotics technology are continuing to improve the functions and use of soft grippers. While industries continue to focus on efficiency and flexibility, the U.S. Soft Gripper Market will continue to experience significant growth in the next few years.
Soft Gripper Market Dynamics
Key Drivers:
-
Increasing Demand for Automation Across Industries Boosts the Soft Gripper Market Growth.
The increasing adoption of automation technologies across several industries, such as manufacturing, logistics, and healthcare, is strongly driving the growth of the soft gripper market. The industries are increasingly looking for efficient, accurate, and adaptable solutions to manage sensitive and irrationally shaped items. Soft grippers, with their flexible and delicate handling options, are ideally positioned to address these demands. Their use increases efficiency in operations, saves labor, and reduces product damage, making them a necessity in contemporary automated systems. With industries focusing more on automation to remain competitive and satisfy consumer demands, the demand for soft grippers is likely to increase, fueling continued market growth.
Restrain:
-
High Initial Investment and Integration Costs Limit Soft Gripper Market Adoption.
The implementation of soft grippers is limited by the high initial investment and integration costs involved in their deployment. For most small and medium-sized enterprises (SMEs), these costs present major barriers to entry.
Further, the intricacies involved in adopting soft grippers into current systems can result in higher operational expenses and longer downtime during the process of transition. Such financial and logistical issues discourage prospective adopters, especially in industries that are sensitive to cost, thus limiting the extensive uptake of soft grippers and restricting overall market growth.
Opportunities:
-
Expansion in E-commerce and Warehouse Automation Drives Soft Gripper Market Growth.
The high momentum of e-commerce has created a greater demand for flexible and effective automation solutions in fulfillment centers and warehouses, offering a good opportunity for the soft gripper market. Soft grippers are most suitable to deal with a wide variety of products, such as fragile and irregularly shaped goods, typical in e-commerce logistics. Their flexibility makes sorting, packing, and shipping processes more efficient and accurate. With online retailing continuing to grow, demand for sophisticated automation technologies such as soft grippers will increase, fueling market growth and innovation in the logistics industry.
Challenges:
-
Material Durability and Performance Limitations Affect Soft Gripper Market Growth.
The performance and durability limitations of the materials used to make them. Soft grippers can wear out over time, resulting in reduced performance and higher maintenance costs. Their performance can also be affected when used to handle heavy or stiff objects, making them less suitable for use in some industrial settings. Solving these material issues through innovation and the creation of more robust and adaptable materials is essential to improve the longevity and functionality of soft grippers, hence facilitating continued market growth.
Soft Gripper Market Segmentation Analysis
By Material
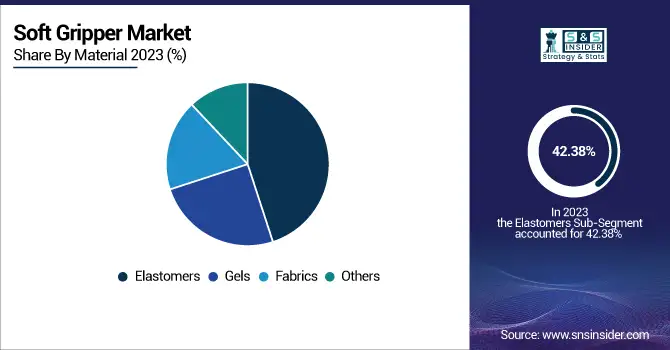
The Elastomers segment dominated the Soft Gripper Market in 2023, holding a considerable 42.38% revenue share. Elastomers, due to their flexibility and ruggedness, are well-suited for uses involving the delicate handling of fragile objects. Soft Robotics, among other companies, has used an elastomer-based design to create grippers that can be used across a range of shapes and sizes, increasing their applicability in industries like food processing and packaging. Equally, Festo came up with the BionicSoftHand, adopting elastomer materials to replicate human hand movements to enhance dexterity and accuracy in automation operations. Such technologies highlight the importance of elastomers in promoting soft gripper technologies to keep pace with the increased demand for flexible and effective automation solutions across various industries.
The Gels Segment is expected to witness the fastest CAGR of 11.71% in the Soft Gripper Market during 2024-2032. Gels provide exceptional characteristics like large compliance and the possibility to adapt complex geometries, and thus they are ideal for gripping delicate and complex-shaped objects. Advancements in this category involve the creation of hydrogel-based grippers that are capable of adapting their stiffness according to external stimuli, making them more adaptable in dynamic environments. Such advancements are especially useful in industries such as healthcare and electronics, where precision and delicate handling are critical. The increasing focus on automation and the demand for flexible gripping solutions are likely to propel the use of gel-based soft grippers, fueling the segment's strong growth path.
By Component
In 2023, the Soft Actuators segment held a large 43.67% market share in the Soft Gripper Market, reflecting their central role in facilitating flexible and adaptive gripping mechanisms. These actuators, frequently made of compliant materials, enable grippers to adapt to object shapes, making them crucial across industries such as food processing, electronics, and healthcare. Specifically, Festo presented an adaptive gripper with a silicone cap that conforms to objects to keep them securely in hand regardless of their varied shape and size. Likewise, OnRobot presented the VGC10, a small electric vacuum gripper that is ideal for space-limited applications, increasing adaptability in automation processes. Such presentations point to the contribution of the segment in the overall Soft Gripper Market, allowing for the safer and more efficient handling of fragile items.
The Control Systems segment is expected to witness the Fastest CAGR of 12.08% during the Soft Gripper Market between 2024 and 2032. This is due to the growing use of intelligent control mechanisms that increase the accuracy and flexibility of soft grippers. For example, Schmalz launched soft robotic grippers with pressure-sensitive sensors, enhancing grip control accuracy and minimizing product defects in high-precision assembly lines.
Moreover, OnRobot's innovation in adaptive electric soft grippers that can adjust the force in real-time has highly enhanced the handling of sensitive electronic components in a safe manner. Such control system advancements are significant in opening the use of soft grippers to other industries by ensuring efficient and accurate automation procedures.
By Application
In 2023, the Food and Beverage Industry was the leading application segment in the Soft Gripper Market, generating 35.12% of the total revenue. This is due to the growing automation of food processing and packaging, where delicate items need to be handled carefully. Firms such as Festo have come up with bio-inspired soft robotic grippers that replicate human hand motion, improving accuracy and product damage in food processing by 28%. Soft Robotics has also come up with AI-powered gripping systems, boosting the accuracy of object identification by 40% and automation speed in logistics and warehouse activities by 35%. These innovations highlight the critical contribution of soft grippers to the food and beverage industry's exacting hygiene and handling demands.
The Electronics segment is likely to have the Fastest CAGR of 11.76% during the Soft Gripper Market from 2024-2032. This is stimulated by growing need for precision and gentle handling when assembling electronic components. OnRobot has launched electric soft grippers with force control in real time, cutting damage to components by 28% and making the 3C assembly lines more efficient by 33%. In addition, Schmalz presented soft robotic grippers embedded with pressure-sensitive sensors, enhancing the accuracy of grip control by 36% and product defects in high-precision assembly lines by 31%. The achievements showcase the pivotal role of soft grippers in automating and precision in the electronics manufacturing industry.
Soft Gripper Market Regional Outlook
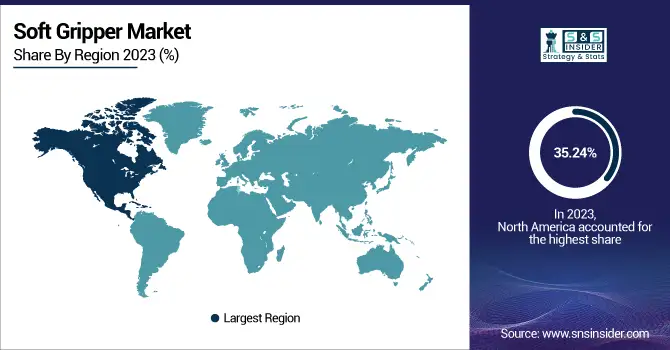
The North America dominated the Soft Gripper Market in 2023 with 35.24% of world revenues. Its drive comes from sound investments in industry automation, such as in the food & beverage, logistics, and healthcare industries. Dominant players like Soft Robotics, Inc. have ventured into revolutionary tools such as the mGripAI platform that integrates soft grippers and AI for enhanced packaging of foods.
Get Customized Report as per Your Business Requirement - Enquiry Now
Moreover, Bioservo Technologies introduced the upgraded version of Ironhand, a soft robot muscle-strengthening technology, with additional strength and greater performance. The developments highlight the dedication of North America to adapting the latest hardy soft gripper technologies as it solidifies its market superiority.
The Asia Pacific region is expected to witness the Fastest of 11.33% in the Soft Gripper Market between 2024 and 2032. This is driven by fast industrialization, growing automation in manufacturing, and growing labor costs in nations such as China, Japan, and India. Large firms like Yaskawa Electric Corporation have introduced plug-and-play robotic systems such as the MOTOMAN Smart Series, making it easier to integrate soft grippers in applications.
In addition, Piab AB added the 100-4 model to its piSOFTGRIP series, which is intended for the handling of irregularly shaped machine parts in the food sector. These releases underscore the region's widening adoption of soft gripper technologies, making Asia Pacific a key growth driver in the international market.
Key Players Listed in the Soft Gripper Market are
-
Soft Robotics, Inc. – (mGrip, mGripAI)
-
OnRobot – (Soft Gripper SG-a-H, Soft Gripper SG-b-H)
-
Festo AG & Co. KG – (OctopusGripper, BionicSoftHand)
-
SCHUNK GmbH & Co. KG – (Co-act EGL-C, Co-act EGP-C)
-
ABB Ltd. – (SoftGripper, FlexGripper)
-
RightHand Robotics, Inc. – (RightPick 3, RightPick 2)
-
Piab AB – (piSOFTGRIP 50-2, piSOFTGRIP 100-3)
-
Ubiros – (Gentle Duo, Gentle Pro)
-
Universal Robots – (UR+ OnRobot Soft Gripper, UR+ SRT Soft Gripper)
-
Flexiv Ltd. – (Rizon 4 with Soft Gripper, Rizon 10 with Soft Gripper)
Recent Development
-
April 2024, OnRobot introduced two high-payload electric grippers, the 2FG14 and 3FG25, designed for collaborative applications.
-
May 2024, Ubiros is conducting a pilot program with Mitsubishi to enhance its Gentle gripper technology for industrial applications.
| Report Attributes | Details |
|---|---|
| Market Size in 2023 | USD 1.36 Billion |
| Market Size by 2032 | USD 3.10 Billion |
| CAGR | CAGR of 9.72 % From 2024 to 2032 |
| Base Year | 2023 |
| Forecast Period | 2024-2032 |
| Historical Data | 2020-2022 |
| Report Scope & Coverage | Market Size, Segments Analysis, Competitive Landscape, Regional Analysis, DROC & SWOT Analysis, Forecast Outlook |
| Key Segments | •By Component – (Soft Actuators, Soft Sensors, Control Systems, Power Sources, Others) •By Material – (Elastomers, Gels, Fabrics, Others ) •By Application – (Healthcare and Medical, Food and Beverage, Logistics and warehousing, Automotive, Agriculture, Electronics, Others ) |
| Regional Analysis/Coverage | North America (US, Canada, Mexico), Europe (Eastern Europe [Poland, Romania, Hungary, Turkey, Rest of Eastern Europe] Western Europe] Germany, France, UK, Italy, Spain, Netherlands, Switzerland, Austria, Rest of Western Europe]), Asia Pacific (China, India, Japan, South Korea, Vietnam, Singapore, Australia, Rest of Asia Pacific), Middle East & Africa (Middle East [UAE, Egypt, Saudi Arabia, Qatar, Rest of Middle East], Africa [Nigeria, South Africa, Rest of Africa], Latin America (Brazil, Argentina, Colombia, Rest of Latin America) |
| Company Profiles | Soft Robotics, Inc., OnRobot, Festo AG & Co. KG, SCHUNK GmbH & Co. KG, ABB Ltd., RightHand Robotics, Inc., Piab AB, Ubiros, Universal Robots, Flexiv Ltd. |
Frequently Asked Questions
North America dominated the Soft Gripper Market in 2023.
The Soft Actuators segment dominated the Soft Gripper Market.
The major growth factor of the Soft Gripper Market is the increasing automation across industries, particularly in food and beverage, logistics, and healthcare sectors.
The Soft Gripper Market size was USD 1.36 billion in 2023 and is expected to reach USD 3.10 billion by 2032.
The Soft Gripper Market is expected to grow at a CAGR of 9.72% from 2024-2032.
Get in Touch
