image

Pressure Sensor Market Report Scope & Overview:

Pressure Sensor Market Size was valued at USD 18.86 billion in 2022 and is expected to reach USD 26.22 billion by 2030 and grow at a CAGR of 4.2% over the forecast period 2023-2030.

The pressure sensor is a device that senses pressure and converts it into an electrical signal where the value depends on the pressure applied. Receives, evaluates, and transmits information, which helps analyze device performance. It uses IC fabrication technology made from silicon wafers. It monitors and regulates pressure, usually gases, and liquids.

Pressure Sensor Market Revenue Analysis

Get more information on Pressure Sensor Market - Request Sample Report
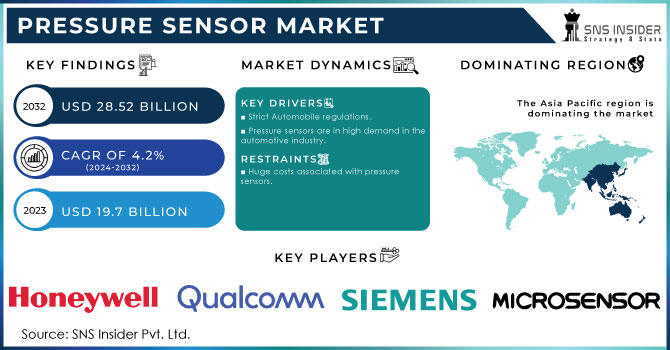
MARKET DYNAMICS:

KEY DRIVERS:

  • Strict Automobile regulations.

  • Pressure sensors are in high demand in the automotive industry.

RESTRAINTS:

  • Huge costs associated with pressure sensors.

OPPORTUNITIES:

  • Expansion of the consumer electronics industry.

  • End-user industries are increasingly adopting the Internet of Things (IoT).

CHALLENGES:

  • Demand from the oil and gas industry has decreased due to the COVID-19 pandemic.

  • Significant regulatory barriers.

IMPACT OF COVID-19:

Due to the outbreak of covid 19 in global industries, there are many factors that affect the need for pressure sensors. The marketing process is facing challenges at the moment. The closure of the facilities limits the production process of the market. In particular, the Asian Pacific region when faced with a lot of difficulties performing market functions during this epidemic. In the past, market demand was slowing due to demand from the automotive and smartphone industry. However, with the outbreak of the disease, the prevalence in these areas is low. In the coming years, the market is gaining momentum in many regions. The need for pressure sensors will gradually increase in the coming years. Also, manufacturing activities are experiencing a sudden increase due to the small spread of disease. In the forecast period, demand from key end users will keep the growth of the pressure sensor market.

Based on Product, the pressure sensor market is segmented into Absolute, Differential, Vacuum, Gauge, and Sealed Pressure Sensors.

The market for the differential pressure sensor segment is expected to grow at a very high CAGR from 2023 to 2030. Growth may be due to their widespread use in the industrial area. In industrial processes, differential pressure sensors are included as key components of multiple devices to measure the flow of liquids and gases due to pressure differences across all of these. They are also used to measure pressure in air, acids, foundations, pressurized gases, water, steam, pressure drop across all oil filters or air filters, liquid levels, and flow rates. In addition, differential pressure sensors may be retrofitted and mounted on the vessels.

Based on Technology, the pressure sensor market is segmented into Capacitive, Piezoresistive, Electromagnetic, Optical, Resonant Solid-state, and  Others.

The optical technology segment is expected to grow at a very high CAGR during the forecast period. Growth may be due to the increased use of pressure sensors based on visual acuity in harsh environments. These sensors are small in size, flexible, and are made using non-toxic materials. They are able to withstand magnetic disturbances and work well on systems where other pressure sensors fail due to these disturbances. These pressure sensors work best when there are chemicals or explosive substances. Because of this, they are very suitable for medical and oil and gas use.

Based on Industrial Vertical, the pressure sensor market is segmented into Automotive, Industrial, Aviation, Marine, Consumer Electronics, Medical, Utilities, Oil & Gas, and Others.

Consumer electronics is expected to grow at the fastest rate. The rising demand for pressure sensors in smartphones, wearables, and tablets can be attributed to their various advantages such as small size, low cost, and high power efficiency. Because of advancements in MEMS technology, these sensors can be even smaller and integrated into a variety of consumer electronic devices. Pressure sensors, in addition to the devices mentioned above, are in high demand from gaming and navigation applications, as well as home appliances.
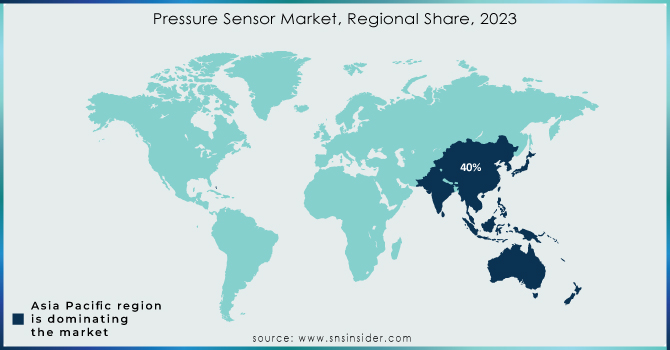
MARKET SEGMENTS:

BY SENSOR TYPE

BY PRODUCT

  • Absolute Pressure Sensors

  • Differential Pressure Sensors

  • Vacuum Pressure Sensors

  • Gauge Pressure Sensors

  • Sealed Pressure Sensors

BY TECHNOLOGY

  • Capacitive

  • Piezoresistive

  • Electromagnetic

  • Optical

  • Resonant Solid-state

  • Others

BY FUNCTIONS

  • Altitude Sensing

  • Depth Sensing

  • Pressure Sensing

  • Flow Sensing

  • Temperature Sensing

BY INDUSTRY VERTICAL

  • Automotive

  • Industrial

  • Aviation

  • Marine

  • Consumer Electronics

  • Medical

  • Utilities

  • Oil & Gas

  • Others

BY END USE

  • Automotive On-vehicle

  • HVAC Systems

  • Testing & Measurement Equipment

  • Medical Devices

  • Process Control Solutions

  • Others

Pressure Sensor Market Segmentation Analysis

Get Customized Report as per your Business Requirement - Request For Customized Report

REGIONAL ANALYSIS:

The Asia Pacific regional market dominated the pressure sensor market and accounted for more than 40% of the global revenue share. Partial growth can be attributed to the mass production of electronic components and the growth of investment in R&D. The growing demand for consumer electronics such as tablets, apparel, and smartphones drive the demand for pressure sensors in this region. India and China are major contributors to the regional pressure sensor market. China is a mature market and has strong business opportunities. During the forecast period, North America is expected to be the fastest-growing regional market. The North American regional market is expected to witness growth, due to the huge demand for pressure sensors in TPMS and EGR applications in the automotive sector. The presence of key players in the region is also one of the major factors driving market growth. At the same time, the growing demand for pressure sensors in industries such as oil and gas, petrochemical, and medical is also accelerating market growth in the region.

REGIONAL COVERAGE:

  • North America

    • USA

    • Canada

    • Mexico

  • Europe

    • Germany

    • UK

    • France

    • Italy

    • Spain

    • The Netherlands

    • Rest of Europe

  • Asia-Pacific

    • Japan

    • South Korea

    • China

    • India

    • Australia

    • Rest of Asia-Pacific

  • The Middle East & Africa

    • Israel

    • UAE

    • South Africa

    • Rest of the Middle East & Africa

  • Latin America

    • Brazil

    • Argentina

    • Rest of Latin America

KEY PLAYERS:

The key players in the Pressure sensor market are Honeywell International, Qualcomm Technologies, Texas Instruments, NXP Semiconductor, ABB Ltd, Siemens Ag, Sensata Technologies, TE Connectivity, Micro Sensor, Quartzdyne, Inc, Emerson Electric, Amphenol, BD Sensors GmbH & Other Players.

Qualcomm Technologie-Company Financial Analysis

Pressure Sensor Market Report Scope:

Report Attributes Details
Market Size in 2022 US$ 18.86 Billion
Market Size by 2030 US$ 26.22 Billion
CAGR CAGR of 4.2% From 2023 to 2030
Base Year 2022
Forecast Period 2023-2030
Historical Data 2020-2021
Report Scope & Coverage Market Size, Segments Analysis, Competitive  Landscape, Regional Analysis, DROC & SWOT Analysis, Forecast Outlook
Key Segments • By Sensor Type (Wired Sensors, Wireless Sensors)
• By Product (Absolute Pressure Sensors, Differential Pressure Sensors, Vacuum Pressure Sensors, Gauge Pressure Sensors, Sealed Pressure Sensors)
• By Technology (Capacitive, Piezoresistive, Electromagnetic, Optical, Resonant Solid-State, Others)
• By Functions (Altitude Sensing, Depth Sensing, Pressure Sensing, Flow Sensing, Temperature Sensing)
• By Industry Vertical (Automotive, Industrial, Aviation, Marine, Consumer Electronics, Medical, Utilities, Oil & Gas, Others)
• By End Use (Automotive On-Vehicle, HVAC Systems, Testing & Measurement Equipment, Medical Devices, Process Control Solutions, Others)
Regional Analysis/Coverage North America (USA, Canada, Mexico), Europe
(Germany, UK, France, Italy, Spain, Netherlands,
Rest of Europe), Asia-Pacific (Japan, South Korea,
China, India, Australia, Rest of Asia-Pacific), The
Middle East & Africa (Israel, UAE, South Africa,
Rest of Middle East & Africa), Latin America (Brazil, Argentina, Rest of Latin America)
Company Profiles Honeywell International, Qualcomm Technologies, Texas Instruments, NXP Semiconductor, ABB Ltd, Siemens Ag, Sensata Technologies, TE Connectivity, Micro Sensor, Quartzdyne, Inc, Emerson Electric, Amphenol, BD Sensors GmbH and other key players.
Key Drivers • Strict Automobile regulations.
• Pressure sensors are in high demand in the automotive industry.
Restraints • Huge cost associated with pressure sensors.

Frequently Asked Questions

The market value will be expected to reach USD 26.22 billion by 2030.

Strict Automobile regulations, and Pressure sensors are in high demand in the automotive industry.

The key players in the Pressure sensor market are Honeywell International, Qualcomm Technologies, Texas Instruments, NXP Semiconductor, ABB Ltd, Siemens Ag, Sensata Technologies, TE Connectivity, Micro Sensor, Quartzdyne, Inc, Emerson Electric, Amphenol, BD Sensors GmbH and other key players.

Yes, and they are Raw material vendors, Distributors/traders/wholesalers/suppliers, Regulatory authorities, including government agencies and NGO, Commercial research & development (R&D) institutions, Importers and exporters, Government organizations, research organizations, and consulting firms, Trade/Industrial associations, End-use industries.

Manufacturers, Consultants, Association, Research Institutes, private and university libraries, suppliers, and distributors of the product.

Table of Contents

1. Introduction

1.1 Market Definition

1.2 Scope

1.3 Research Assumptions

2. Research Methodology

3. Market Dynamics

3.1 Drivers

3.2 Restraints

3.3 Opportunities

3.4 Challenges

4. Impact Analysis

4.1 COVID-19 Impact Analysis

4.2 Impact of Ukraine- Russia war

4.3 Impact of ongoing Recession

4.3.1 Introduction

4.3.2 Impact on major economies

4.3.2.1 US

4.3.2.2 Canada

4.3.2.3 Germany

4.3.2.4 France

4.3.2.5 United Kingdom

4.3.2.6 China

4.3.2.7 Japan

4.3.2.8 South Korea

4.3.2.9 Rest of the World

5. Value Chain Analysis

6. Porter’s 5 forces model

7.  PEST Analysis


8. Pressure Sensor Segmentation, by sensor type

8.1 Introduction

8.2 Wired Sensors

8.3 Wireless Sensors

9. Pressure Sensor Segmentation, by product

9.1 Introduction

9.2 Absolute Pressure Sensors

9.3 Differential Pressure Sensors

9.4 Vacuum Pressure Sensors

9.5 Gauge Pressure Sensors

9.6 Sealed Pressure Sensors

10. Pressure Sensor Segmentation, by technology

10.1 Introduction

10.2 Capacitive

10.3 Piezoresistive

10.4 Electromagnetic

10.5 Optical

10.6 Resonant Solid-state

10.7 Others

11. Pressure Sensor Segmentation, by functions

11.1 Introduction

11.2 Altitude Sensing

11.3 Depth Sensing

11.4 Pressure Sensing

11.5 Flow Sensing

11.6 Temperature Sensing

12. Pressure Sensor Segmentation, by industry vertical

12.1 Introduction

12.2 Automotive

12.3 Industrial

12.4 Aviation

12.5 Marine

12.6 Consumer Electronics

12.7 Medical

12.8 Utilities

12.9 Oil & Gas

12.10 Others

13. Pressure Sensor Segmentation, by end use

13.1 Introduction

13.2 Automotive On-vehicle

13.3 HVAC Systems

13.4 Testing & Measurement Equipment

13.5 Medical Devices

13.6 Process Control Solutions

13.7 Others

14. Regional Analysis

14.1 Introduction

14.2 North America

14.2.1 USA

14.2.2 Canada

14.2.3 Mexico

14.3 Europe

14.3.1 Germany

14.3.2 UK

14.3.3 France

14.3.4 Italy

14.3.5 Spain

14.3.6 The Netherlands

14.3.7 Rest of Europe

14.4 Asia-Pacific

14.4.1 Japan

14.4.2 South Korea

14.4.3 China

14.4.4 India

14.4.5 Australia

14.4.6 Rest of Asia-Pacific

14.5 The Middle East & Africa

14.5.1 Israel

14.5.2 UAE

14.5.3 South Africa

14.5.4 Rest

14.6 Latin America

14.6.1 Brazil

14.6.2 Argentina

14.6.3 Rest of Latin America

15.Company Profiles

15.1 Texas Instruments

15.1.1 Financial

15.1.2 Products/ Services Offered

15.1.3 SWOT Analysis

15.1.4 The SNS view

15.2 Honeywell International

15.3 Qualcomm Technologies

15.4 NXP Semiconductor

15.5 ABB Ltd

15.6 Siemens Ag

15.7 Sensata Technologies

15.8 TE Connectivity

15.9 Micro Sensor

15.10 Quartzdyne, Inc

15.11 Emerson Electric

15.12 Amphenol

15.13 BD sensors GmbH

15.14 Others

16. Competitive Landscape

16.1 Competitive Benchmark

16.2 Market Share Analysis

16.3 Recent Developments

17. Conclusion

An accurate research report requires proper strategizing as well as implementation. There are multiple factors involved in the completion of good and accurate research report and selecting the best methodology to compete the research is the toughest part. Since the research reports we provide play a crucial role in any company’s decision-making process, therefore we at SNS Insider always believe that we should choose the best method which gives us results closer to reality. This allows us to reach at a stage wherein we can provide our clients best and accurate investment to output ratio.

Each report that we prepare takes a timeframe of 350-400 business hours for production. Starting from the selection of titles through a couple of in-depth brain storming session to the final QC process before uploading our titles on our website we dedicate around 350 working hours. The titles are selected based on their current market cap and the foreseen CAGR and growth.


The 5 steps process:

Step 1: Secondary Research:

Secondary Research or Desk Research is as the name suggests is a research process wherein, we collect data through the readily available information. In this process we use various paid and unpaid databases which our team has access to and gather data through the same. This includes examining of listed companies’ annual reports, Journals, SEC filling etc. Apart from this our team has access to various associations across the globe across different industries. Lastly, we have exchange relationships with various university as well as individual libraries.

Secondary Research

Step 2: Primary Research

When we talk about primary research, it is a type of study in which the researchers collect relevant data samples directly, rather than relying on previously collected data.  This type of research is focused on gaining content specific facts that can be sued to solve specific problems. Since the collected data is fresh and first hand therefore it makes the study more accurate and genuine.

We at SNS Insider have divided Primary Research into 2 parts.

Part 1 wherein we interview the KOLs of major players as well as the upcoming ones across various geographic regions. This allows us to have their view over the market scenario and acts as an important tool to come closer to the accurate market numbers. As many as 45 paid and unpaid primary interviews are taken from both the demand and supply side of the industry to make sure we land at an accurate judgement and analysis of the market.

This step involves the triangulation of data wherein our team analyses the interview transcripts, online survey responses and observation of on filed participants. The below mentioned chart should give a better understanding of the part 1 of the primary interview.

Primary Research

Part 2: In this part of primary research the data collected via secondary research and the part 1 of the primary research is validated with the interviews from individual consultants and subject matter experts.

Consultants are those set of people who have at least 12 years of experience and expertise within the industry whereas Subject Matter Experts are those with at least 15 years of experience behind their back within the same space. The data with the help of two main processes i.e., FGDs (Focused Group Discussions) and IDs (Individual Discussions). This gives us a 3rd party nonbiased primary view of the market scenario making it a more dependable one while collation of the data pointers.

Step 3: Data Bank Validation

Once all the information is collected via primary and secondary sources, we run that information for data validation. At our intelligence centre our research heads track a lot of information related to the market which includes the quarterly reports, the daily stock prices, and other relevant information. Our data bank server gets updated every fortnight and that is how the information which we collected using our primary and secondary information is revalidated in real time.

Data Bank Validation

Step 4: QA/QC Process

After all the data collection and validation our team does a final level of quality check and quality assurance to get rid of any unwanted or undesired mistakes. This might include but not limited to getting rid of the any typos, duplication of numbers or missing of any important information. The people involved in this process include technical content writers, research heads and graphics people. Once this process is completed the title gets uploader on our platform for our clients to read it.

Step 5: Final QC/QA Process:

This is the last process and comes when the client has ordered the study. In this process a final QA/QC is done before the study is emailed to the client. Since we believe in giving our clients a good experience of our research studies, therefore, to make sure that we do not lack at our end in any way humanly possible we do a final round of quality check and then dispatch the study to the client.

Start a Conversation

Hi! Click one of our member below to chat on Phone