Waste to Energy Market Report Scope & Overview:
Get More Information on Waste to Energy Market - Request Sample Report
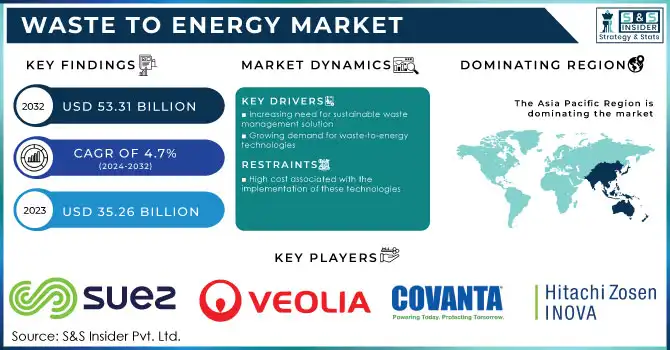
The Waste to Energy Market Size was valued at USD 35.26 Billion in 2023 and is projected to reach USD 53.31 Billion by 2032, growing at a compound annual growth rate (CAGR) of 4.7% from 2024 to 2032.
Waste-to-energy is a process that involves converting waste materials into usable energy. This process is becoming increasingly popular as a means of reducing waste and generating renewable energy. The waste materials can come from a variety of sources, including municipal solid waste, agricultural waste, and industrial waste. The process of waste-to-energy typically involves the use of incineration or gasification to convert the waste materials into energy. Incineration involves burning the waste materials at high temperatures, while gasification involves heating the waste materials in the absence of oxygen to produce a gas that can be used to generate electricity. Waste-to-energy has several benefits, including reducing the amount of waste that ends up in landfills, reducing greenhouse gas emissions, and generating renewable energy. However, it is important to ensure that the process is carried out in an environmentally responsible manner to minimize any negative impacts on the environment.
This innovative Waste-to-energy approach to waste management not only reduces the amount of waste in landfills but also provides a sustainable source of energy. The market is driven by the increasing demand for renewable energy sources and the need to reduce greenhouse gas emissions. Waste-to-energy technologies include incineration, gasification, pyrolysis, and biochemical process which convert waste into electricity, heat, and fuel. The Waste-to-Energy Market has significant potential for growth, particularly in developing countries where waste management is a major challenge. However, there are also concerns about the environmental impact of waste-to-energy technologies, such as air pollution and the release of toxic substances. To address these concerns, the industry is investing in research and development to improve the efficiency and sustainability of waste-to-energy technologies. Additionally, governments are implementing regulations and initiatives to encourage the adoption of these technologies.
Market Dynamics
Drivers
-
Increasing need for sustainable waste management solution
-
Growing demand for waste-to-energy technologies
-
Increasing amount of waste due to growing population across the globe
The world produces around 2.02 billion tons of municipal solid waste each year, with a conservative estimate of at least 34% of that not being managed in an environmentally safe manner. Unfortunately, the generation of waste has experienced a significant surge worldwide in recent decades, and there are no signs of it slowing down. By 2050, it is projected that worldwide municipal solid waste generation will have increased by approximately 71%, reaching 3.5 billion metric tons. This is due to a variety of factors, including population growth, urbanization, economic expansion, and consumer shopping habits. As a result, the waste-to-energy market is being driven and is expected to continue to grow in the future.
Restrain
-
High cost associated with the implementation of these technologies
-
High initial investment required to set up a waste-to-energy plant
Opportunities
-
Technological upgradation increases the adoption of waste-to-energy technologies
-
Increasing government regulations and initiatives to reduce greenhouse gas emissions
Challenges
-
Concerns about the environmental impact of these technologies
-
Lack of public awareness and understanding of these technologies
Waste-to-energy plants have faced significant challenges regarding their safety and effectiveness, making it challenging to gain public support for these projects. Furthermore, concerns about potential air and water pollution from these plants have created additional barriers to their adoption. Despite the potential benefits of waste-to-energy plants, such as reducing landfill waste and generating renewable energy, many individuals remain hesitant to embrace this technology. Lack of understanding about how these plants operate and the measures in place to ensure their safety can hinder the waste-to-energy market growth. Moreover, rising concerns about pollution from waste-to-energy plants further impede market growth. These technologies emit various pollutants, including particulate matter, nitrogen oxides, and sulfur dioxide, which can have adverse effects on air quality and public health. Additionally, the disposal of ash generated from these plants can pose a risk to water sources if not properly managed.
Impact of Russia-Ukraine War:
The waste-to-energy market is a crucial component of the global effort to reduce greenhouse gas emissions and promote sustainable development. The Russia-Ukraine conflict has disrupted the waste-to-energy market significantly. The supply chains for waste materials have been disrupted due to the closure of borders and the imposition of trade restrictions. This has led to a shortage of waste materials, which has affected the operations of waste-to-energy plants. Moreover, changes in regulations have also affected the waste-to-energy market. Governments in the region have introduced new regulations to address the environmental impact of waste-to-energy plants. These regulations have increased the cost of operating these plants, making them less profitable. Furthermore, the economic instability in the region has also affected the waste-to-energy market. The conflict has led to a decline in economic activity, which has reduced the demand for energy. For instance, Total energy consumption in Europe is expected to decrease by around 455 petajoules due to this war. This has made it difficult for waste-to-energy plants to sell their energy output, leading to a decline in revenue.
Impact of Recession:
The downturn in the global economy has led to a decrease in demand for waste-to-energy technologies and services. This has resulted in a slowdown in the growth of the waste-to-energy market. The recession has also led to a decrease in investment in the waste-to-energy sector. Many investors have become more risk-averse and are hesitant to invest in new waste-to-energy projects. This has led to a decrease in the number of new waste-to-energy facilities being built. More details are comprised in the final report.
Key Market Segmentation
By Technology
-
Biochemical
-
Thermal
-
Pyrolysis
-
Incineration
By Waste Type
-
Agriculture Waste
-
Process Waste
-
Municipal Solid Waste
-
Others
By Application
-
Heat
-
Fuel
-
Electricity
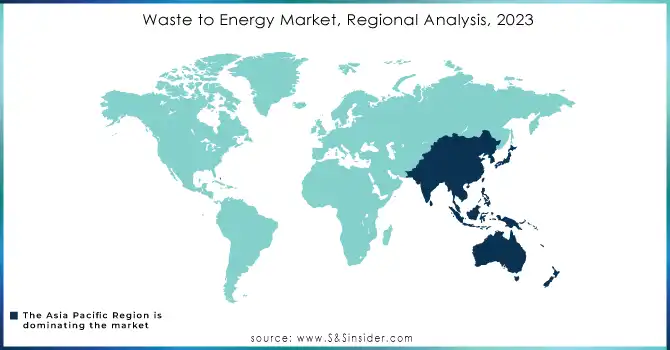
Regional Analysis
Asia Pacific holds the largest revenue share of waste to energy market in 2023 and is expected to dominate the market during the forecast period. This is attributed to the region's growing population and increasing urbanization, which is driving up waste production. The East Asia and Pacific Regions generate the most municipal solid waste (MSW), with China being responsible for over 16% of global MSW. Governments in the Asia Pacific region are investing in waste-to-energy technologies to address environmental concerns and meet energy demands. This investment is expected to result in significant growth in the waste-to-energy market in the coming years.
The North American region holds the second-largest position in the waste-to-heat generation market, and it is anticipated to maintain a substantial revenue share throughout the projected period. This is attributed to increasing awareness of the benefits of waste-to-heat generation along with increasing waste production. In terms of population, the United States is the biggest producer of waste. The United States is the biggest producer of waste in terms of population, accounting for roughly 13% of global MSW despite having less than 5% of the global population. On average, Americans produce over 820 kilograms of waste every year, more than double the per capita waste generation of Japan.
The United States and China are the largest producers of municipal waste in the world, generating over 220 million metric tons. In contrast, the UK generated around 32 million tons of municipal waste in 2020.
Do You Need any Customization Research on Waste to Energy Market - Enquire Now
REGIONAL COVERAGE:
-
North America
-
USA
-
Canada
-
Mexico
-
-
Europe
-
Germany
-
UK
-
France
-
Italy
-
Spain
-
The Netherlands
-
Rest of Europe
-
-
Asia-Pacific
-
Japan
-
south Korea
-
China
-
India
-
Australia
-
Rest of Asia-Pacific
-
-
The Middle East & Africa
-
Israel
-
UAE
-
South Africa
-
Rest of the Middle East & Africa
-
-
Latin America
-
Brazil
-
Argentina
-
Rest of Latin America
-
Key Players
The major players are Suez, Veolia, Covanta Holding Corporation, Hitachi Zosen Inova AG, China Everbright International Limited, Wheelabrator Technologies Inc, Ramboll Group A/S, EDF, Allseas, Babcock & Wilcox Enterprises, Inc., Xcel Energy Inc., and other key players will be included in the final report.
Recent Developments:
-
In April of 2022, SUEZ announced its achievement: winning a new industrial wastewater treatment project in Changshu, Jiangsu. This project is set to contribute significantly to the city's high-quality socio-economic development, with a total investment of RMB 258 million and a daily treatment capacity of 15,000 m3.
-
In April 2023, Veolia has been awarded the contract for the operation and maintenance of Turkey's first waste-to-energy plant in Istanbul. This particular plant has an impressive processing capacity of roughly 1.1 million tonnes of non-recyclable household waste annually. Equipped with an 85 MW turbine, it will produce 560,000 MWh of electricity annually, meeting the needs of 1.4 million inhabitants.
| Report Attributes | Details |
| Market Size in 2022 | US$ 35.26 Billion |
| Market Size by 2030 | US$ 53.31 Billion |
| CAGR | CAGR of 4.7% From 2023 to 2032 |
| Base Year | 2023 |
| Forecast Period | 2024-2032 |
| Historical Data | 2020-2022 |
| Report Scope & Coverage | Market Size, Segments Analysis, Competitive Landscape, Regional Analysis, DROC & SWOT Analysis, Forecast Outlook |
| Key Segments | • By Technology (Biochemical and Thermal) • By Waste Type (Agriculture Waste, Process Waste, Municipal Solid Waste, and Others) • By Application (Heat, Fuel, and Electricity) |
| Regional Analysis/Coverage | North America (USA, Canada, Mexico), Europe (Germany, UK, France, Italy, Spain, Netherlands, Rest of Europe), Asia-Pacific (Japan, South Korea, China, India, Australia, Rest of Asia-Pacific), The Middle East & Africa (Israel, UAE, South Africa, Rest of Middle East & Africa), Latin America (Brazil, Argentina, Rest of Latin America) |
| Company Profiles | Suez, Veolia, Covanta Holding Corporation, Hitachi Zosen Inova AG, China Everbright International Limited, Wheelabrator Technologies Inc, Ramboll Group A/S, EDF, Allseas, Babcock & Wilcox Enterprises, Inc., Xcel Energy Inc. |
| Key Drivers | • Increasing need for sustainable waste management solution • Growing demand for waste-to-energy technologies |
| Market Opportunities | • Technological upgradation increases the adoption of waste-to-energy technologies • Increasing government regulations and initiatives to reduce greenhouse gas emissions |
Frequently Asked Questions
Increasing need for sustainable waste management solutions, growing demand for waste-to-energy technologies, and an increasing amount of waste due to the growing population across the globe are the driving factors of the Waste to Energy Market.
Asia Pacific region dominated the Waste to Energy Market.
The major key players in the Waste to Energy Market are Suez, Veolia, Covanta Holding Corporation, Hitachi Zosen Inova AG, China Everbright International Limited, Wheelabrator Technologies Inc, Ramboll Group A/S, EDF, Allseas, Babcock & Wilcox Enterprises, Inc., and Xcel Energy Inc.
The market size of the Waste to Energy Market is USD 35.26 billion in 2023.
The expected CAGR of the global Waste to Energy Market during the forecast period is 4.7%.
Get in Touch
