E-Waste Management Market Size & Growth:
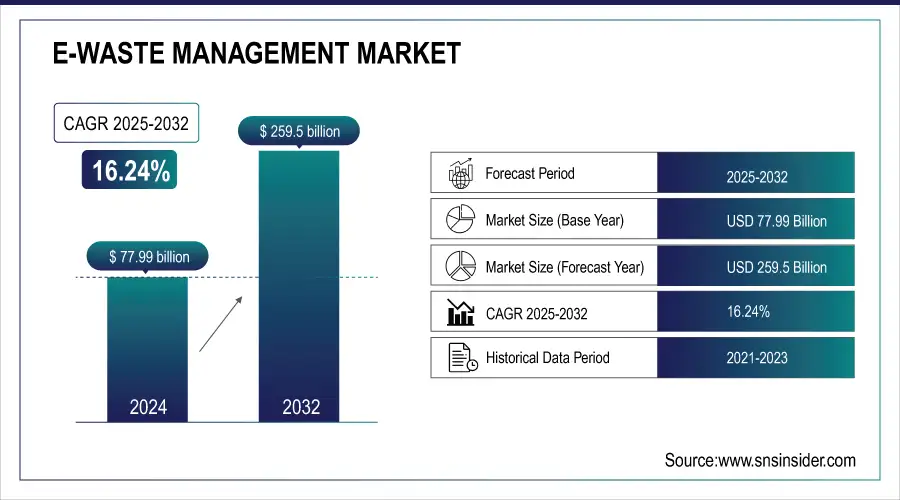
The E-Waste Management Market was valued at USD 77.99 Billion in 2024 and is expected to reach USD 259.5 Billion by 2032, growing at a CAGR of 16.24% from 2025-2032.
The E-Waste Management Market in 2023 saw Asia leading in e-waste generation due to high electronics consumption, followed by Europe and North America while developing regions struggled with infrastructure challenges. Recycling is evolving from informal disposal to AI-driven sorting and circular economy practices, driven by stricter government regulations. This report also explores market drivers, technological advancements, regulatory frameworks, sustainability efforts, and competitive dynamics shaping the industry.
E-Waste Management Market Size and Forecast:
-
Market Size in 2024 USD 77.99 Billion
-
Market Size by 2032 USD 259.5 Billion
-
CAGR of 16.24% From 2025 to 2032
-
Base Year 2024
-
Forecast Period 2025-2032
-
Historical Data 2021-2023
To Get more information on E-Waste Management Market - Request Free Sample Report
E-Waste Management Market Trends:
-
Growing adoption of AI and machine learning for precise material sorting and recovery in e-waste recycling processes.
-
Increased use of robotics and automation to safely dismantle complex electronic devices and improve operational efficiency.
-
Rising government regulations and environmental initiatives promoting responsible e-waste disposal and recycling compliance.
-
Expansion of smart recycling facilities integrating IoT and data analytics to optimize waste processing and resource recovery.
-
Growing emphasis on circular economy practices and sustainable product design to minimize electronic waste generation.
E-Waste Management Market Growth Drivers:
-
The increasing adoption of electronic devices and shorter product lifecycles are driving e-waste generation, necessitating advanced recycling solutions.
The increase in usage of electronic devices reduced life cycles of products, and increased consumer demand for smart gadgets are resulting in the generation of increasing e-waste. Obsolete gadgets make up a big part of waste piling up around as companies keep launching new models now and then. Declining prices and rising access to electronics are generating larger e-waste volumes, especially in emerging economies. This has led the government and environmental groups to call for smart waste management solutions. E-waste Management and Recycling Technologies million are going to witness high demand on account of rising awareness of responsible disposal along with stringent regulations.
E-Waste Management Market Restraints:
-
The high cost of recycling, lack of advanced processing facilities, and inefficient waste segregation hinder the growth of the e-waste management market.
Even though people are becoming more conscious of the value electronics have, recycling e-waste is still expensive because of complicated processes, manual disassembly, and expensive technologies required to recover materials. The recycling infrastructure in most developing countries is virtually non-existent and mainly done through informal sectors that are bad with e-waste. In this context, the planning involved in assembling and treating thrown-away electronic devices represents an added level of expense. On top of this, poorly segregated hazardous and non-hazardous elements also complicate recycling. Government initiatives to tier up well-organized e-waste recycling facilities are there, but still, financial hurdles and failure of public-private partnerships makes large-scale sustainable waste management solutions elusive.
E-Waste Management Market Opportunities:
-
AI-powered sorting, robotics, and automation are enhancing material recovery, reducing manual labor, and improving efficiency in e-waste recycling.
AI, robotics, and automation are changing e-waste recycling by increasing efficiency and material recovery rates. Using AI-based sorting systems, the ability to identify, classify, and extract valuable metal from discarded devices can highly perform with minimal manual labor and at reduced operating costs. By using robotics to tear apart advanced electronic devices, these potentially dangerous materials can be managed safely and efficiently. Automated dismantling of complex electronics In addition, machine learning algorithms improve recycling processes by forecasting the composition of materials and reducing the maximum yield. By investing in smart recycling technologies, companies can further their sustainability efforts while also driving substantial profit improvement in e-waste management operations.
E-Waste Management Market Segment Analysis:
By Application
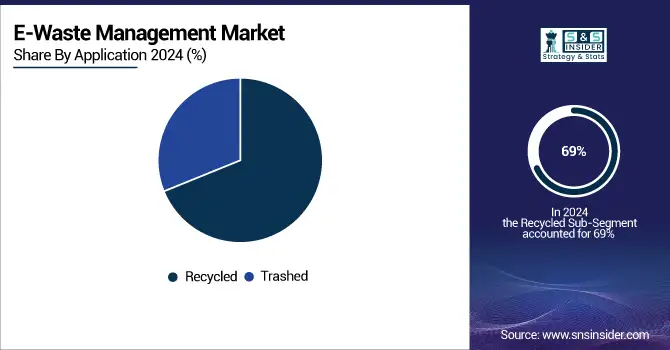
The recycled segment dominated the e-waste management market and accounted for a revenue share of more than 69% in 2024, as Governments and corporations are focusing on sustainable disposal methods and circular economy principles. This segment also benefitted from the growing implementation of extended producer responsibility policies and the advancements in material recovery technology. More investments in automated recycling techniques and AI-powered sorting make the recycled segment likely to continue to dominate.
The trashed segment is growing at the fastest CAGR during the forecast period, however, the rising volume dumped away due to increasing improperly disposed electronics, mainly in underdeveloped countries as recycling needs organized infrastructures. This trend can be attributed to a low level of awareness, insufficient regulations, and an increasing amount of electronic waste. Nonetheless, the global momentum toward formalizing e-waste collection with more stringent disposal regulations is expected to reduce unregulated e-waste dumping, ultimately directing demand toward sustainable recycling methods.
By material
The metal segment dominated the market and accounted for a revenue share of more than 43% in 2024, as the high value of recoverable gold, silver, copper, aluminum, etc. Market growth is also driven by the rising requirement for metal recovery in manufacturing industries, as well as the growing adoption of advanced recycling techniques. However, the metal segment will continue to dominate during the forecast period, owing to stricter regulations facilitating sustainable practices, as well as growing raw materials demand within the electronics industry.
The plastic segment is expected to register the fastest CAGR during the 2025-2032. This segment is driven by increasing awareness regarding environmental pollution caused by plastic waste and growing efforts to recycle these plastics using chemical and mechanical recycling methods. To combat plastic waste, governments and organizations are developing tighter regulations, which results in even more sustainable practices. Due to the rising demand for environmental recycling solutions, the plastic sub-segment is anticipated to expand rapidly during the projected period.
By Source Type
The household segment dominated the market and accounted for revenue share in 2024, owing to the high disposal rate of refrigerators, washing machines, and air conditioners. Higher consumer inclination towards upgrading home appliances, coupled with declining product life cycles, is a primary factor spurring e-waste. Stricter recycling mandates are being enforced by governments and organizations increasing efficient disposal and treatment systems. The household appliances segment is projected to continue its dominance throughout the forecast period, owing to the continuous technological advancements in recycling.
Consumer electronics is expected to register the fastest CAGR during the forecast period owing to the rapid proliferation of smartphones, laptops, tablets, and wearable devices. Repeated device upgrades and increasing digital technology penetration have started to raise electronic waste. This is attributed to the growing awareness regarding responsible disposal of e-waste as well as increased initiatives taken by key consumer electronic players to expand their take-back schemes over the last couple of years which is anticipated to further drive growth in this segment during the forecast period.
E-Waste Management Market Regional Analysis:
North America E-Waste Management Market Insights
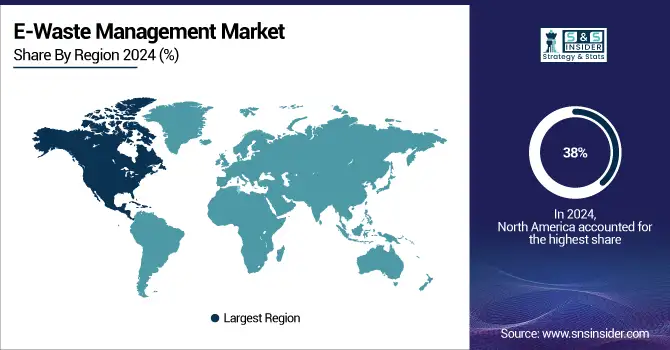
North America dominated the market and accounted for a revenue share of more than 38% in 2024, owing to its highly developed recycling infrastructure, environmental regulations, and high usage of consumer electronics. The Extended Producer Responsibility and other such initiatives taken by the government have bolstered the current practices of waste collection and recycling. Also, market growth is driven by the presence of major e-waste management companies & adoption of circular economy practices.
Get Customized Report as per Your Business Requirement - Enquiry Now
Asia Pacific E-Waste Management Market Insights
The Asia-Pacific region is experiencing the fastest CAGR, fueled by the swift development of consumer electronics, growing urbanization, and rising disposable incomes. The rapidly expanding market for smartphones and appliances, especially in China and India, has produced a boom in e-waste. Market growth is further propelled by reforms that promote responsible e-waste disposal as well as proper functioning, and advanced recycling facilities by the government. The region is projected to grow rapidly during the forecast period owing to the rising awareness regarding sustainable waste management.
Europe E-Waste Management Market Insights
Europe leads the global e-waste management market, driven by stringent EU regulations such as the WEEE Directive and strong public awareness of recycling. The region emphasizes circular economy initiatives, extended producer responsibility (EPR), and advanced material recovery technologies. Countries like Germany, the U.K., and France are investing in automated sorting and AI-based recycling systems. Collaboration between governments and private recyclers supports efficient collection, processing, and reuse of valuable electronic components, reinforcing Europe’s sustainable waste management ecosystem.
Latin America (LATAM) and Middle East & Africa (MEA) E-Waste Management Market Insights
The LATAM and MEA e-waste management markets are witnessing steady growth due to increasing electronics consumption, urbanization, and government efforts to formalize recycling systems. Countries such as Brazil, South Africa, and the UAE are implementing policies for proper e-waste collection and disposal. Growing awareness of environmental hazards and investments in recycling infrastructure are encouraging local processing facilities. However, limited regulatory enforcement and informal recycling practices still challenge market efficiency and sustainable waste management progress.
Top 15 E-Waste Management Companies are:
-
Waste Management, Inc. – eCycle
-
Electronic Recyclers International, Inc. (ERI) – Certified E-Waste Recycling
-
Sims Limited – IT Asset Disposition (ITAD)
-
Umicore – Precious Metal Recycling
-
Aurubis AG – Multi-Metal Recycling
-
Veolia Environnement S.A. – WEEE Recycling Services
-
Enviro-Hub Holdings Ltd. – Secure Data Destruction
-
Tetronics Technologies Ltd. – Plasma Arc Recycling
-
Stena Metall Group – Circular Recycling Solutions
-
MBA Polymers, Inc. – Recycled Plastics
-
Call2Recycle, Inc. – Battery Recycling
-
Global Electric Electronic Processing (GEEP) – IT Equipment Recycling
-
Ecoreco Ltd. – E-Waste Dismantling Services
-
Reclaim Technologies Pvt. Ltd. – Reverse Logistics Solutions
-
Greentec – Secure E-Waste Disposal
Recent Developments
Waste Management, Inc. is a leading North American environmental services company actively engaged in e-waste management and recycling. The company focuses on sustainable disposal, recovery, and recycling of electronic waste through advanced facilities and digital tracking systems, supporting circular economy initiatives and reducing environmental impact across electronic product lifecycles.
- Apr 2, 2025, WM Announces New, Modernized High-Tech Recycling and Renewable Gas Facilities Across U.S. — WM announced plans to invest approx. US$3 billion in its sustainability growth strategy, including upgraded recycling infrastructure.
Electronic Recyclers International, Inc. (ERI) is one of the largest fully integrated e-waste recycling and IT asset disposition (ITAD) companies in the United States. The company specializes in responsible electronic waste collection, data destruction, and material recovery, operating carbon-neutral facilities that support circular economy goals through sustainable recycling, compliance, and resource-efficient technology solutions.
-
April 21 2025, ERI and LG held free e-waste recycling events across the U.S. for Earth Day, encouraging consumers to responsibly dispose of electronics.
| Report Attributes | Details |
|---|---|
| Market Size in 2024 | USD 77.99 Billion |
| Market Size by 2032 | USD 259.5 Billion |
| CAGR | CAGR of 16.24% From 2025 to 2032 |
| Base Year | 2024 |
| Forecast Period | 2025-2032 |
| Historical Data | 2021-2023 |
| Report Scope & Coverage | Market Size, Segments Analysis, Competitive Landscape, Regional Analysis, DROC & SWOT Analysis, Forecast Outlook |
| Key Segments | • By Application (Trashed, Recycled • By Material (Metal, Plastic, Glass, Others) • By Source Type (Household Appliances, Industrial Electronics, Consumer Electronics) |
| Regional Analysis/Coverage | North America (USA, Canada, Mexico), Europe (Germany, UK, France, Italy, Spain, Netherlands, Rest of Europe), Asia-Pacific (Japan, South Korea, China, India, Australia, Rest of Asia-Pacific), The Middle East & Africa (Israel, UAE, South Africa, Rest of Middle East & Africa), Latin America (Brazil, Argentina, Rest of Latin America) |
| Company Profiles | Waste Management, Inc., Electronic Recyclers International, Inc. (ERI), Sims Limited, Umicore, Aurubis AG, Veolia Environnement S.A., Enviro-Hub Holdings Ltd., Tetronics Technologies Ltd., Stena Metall Group, MBA Polymers, Inc., Call2Recycle, Inc., Global Electric Electronic Processing (GEEP), Ecoreco Ltd., Reclaim Technologies Pvt. Ltd., Greentec, REMONDIS AG & Co. KG, Boliden AB, TES-AMM Private Limited, Capital Environment Holdings Limited, and Sembcorp Environmental Management Pte Ltd. |
Frequently Asked Questions
Ans: The E-Waste Management Market was valued at USD 77.99 Billion in 2024 and is expected to reach USD 259.5 Billion by 2032
Ans: The CAGR of the E-Waste Management Market during the forecast period is 16.24% from 2025-2032.
Ans: Asia-Pacific is expected to register the fastest CAGR during the forecast period.
Ans: The increasing adoption of electronic devices and shorter product lifecycles are driving e-waste generation, necessitating advanced recycling solutions.
Ans: Unauthorized e-waste disposal, weak regulatory enforcement, and low public awareness continue to pose challenges for responsible e-waste management
Get in Touch
