Waterproof Speakers Market Size & Trends:
The Waterproof Speakers Market size was valued at USD 10.34 billion in 2025E and is expected to reach USD 22.51 billion by 2035, growing at a CAGR of 8.09% over the forecast period of 2026-2035.
Growing demand for portable and rugged audio devices used for outdoor activities such as camping, hiking, and beach outings will fuel the Waterproof Speakers Market growth. Adoption is also being driven by consumers' awareness of waterproof technology and through Bluetooth-enabled wireless ear devices. Moreover, the growth in adventure tourism and recreational activities on the water is further driving product consumption. The addition of features like voice assistant compatibility, lengthy battery life, and design due to sleek appearance is another factor responsible for the growth of the market across the globe.
Consumers are gravitating toward IPX7-rated portable speakers offering over 10–20 hours battery life, lightweight durability (10–30 oz), and features like voice assistant support ideal for camping, beach, or poolside.
Waterproof Speakers Market Size and Forecast:
-
Market Size in 2025: USD 10.34 Billion
-
Market Size by 2035: USD 22.51 Billion
-
CAGR: 8.09% from 2026 to 2035
-
Base Year: 2025
-
Forecast Period: 2026–2035
-
Historical Data: 2022–2024

To Get more information on Waterproof Speakers Market - Request Free Sample Report
Key Trends in the Waterproof Speakers Market:
-
Rising consumer demand for durable, water-resistant audio devices for outdoor and recreational use.
-
Increasing adoption of smart and wireless speaker technologies in home entertainment and portable audio solutions.
-
Growing preference for compact, power-efficient, and long-lasting battery-powered audio devices.
-
Expansion of multi-functional speakers integrating voice assistants, connectivity features, and enhanced audio performance.
-
Rising popularity of rugged and IP-rated speakers for travel, sports, and poolside applications.
-
Higher investment by audio brands in research and development of advanced waterproof materials and acoustic designs.
-
Strategic partnerships between audio technology companies and lifestyle brands to expand market reach.
The U.S. Waterproof Speakers Market size was valued at USD 2.36 billion in 2025 and is expected to reach USD 4.25 billion by 2035, growing at a CAGR of 7.70% over the forecast period of 2026-2035. The U.S waterproof speakers market is driven by the booming outdoor recreation over 50% of Americans engage in hiking, camping, and beach activities and Bluetooth adoption with widespread portable devices and smart home growing across the nation.

Waterproof Speakers Market Drivers:
-
Rising Demand for Outdoor Audio Devices Drives Growth in Global Waterproof Speakers Market Globally
The global waterproof speakers market is mainly driven by the growing demand among customers for long-lasting, portable, outdoor moving audio devices for recreational activities. Increased adventure tourism, water sports and beach trips, and increasing inclination towards wireless connectivity through Bluetooth have substantially increased adoption. Better product specifications such as long-lasting battery, lighter weight, and voice assistant compatibility per se lure tech-savvy customers looking for comfort and utility.
The Bose SoundLink Flex (2nd Gen) floats, withstands drops, offers 12-hour battery life, and supports Bluetooth 5.3 frequently tested in real-world outdoor scenarios including lakes and sand with thousands of five-star ratings.
Waterproof Speakers Market Restraints:
-
Technical Design Limits Impact Sound Quality and Battery Life in Waterproof Speakers Hindering Market Expansion
The advancement of waterproof speakers market shall be hampered due to the technical limitation in sound quality and volume in compact, waterproof designs, which will be one of the major restraint hindering the growth of waterproof speakers market. The sealed nature needed for water resistance can throttle acoustic performance specifically of low frequencies and audiophiles may still be left wanting more. Moreover, designs are often constrained, resulting in limited battery size and affecting use over longer periods.
Waterproof Speakers Market Opportunities:
-
Emerging Markets and Innovative Designs Drive Future Growth for Waterproof Speakers Across the Globe
Expanding e-commerce platforms and increased internet penetration offer manufacturers opportunities to reach wider audiences in emerging markets. Additionally, innovation in materials and design such as solar-powered speakers and smart waterproof systems present growth potential. Untapped markets in Asia-Pacific, Latin America, and Africa provide a fertile ground for future expansion.
Asia‑Pacific accounted for 56.9% of global e‑commerce revenue in 2024, led by China's digital ecosystem; India alone had over 700 million internet users by early 2024, many accessing e‑commerce platforms via mobile apps.
Waterproof Speakers Market Challenges:
-
Navigating Waterproof Speaker Challenges With Clear Standards Enhanced Trust and Better Consumer Experience
Frequent product standardization issues, especially regarding varying IP ratings, can create confusion among consumers about true waterproof capabilities. Inconsistent labeling or poor third-party validation reduces trust. Moreover, counterfeit or low-quality products flooding online marketplaces can dilute brand reputation and affect customer satisfaction. Manufacturers must balance innovation, durability, and user experience while meeting evolving global safety and quality regulations.
Waterproof Speakers Market Segmentation Analysis:
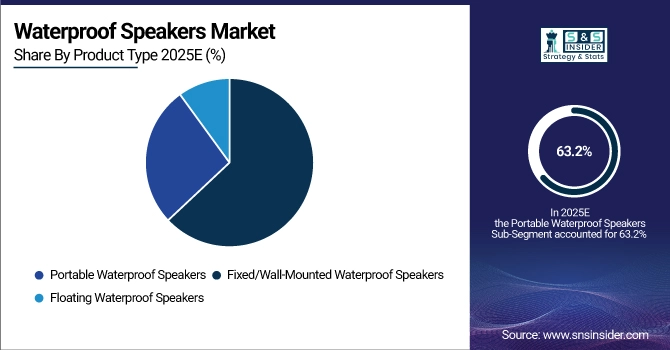
By Product Type, Portable Waterproof Speakers Dominate Market with 63.2% Share in 2025, Portable Segment to Record Fastest Growth from 2026 to 2035
Portable waterproof speakers accounted for 63.2% of the market in 2025, driven by consumer preference for compact, lightweight, and easy-to-carry devices suitable for camping, hiking, beach outings, and poolside use. Integration of Bluetooth connectivity, long battery life, and durable IP-rated designs further supports their popularity.
The portable segment is expected to grow at the fastest CAGR from 2026 to 2035. Rising trends in travel, outdoor recreation, and adventure activities, particularly among younger demographics, continue to fuel demand for portable waterproof speakers worldwide.
By Ingress Protection (IP) Rating, IPX7–IPX8 Segment Dominates Waterproof Speakers Market with 56.5% Share in 2025, Fully Waterproof Speakers to Record Fastest Growth with CAGR from 2026 to 2033
The IPX7–IPX8 segment held a dominant share of 56.5% in 2025. These fully waterproof speakers are designed to withstand complete immersion in water, making them ideal for swimming, boating, and water sports. Their durability and reliability under extreme conditions appeal to adventure enthusiasts and outdoor users. The rising demand for rugged, high-performance audio devices continues to drive the adoption of fully waterproof speaker models globally.
The fully waterproof speaker segment is expected to experience the fastest growth in the market from 2026 to 2033. Increasing recreational activities, outdoor adventures, and consumer preference for durable and portable devices are key factors supporting this growth. Innovations in waterproof materials and enhanced acoustic performance are also boosting market expansion.
By Connectivity, Bluetooth Segment Dominates Market with 67.8% Share in 2025, Bluetooth Connectivity to Record Fastest Growth from 2026 to 2035
Bluetooth-enabled speakers held a dominant share of 67.8% in 2025. The widespread adoption of smartphones, tablets, and other Bluetooth devices enables seamless wireless audio streaming. Consumers favor Bluetooth speakers for portability, cable-free convenience, and easy pairing with multiple devices.
The Bluetooth segment is projected to register the fastest growth during 2026–2035. Increasing demand for smart, travel-friendly, and compact audio solutions across both developed and emerging markets is driving adoption.
By End User, Residential / Personal Use Dominates Market with 61.7% Share in 2025, Commercial Use Segment to Record Fastest Growth from 2026 to 2035
Residential and personal use accounted for 61.7% of the market in 2025, driven by the popularity of outdoor leisure activities such as backyard gatherings, camping, hiking, and beach outings. Consumers are increasingly opting for portable, durable, and smartphone-compatible waterproof speakers for daily recreational and travel use.
The commercial use segment, including hotels, resorts, gyms, and pools, is expected to witness the fastest growth from 2026 to 2035. Rising investments in enhancing guest experiences and entertainment infrastructure, coupled with the adoption of waterproof audio systems in wet or high-moisture environments, are fueling market expansion.
Waterproof Speakers Market Regional Insights:
North America Dominates Waterproof Speakers Market in 2025
In 2025, North America held a 32.5% share of the global waterproof speakers market, driven by high consumer spending on outdoor recreation, adoption of advanced wireless technologies, and strong brand presence. The region benefits from a tech-savvy population, growing demand for rugged and portable audio solutions, and widespread usage of Bluetooth-enabled devices. Increasing popularity of water-based tourism, fitness activities, and smart home ecosystems further supports product demand across residential and commercial sectors.
The United States dominates the North American market due to high participation in outdoor activities, continuous innovation, and widespread adoption of consumer technologies. Strong retail infrastructure and growing e-commerce penetration further enhance market accessibility.

Get Customized Report as per Your Business Requirement - Enquiry Now
Asia-Pacific to Grow at the Fastest CAGR of 8.91% from 2026 to 2033
Asia-Pacific is projected to register the fastest growth in the waterproof speaker’s market from 2026 to 2035. Rising disposable incomes, urbanization, and increasing participation in outdoor and recreational activities are major growth drivers. Expanding e-commerce platforms, rising smartphone penetration, and youth-driven demand for portable, wireless entertainment continue to fuel market expansion. Manufacturers are investing heavily in product innovations tailored to regional preferences.
China leads the Asia-Pacific market, supported by large-scale manufacturing capabilities, a growing middle-class population, and strong demand for affordable yet feature-rich waterproof speakers. India and Southeast Asia are also emerging as key growth markets due to rapid tech adoption and rising outdoor lifestyle trends.
Europe Waterproof Speakers Market Insights, 2025
Europe accounts for a significant portion of the market, driven by outdoor leisure activities, high adoption of smart and portable consumer electronics, and rising environmental awareness. Western and Northern European countries show strong demand for durable, energy-efficient, and stylish audio devices suitable for camping, hiking, and waterfront recreation. Premium audio brands, robust retail networks, and increasing interest in wireless connectivity contribute to steady growth. Tourism and hospitality sectors are increasingly integrating waterproof audio systems to enhance guest experiences.
Latin America and Middle East & Africa Emerging Markets in Waterproof Speakers Industry
Latin America and Middle East & Africa are emerging markets in the waterproof speakers industry, fueled by rising urbanization, growing smartphone penetration, and expanding outdoor recreational trends. In Latin America, Brazil and Mexico lead market growth with increasing demand for affordable, wireless, and rugged audio devices. The Middle East & Africa benefit from growing tourism, including beach resorts and desert safaris, which drive demand for durable, weather-resistant speakers. Expanding e-commerce platforms and improving distribution networks further enhance market penetration in both regions
Waterproof Speakers Market key Players:
-
Bose Corporation
-
JBL (Harman International Industries, Inc.)
-
Sony Corporation
-
Ultimate Ears (Logitech International S.A.)
-
Anker Innovations (Soundcore)
-
Altec Lansing
-
Bang & Olufsen
-
Philips (Koninklijke Philips N.V.)
-
Fugoo
-
Braven (ZAGG Inc.)
-
Tribit Audio
-
Skullcandy, Inc.
-
Samsung Electronics Co., Ltd.
-
LG Electronics Inc.
-
Denon (Sound United LLC)
-
Marshall (Zound Industries)
-
House of Marley (The House of Marley, LLC)
-
Creative Technology Ltd.
-
Sennheiser Electronic GmbH & Co. KG
-
Polk Audio (DEI Holdings, Inc.)
Competitive Landscape for the Waterproof Speakers Market:
Bose Corporation
Bose Corporation is a U.S.-based leader in premium audio solutions, specializing in home audio, portable, and waterproof speakers. With decades of experience, the company designs, engineers, and manufactures high-quality acoustic devices featuring rugged and waterproof designs, Bluetooth connectivity, and superior sound performance. Bose operates globally through direct-to-consumer channels, retail partners, and online platforms. Its role in the waterproof speakers market is vital, as it provides durable, high-performance audio solutions for both personal and commercial use, appealing to consumers seeking reliable, feature-rich devices.
-
In 2025, Bose expanded its portable waterproof speaker lineup with the SoundLink Flex and SoundLink Micro series, offering IPX7-rated designs, enhanced battery life, and 360° sound technology.
JBL (Harman International Industries, Inc.)
JBL, a subsidiary of Harman International Industries, Inc., is a U.S.-based global leader in consumer and professional audio equipment, known for its rugged, waterproof Bluetooth speakers. The company specializes in portable audio solutions with IPX7 or higher ratings, long battery life, and superior bass performance. JBL operates through extensive retail channels, e-commerce platforms, and partnerships with lifestyle and technology brands. Its role in the waterproof speakers market is critical, offering devices suitable for outdoor, recreational, and water-based activities worldwide.
-
In 2025, JBL launched updated models in the Charge and Flip series, featuring fully waterproof IPX7 ratings, durable housing for outdoor use, and smart voice assistant integration.
Sony Corporation
Sony Corporation is a Japanese multinational electronics company, offering a wide range of audio solutions, including waterproof and wireless speakers. With a strong focus on innovation and high-quality sound, Sony develops compact, IPX5–IPX7-rated waterproof speakers that integrate seamlessly with mobile devices and smart home ecosystems. Sony operates globally through direct retail stores, online channels, and authorized distributors. Its role in the waterproof speakers market is significant, providing reliable and versatile audio solutions for both indoor and outdoor environments.
-
In 2025, Sony refreshed its SRS-XB and XB-L series waterproof speakers, featuring enhanced bass, extended battery life, and full submersion protection for outdoor and water-based activities.
Ultimate Ears (Logitech International S.A.)
Ultimate Ears (UE), part of Logitech International S.A., is a U.S.-based specialist in portable, waterproof, and rugged Bluetooth speakers. The company designs devices with IP67 or higher ratings, 360° sound, long-lasting batteries, and durable casings for outdoor and extreme use. UE distributes its products globally via e-commerce, retail stores, and strategic partnerships with technology and lifestyle brands. Its role in the waterproof speakers market is crucial, targeting adventure enthusiasts and outdoor users who demand highly durable, high-performance audio solutions.
-
In 2025, Ultimate Ears introduced new Boom 3 and Wonderboom 3 models, emphasizing fully waterproof designs, shock resistance, and multi-device connectivity for travel, outdoor, and recreational applications.
| Report Attributes | Details |
|---|---|
| Market Size in 2025 | USD 10.34 Billion |
| Market Size by 2035 | USD 22.51 Billion |
| CAGR | CAGR of 8.09% From 2026 to 2035 |
| Base Year | 2025 |
| Forecast Period | 2026-2035 |
| Historical Data | 2022-2024 |
| Report Scope & Coverage | Market Size, Segments Analysis, Competitive Landscape, Regional Analysis, DROC & SWOT Analysis, Forecast Outlook |
| Key Segments | • By Product Type (Portable Waterproof Speakers, Fixed/Wall-Mounted Waterproof Speakers, and Floating Waterproof Speakers) • By Ingress Protection (IP) Rating (IPX4–IPX6 (Splash-resistant), and IPX7–IPX8 (Fully waterproof/submersible)) • By Connectivity (Bluetooth, Wi-Fi, and Wired (Aux/USB)) • By End User (Residential / Personal Use, Commercial Use (Hotels, Resorts, Gyms, Pools), and Marine & Outdoor Recreation (Boating, Camping, Hiking)) |
| Regional Analysis/Coverage | North America (US, Canada), Europe (Germany, France, UK, Italy, Spain, Poland, Turkey, Rest of Europe), Asia Pacific (China, India, Japan, South Korea, Singapore, Australia, Taiwan, Rest of Asia Pacific), Middle East & Africa (UAE, Saudi Arabia, Qatar, South Africa, Rest of Middle East & Africa), Latin America (Brazil, Argentina, Rest of Latin America) |
| Company Profiles |
Bose Corporation, JBL (Harman International Industries, Inc.), Sony Corporation, Ultimate Ears (Logitech International S.A.), Anker Innovations (Soundcore), Altec Lansing, Bang & Olufsen, Philips (Koninklijke Philips N.V.), Fugoo, Braven (ZAGG Inc.), Tribit Audio, Skullcandy, Inc., Samsung Electronics Co., Ltd., LG Electronics Inc., Denon (Sound United LLC), Marshall (Zound Industries), House of Marley (The House of Marley, LLC), Creative Technology Ltd., Sennheiser Electronic GmbH & Co. KG, Polk Audio (DEI Holdings, Inc.) |
Frequently Asked Questions
Ans: North America dominated the Waterproof Speakers Market in 2025.
Ans: Bluetooth segment dominated the Waterproof Speakers Market.
Ans: Rising demand for portable, durable audio devices for outdoor and recreational activities is the major growth factor driving the waterproof speaker’s market.
Ans: The Waterproof Speakers Market size was valued at USD 10.34 billion in 2025E and is expected to reach USD 22.51 billion by 2035, growing at a CAGR of 8.09% over the forecast period of 2026-2035.
Ans: The Waterproof Speakers Market is expected to grow at a CAGR of 8.09% from 2026-2035.
Get in Touch
