Web Application Firewall Market Report Scope & Overview:
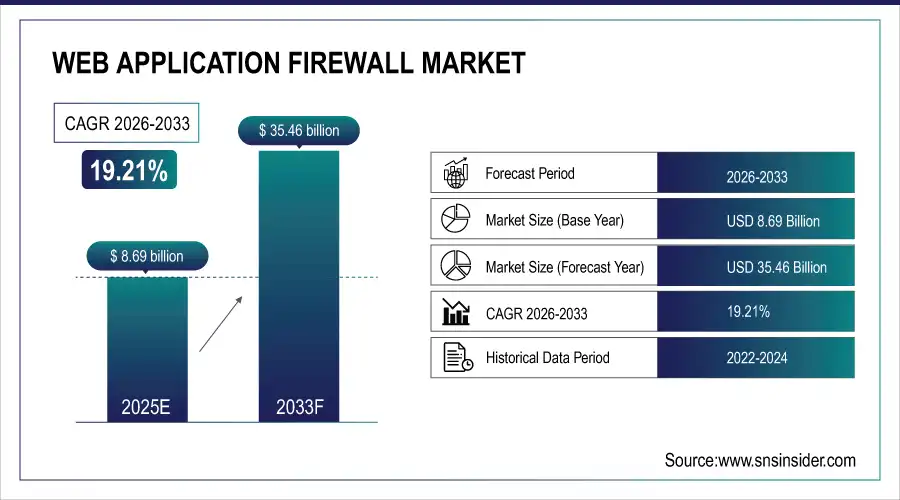
The Web Application Firewall Market was valued at USD 8.69 billion in 2025E and is expected to reach USD 35.46 billion by 2033, growing at a CAGR of 19.21% from 2026-2033.
The Web Application Firewall (WAF) Market is growing due to the rising frequency of cyberattacks, increasing adoption of cloud-based applications, and the need for robust web security. Growing regulatory compliance requirements, digital transformation across industries, and expansion of e-commerce and online services are driving adoption. Additionally, demand for real-time threat detection, automated security solutions, and integration with advanced AI and machine learning technologies is further fueling market growth.
Web Application Firewall Market Size and Forecast
-
Market Size in 2025E: USD 8.69 Billion
-
Market Size by 2033: USD 35.46 Billion
-
CAGR: 19.21% from 2026 to 2033
-
Base Year: 2025E
-
Forecast Period: 2026–2033
-
Historical Data: 2022–2024
To Get more information On Web Application Firewall Market - Request Free Sample Report
Web Application Firewall Market Trends
-
Rising cyber threats and increasing data breaches are driving the web application firewall (WAF) market.
-
Growing adoption of cloud-based and hybrid deployment models is boosting market growth.
-
Expansion of e-commerce, BFSI, and healthcare sectors is fueling demand for robust application security.
-
Integration with AI, machine learning, and advanced threat intelligence is enhancing real-time protection and monitoring.
-
Increasing regulatory compliance requirements, including GDPR and PCI DSS, are shaping adoption trends.
-
Advancements in automated threat detection, bot mitigation, and API security are improving solution effectiveness.
-
Collaborations between cybersecurity vendors, cloud providers, and enterprises are accelerating innovation and global market deployment.
Web Application Firewall Market Growth Drivers:
-
As organizations increasingly digitize their operations, securing web applications with WAFs becomes essential to safeguarding critical digital assets.
With the growing trend of digital transformation, web application security has become one of the most important priorities for businesses. With all operations like e-commerce, cloud services, and digital banking now online, organizations are vulnerable to the full spectrum of possible cyber threats. Web Application Firewalls protect these applications by monitoring and filtering all HTTP traffic between a web application and the Internet. WAFs are particularly intended to identify and impede common threats like SQL injections, cross-site scripting, and Distributed Denial of Service, which are some of the most effective attacks on web applications.
Web Application Firewall Market Restraints:
-
WAFs can introduce latency and performance issues, especially if not properly configured or if handling high traffic volumes.
Web Application Firewalls play a critical role in protecting web applications from cyber threats, however, sometimes they can introduce latency and performance issues (particularly when configured incorrectly or when dealing with high traffic volumes). To recognize and prevent malicious activities, WAF operates by filtering and inspecting incoming HTTP traffic. This is important from the perspective of security, but the overhead of having it in place can hinder response times, and continue to degrade the performance of the web application. If a WAF is not properly configured, it may delay when processing requests especially if it has to perform a deep inspection of data. It can result in increased page load times, reduced user experience, and ultimately lead to decreased website traffic, loss of customers as well as revenue for the business.
Web Application Firewall Market Segment Analysis
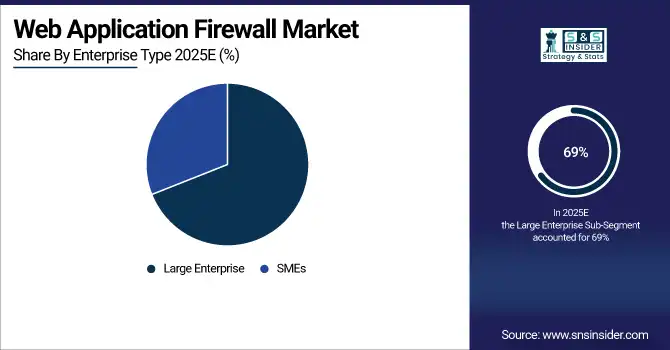
By Enterprise Type, Large Enterprises dominated the Web Application Firewall Market, while SMEs are expected to register the fastest CAGR
The Large Enterprise segment dominated the Web Application Firewall Market with over 69% market share as organizations with a large number of web applications require comprehensive and efficient security solutions. Being prime targets for cyberattacks, large enterprises also manage large volumes of sensitive data. Consequently, they are acquiring state-of-the-art security technologies like WAFs to secure their digital assets. Large enterprises are likely to continue the adoption of WAF solutions due to the growing trends of digital transformation and the use of cloud-based infrastructures.
The SME segment is anticipated to exhibit the fastest CAGR throughout the forecast period. With the rise in sophistication of cyber threats, SMEs need to create cost-effective as well as efficient security solutions. Now with greater usage of cloud services and increasing digital business models, WAFs are becoming popular with SMEs to protect online web apps. This will drive the market in such segments as WAF solutions are increasingly available at lower prices and scalable solutions.
By Type, Cloud-based WAF led the market, with Host-Based WAF projected to grow at the fastest CAGR
Cloud-based WAF segment dominated the market and represented a revenue share of more than 47% in 2023, as there is a shift of businesses toward cloud infrastructures. For most organizations, cloud-based WAF provides an easily scalable, powerful, flexible, and easy-to-setup solution that eliminates the high-cost on-premise hardware investment needed to secure web apps. The growth of cloud-native applications and the need for managed security services are also beneficial to the cloud segment.
The host-based WAF segment is expected to record the fastest CAGR during the forecast period They are specifically applicative tier and usually work at the application level, deployed directly on the web server. A Hybrid IT environment is another key to notice for increasing adoption of hybrid IT where on-premises and cloud-based applications co-exist is further projected to boost the demand for host-based WAF solutions. The necessity of unifying security strategies across cloud and on-premise environments is likely to drive rapid growth over the host-based WAF market. Reduce your cloud-security risk with cloud-native security—secure applications with a Host-Based WAF building block, if used.
Regional Analysis
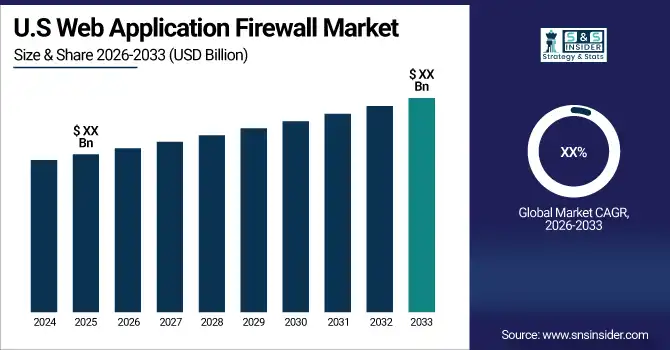
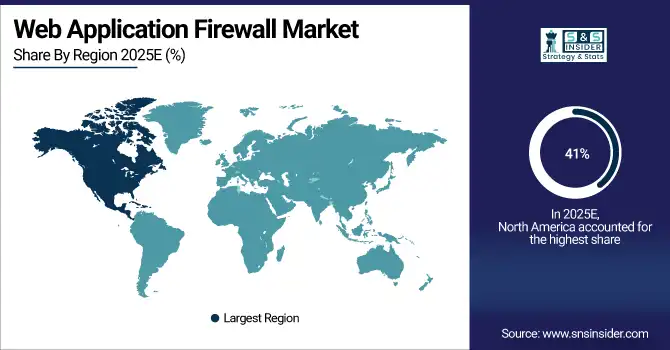
North America Web Application Firewall Market Insights
North America dominated the Web Application Firewall Market and accounted for a revenue share of more than 41% in 2023, due to the presence of leading cybersecurity companies, such as Akamai Technologies, F5 Networks, and Cloudflare, in the region. The increasing frequency of cyberattacks targeting businesses and the growing adoption of cloud-based solutions are driving the demand for WAF solutions. Additionally, stringent data protection regulations, such as GDPR and CCPA, are encouraging businesses to implement robust security measures, further boosting the market growth in North America.
Get Customized Report as per Your Business Requirement - Enquiry Now
Asia Pacific Web Application Firewall Market Insights
The Asia-Pacific region is projected to register the fastest CAGR during the forecast period. The rapid digital transformation across countries like China, India, and Japan is driving the demand for cybersecurity solutions, including WAFs. As businesses in the region increasingly adopt cloud computing and e-commerce platforms, the need for advanced security solutions to protect web applications is growing. Additionally, the rise in cyberattacks targeting enterprises in Asia-Pacific is prompting organizations to invest in WAF solutions to safeguard their online presence.
Europe Web Application Firewall Market Insights
Europe’s Web Application Firewall Market is expanding due to increasing cyber threats, strict data protection regulations such as GDPR, and rapid adoption of cloud-based and digital applications. Enterprises are investing in advanced WAF solutions to protect web applications, APIs, and online services. Growing e-commerce activity, digital banking, and remote work trends are further boosting demand. Additionally, rising awareness of application security and integration of AI-driven threat detection are supporting market growth across the region.
Middle East & Africa and Latin America Web Application Firewall Market Insights
The Middle East & Africa Web Application Firewall Market is growing due to increasing digitalization, rising cyber threats, and expanding adoption of cloud services across enterprises and government sectors. In Latin America, market growth is driven by rapid e-commerce expansion, digital banking adoption, and improving cybersecurity regulations. Organizations in both regions are investing in WAF solutions to protect web applications, ensure data security, and maintain regulatory compliance, supporting steady market expansion.
Web Application Firewall Market Competitive Landscape:
Cloudflare, Inc.
Cloudflare is a cloud-native connectivity and security company delivering integrated web performance, application security, and zero-trust networking solutions. Its WAF platform emphasizes innovation, real-time threat intelligence, and analytics-driven protection for web applications and APIs. Cloudflare serves businesses of all sizes across industries, leveraging its global network to mitigate cyber threats, enhance visibility into attack patterns, and improve overall application resilience and performance.
-
2024: Cloudflare released its Application Security Report 2024 Update, detailing evolving application attack trends and WAF mitigation insights.
-
2023: Cloudflare introduced WAF Attack Score Lite and enhanced Security Analytics to detect emerging threats and improve attack visibility for business customers.
Key Players
Some of the Web Application Firewall Market Companies
-
Akamai Technologies, Inc.
-
Imperva, Inc.
-
Cloudflare, Inc.
-
F5, Inc.
-
Fortinet, Inc.
-
Radware Ltd.
-
Barracuda Networks, Inc.
-
Palo Alto Networks, Inc.
-
Citrix Systems, Inc.
-
Amazon Web Services (AWS)
-
Microsoft Corporation
-
Google LLC
-
Check Point Software Technologies Ltd.
-
Qualys, Inc.
-
Sophos Ltd.
-
Trustwave Holdings, Inc.
-
Rohde & Schwarz Cybersecurity GmbH
-
Penta Security Systems
-
Fastly, Inc.
-
Prophaze
|
Report Attributes |
Details |
|
Market Size in 2025 |
USD 8.69 Billion |
|
Market Size by 2033 |
USD 35.46 Billion |
|
CAGR |
CAGR of 19.21% From 2026 to 2033 |
|
Base Year |
2025 |
|
Forecast Period |
2026-2033 |
|
Historical Data |
2022-2024 |
|
Report Scope & Coverage |
Market Size, Segments Analysis, Competitive Landscape, Regional Analysis, DROC & SWOT Analysis, Forecast Outlook |
|
Key Segments |
• By Type (Network, Host, Cloud) |
|
Regional Analysis/Coverage |
North America (US, Canada, Mexico), Europe (Eastern Europe [Poland, Romania, Hungary, Turkey, Rest of Eastern Europe] Western Europe] Germany, France, UK, Italy, Spain, Netherlands, Switzerland, Austria, Rest of Western Europe]), Asia Pacific (China, India, Japan, South Korea, Vietnam, Singapore, Australia, Rest of Asia Pacific), Middle East & Africa (Middle East [UAE, Egypt, Saudi Arabia, Qatar, Rest of Middle East], Africa [Nigeria, South Africa, Rest of Africa], Latin America (Brazil, Argentina, Colombia, Rest of Latin America) |
|
Company Profiles |
Akamai Technologies, Inc., Imperva, Inc., Cloudflare, Inc., F5, Inc., Fortinet, Inc., Radware Ltd., Barracuda Networks, Inc., Palo Alto Networks, Inc., Citrix Systems, Inc., Amazon Web Services (AWS), Microsoft Corporation, Google LLC, Check Point Software Technologies Ltd., Qualys, Inc., Sophos Ltd., Trustwave Holdings, Inc., Rohde & Schwarz Cybersecurity GmbH, Penta Security Systems, Fastly, Inc., Prophaze |
Frequently Asked Questions
North America dominated the Web Application Firewall Market, supported by leading cybersecurity vendors, strong cloud adoption, and rising enterprise security investments.
Large enterprises dominated the Web Application Firewall Market due to higher cybersecurity investments and complex digital infrastructures requiring advanced protection.
Rising cyberattacks, increasing cloud application usage, and the need for real-time application security are the major growth drivers.
In 2025, the Web Application Firewall Market was valued at USD 8.69 billion, reflecting increased adoption of advanced web security solutions.
The Web Application Firewall Market is expected to grow at a strong CAGR of 19.21% from 2026 to 2033, driven by rising cybersecurity concerns.
Get in Touch
