Active Electronic Components Market Report Scope & Overview:
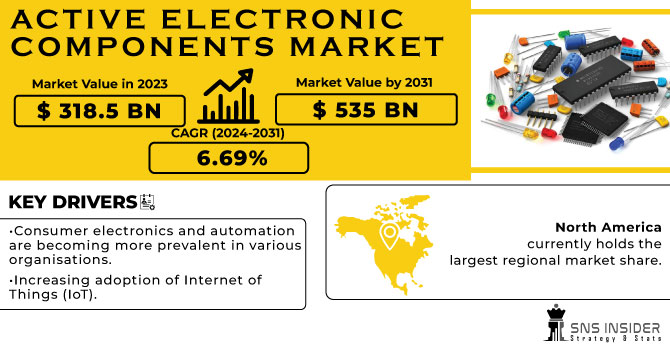
Active Electronic Components Market was valued at USD 323.50 billion in 2023 and is expected to reach USD 635.52 billion by 2032, growing at a CAGR of 7.81% from 2024-2032. This report includes an in-depth analysis of supply chain insights, investment and funding trends, regulatory and standards impact, and technology trends shaping the market. It examines product segments, including semiconductors, diodes, and ICs, and highlights end-user industries such as automotive, healthcare, and telecommunications. The report also addresses future demand forecasts, market share distribution, and the influence of emerging technologies like 5G and IoT on the market's growth trajectory.
Get more information on Active Electronic Components Market - Request Sample Report
Market Dynamics
Drivers
-
Rising Demand for Smartphones, Laptops, and Wearables Boosts Growth in Active Electronic Components Market
The fast growth of consumer electronics, especially smartphones, laptops, wearables, and smart home devices, is hugely influencing the active electronic components market. These products need high-level semiconductors, transistors, capacitors, and integrated circuit to enable their constantly increasing performance and functionality requirements. As customers increasingly embrace new technologies and require faster processing, greater energy efficiency, and more features, producers are emphasizing the creation of more powerful and smaller active components. This ongoing need for high-performance electronics in numerous industries, such as personal entertainment, healthcare, and communication, is driving innovation and leading to the mass use of active electronic components, and thus it is a primary driver of market growth.
Restraints
-
High Manufacturing Costs of Active Electronic Components Limit Market Growth and Affordability for Companies
The complicated manufacturing processes required to produce active electronic components, including semiconductors, capacitors, and integrated circuits, necessitate advanced technology and skilled personnel. This contributes to high manufacturing costs, which are likely to limit the ability of many companies, especially small firms, to effectively compete in the market. Moreover, the requirement for superior materials and sophisticated equipment also increases costs. Consequently, production costs can restrict affordability, particularly for companies that conduct business in price-sensitive markets. This issue can slow down market growth overall by limiting access to these critical components, causing production delays and decreased profitability for manufacturers.
Opportunities
-
5G Network Expansion Drives Increased Demand for Active Electronic Components in Communication, Mobile Devices, and IoT
The continued growth of 5G technology is fueling tremendous demand for active electronic components, particularly in communications infrastructure, mobile, and IoT. With 5G networks providing higher speeds, lower latency, and more connectivity, there is a demand for more sophisticated semiconductors, processors, and integrated circuits to enable these advancements. Mobile phones and wearables need high-performance active components to maximize 5G capabilities, and the IoT ecosystem, fueled by smart homes and industrial use cases, also relies on these components for increased connectivity and data processing. With the acceleration of 5G adoption worldwide, the demand for active electronic components will increase, offering long-term opportunities for manufacturers across industries, ranging from telecommunications to consumer electronics.
Challenges
-
Supply Chain Instability and Semiconductor Shortages Disrupt Production and Affect Stability in the Active Electronic Components Market
Disruptions in the global supply chain, particularly shortages of critical components like semiconductors, can severely impact the production of active electronic components. These shortages, often caused by factors such as geopolitical tensions, natural disasters, or logistical challenges, lead to delays in manufacturing and fulfillment of orders. As the demand for advanced electronics rises, the strain on the supply chain intensifies, resulting in longer lead times, increased costs, and reduced product availability. This instability can create uncertainty in the market, affecting not only manufacturers but also end-users who depend on a steady supply of components. As such, supply chain disruptions remain a significant challenge for companies striving to maintain operational efficiency and meet growing consumer and industry demand.
Segment Analysis
By Product Type
The Semiconductor Devices segment led the Active Electronic Components Market with the largest revenue share of approximately 50% in 2023 because they are extensively used across multiple industries. Semiconductors play a crucial role in electronic products such as smartphones, computers, and car systems, which are still in high demand. The increasing requirement for processing capability, energy efficiency, and small form factors in these products has made semiconductors the central technology fueling the market.
The Display Devices segment is anticipated to register the fastest CAGR of approximately 9.12% during 2024-2032 on account of the rising use of advanced display technology in consumer electronics, auto systems, and smart devices. With growing demand for quality screens for mobile phones, television sets, and wearables, the trend towards OLED, QLED, and flexible displays is driving growth. Moreover, the growing applications of display technology in AR/VR and smart home products also increase its growth prospect.
By End-use
The Consumer Electronics business led the Active Electronic Components Market with the largest revenue percentage share of around 29% in 2023 as a result of sustained demand growth for smartphones, laptops, wearables, and other personal devices. Growing consumer demand for high-end, high-performance electronics with enhanced processing power, energy efficiency, and connectivity leads to the demand for active electronic components such as semiconductors, capacitors, and microchips, making the largest contribution to the market dominance.
The Automotive segment will have the fastest growth rate of around 9.64% during 2024-2032 based on increasing the use of electric vehicles and autonomous vehicle technologies. Advanced active electronic components play a vital role in EVs' battery management systems, power electronics, and in-vehicle communication systems. In addition, increased emphasis on vehicle safety, automation, and infotainment systems is influencing demand for advanced electronic components used in advanced automobiles, which is fueling the fast growth of the market.
Regional Analysis
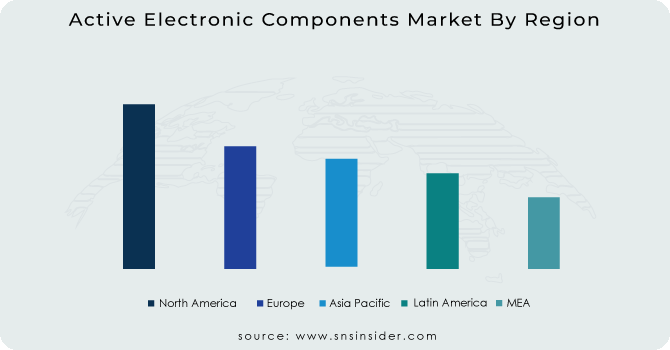
The Asia Pacific segment dominated the Active Electronic Components Market with the highest revenue share of about 40% in 2023 due to the region's strong manufacturing base and high demand for electronic products. Countries like China, Japan, and South Korea are major hubs for electronics production and export. Additionally, the rapid adoption of consumer electronics, automotive innovations, and industrial automation in the region further drives the demand for active electronic components, cementing Asia Pacific's dominance.
The North America segment is expected to grow at the fastest CAGR of about 9.35% from 2024-2032 due to the increasing focus on technological advancements, particularly in sectors like automotive, healthcare, and consumer electronics. The region is also a leader in the development of 5G, AI, and IoT technologies, which require high-performance active electronic components. Furthermore, the growing shift toward electric vehicles and renewable energy systems boosts demand for these components in North America.
Need any customization research on Active Electronic Components Market - Enquiry Now
Key Players
-
Infineon Technologies AG (Power Semiconductors, Microcontrollers)
-
Advanced Micro Devices, Inc. (Processors, Graphics Cards)
-
STMicroelectronics N.V. (Microcontrollers, Power MOSFETs)
-
Microchip Technology, Inc. (Microcontrollers, Analog-to-Digital Converters)
-
Analog Devices, Inc. (Operational Amplifiers, Voltage Regulators)
-
Broadcom Inc. (Network Interface Controllers, Wireless Chipsets)
-
NXP Semiconductors N.V. (Microcontrollers, RF Amplifiers)
-
Intel Corporation (Processors, Memory Modules)
-
Monolithic Power Systems, Inc. (Power Management ICs, LED Drivers)
-
Texas Instruments Incorporated (Voltage Regulators, Op-Amps)
-
Qualcomm Inc. (Processors, Modem Chips)
-
Renesas Electronics Corporation (Microcontrollers, Analog ICs)
-
Semiconductor Components Industries, LLC (Rectifiers, Transistors)
-
Toshiba Corporation (Power Semiconductors, Microcontrollers)
-
Hitachi AIC Inc. (Power Supplies, Inverters)
-
Panasonic Corporation (Capacitors, Semiconductor Devices)
-
Everlight Electronics Co., Ltd. (LED Modules, Opto Semiconductors)
-
Vishay Intertechnology, Inc. (Resistors, Capacitors)
-
Diotec Semiconductor AG (Rectifiers, Zener Diodes)
-
ON Semiconductor (Voltage Regulators, Power MOSFETs)
-
Maxim Integrated Products Inc. (Voltage Regulators, Data Converters)
-
Fairchild Semiconductor International, Inc. (Power MOSFETs, Diodes)
Recent Developments:
-
In November 2024, Infineon introduced the AURIX TC4Dx, a high-performance microcontroller designed for automotive applications, featuring advanced multi-core architecture and enhanced cybersecurity features
-
In October 2024, Qualcomm unveiled its AI innovations for mobile and automotive applications at the Snapdragon Summit, showcasing its leadership in on-device AI and introducing new models and collaborations
-
In February 2024, Texas Instruments introduced two new power conversion device portfolios that push the limits of power design, offering industry-leading power density with enhanced efficiency and a 40% reduction in solution size.
| Report Attributes | Details |
| Market Size in 2023 | USD 323.50 Billion |
| Market Size by 2032 | USD 635.52 Billion |
| CAGR | CAGR of 7.81% From 2024 to 2032 |
| Base Year | 2023 |
| Forecast Period | 2024-2032 |
| Historical Data | 2020-2022 |
| Report Scope & Coverage | Market Size, Segments Analysis, Competitive Landscape, Regional Analysis, DROC & SWOT Analysis, Forecast Outlook |
| Key Segments | • By Product Type (Semiconductor Devices, Vacuum Tube, Display Devices, Others) • By End-use (Consumer Electronics, Networking & Telecommunication, Automotive, Manufacturing, Aerospace & Defense, Healthcare, Others) |
| Regional Analysis/Coverage | North America (US, Canada, Mexico), Europe (Eastern Europe [Poland, Romania, Hungary, Turkey, Rest of Eastern Europe] Western Europe] Germany, France, UK, Italy, Spain, Netherlands, Switzerland, Austria, Rest of Western Europe]), Asia Pacific (China, India, Japan, South Korea, Vietnam, Singapore, Australia, Rest of Asia Pacific), Middle East & Africa (Middle East [UAE, Egypt, Saudi Arabia, Qatar, Rest of Middle East], Africa [Nigeria, South Africa, Rest of Africa], Latin America (Brazil, Argentina, Colombia, Rest of Latin America) |
| Company Profiles | Infineon Technologies AG, Advanced Micro Devices, Inc., STMicroelectronics N.V., Microchip Technology, Inc., Analog Devices, Inc., Broadcom Inc., NXP Semiconductors N.V., Intel Corporation, Monolithic Power Systems, Inc., Texas Instruments Incorporated, Qualcomm Inc., Renesas Electronics Corporation, Semiconductor Components Industries, LLC, Toshiba Corporation, Hitachi AIC Inc., Panasonic Corporation, Everlight Electronics Co., Ltd., Vishay Intertechnology, Inc., Diotec Semiconductor AG, ON Semiconductor, Maxim Integrated Products Inc., Fairchild Semiconductor International, Inc. |
Frequently Asked Questions
ANS: The rising demand for smartphones, laptops, and wearables is a major driver of the market.
ANS: The Asia Pacific region dominated with a revenue share of about 40% in 2023.
ANS: The Consumer Electronics segment dominated with a revenue share of about 29% in 2023.
ANS: The Semiconductor Devices segment dominated with a revenue share of about 50% in 2023.
ANS: Active Electronic Components Market was valued at USD 323.50 billion in 2023 and is expected to reach USD 635.52 billion by 2032, growing at a CAGR of 7.81% from 2024-2032.
Get in Touch
