Aloe Vera Market Report Scope & Overview:

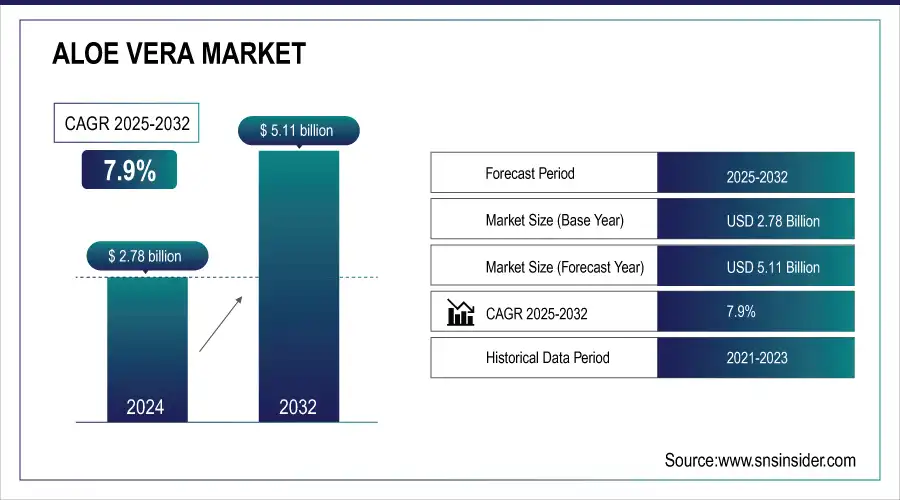
The Aloe Vera Market size was USD 2.78 billion in 2024 and is expected to Reach USD 5.11 billion by 2032 and grow at a CAGR of 7.9% over the forecast period of 2025-2032.

Aloe Vera is available in a variety of forms, including liquid gels, capsules, powder, gels, and others. Aloe vera has been used to treat a variety of skin, hair, and diabetic conditions. Unprocessed aloe vera extract, in particular, is widely utilized in healthcare, cosmetics, and other applications. Organic aloe vera products are becoming more popular among consumers.

Aloe Vera Market Revenue Analysis

Aloe vera is classified into three application sectors food and beverages, pharmaceuticals, and cosmetics. The increased use of aloe vera in aloe-based beverages drives market demand. Cosmetics are expected to rise significantly. The prevalence of several skin illnesses and other associated concerns has increased the demand for cosmetic products.

Most organizations are investing in research and development and introducing innovative products to obtain a competitive advantage and increase their global presence. Currently, one of the significant market trends is the increasing usage of aloe Vera extracts in sugar-free drinks, which is predicted to broaden the product's application reach. Due to growing customer awareness of leading a healthy lifestyle, markets for producers include nations like India, China, and the U.S.

Market Size and Forecast:

  • Market Size in 2024 USD 2.78 Billion

  • Market Size by 2032 USD 5.11 Billion

  • CAGR of 7.9 % From 2025 to 2032

  • Base Year 2024

  • Forecast Period 2025-2032

  • Historical Data 2021-2023

Key Aloe Vera Market Trends:

  • Rising consumer preference for natural and herbal products like aloe vera to support health and wellness.

  • Growing use of aloe vera in managing chronic diseases such as diabetes, heart disease, and cancer.

  • Increasing demand for aloe vera-based personal care and cosmetic products, including lotions, creams, and soaps.

  • Expanding application of aloe vera in skincare due to its moisturizing, soothing, and anti-aging properties.

  • Rising adoption of aloe vera in hair care, sunscreen, and acne treatment products for its hydrating and protective benefits.

Aloe Vera Market Growth Drivers:

  • Rising demand for aloe vera in the healthcare sector

Aloe vera is widely known for its many medicinal properties, which include the capacity to treat wounds, heal burns, and strengthen the immune system. Customers are increasingly looking for natural items like aloe vera to boost their health as they become more health-conscious. Numerous chronic illnesses, including diabetes, heart disease, and cancer, can be naturally treated using aloe vera. The market for aloe vera products will rise as these diseases become more common.

Aloe Vera Market Restraints:

  • Adversely clinical effects of the Aloe vera

Some people, particularly those who are allergic to other members of the lily family, such as tulips and onions, may have skin discomfort from aloe vera. Aloe vera may increase the skin's sensitivity to sunlight, increasing the chance of getting sunburned.

Aloe vera can induce low potassium levels (hypokalemia) in some persons, particularly those who take diuretics or have kidney problems. When used in high quantities, aloe vera can cause diarrhea. Because aloe vera can interfere with blood clotting, those with bleeding issues should use it with caution.

Aloe Vera Market Opportunities:

  • Rising usage in cosmetics and skincare industries

Lotions, creams, and soaps that are used for personal care and cosmetic purposes frequently contain aloe vera as an ingredient. It is perfect for these products because of its calming and hydrating qualities. Aloe vera naturally attracts moisture to the skin since it is a humectant. Due to this, it works well as a moisturizer, which keeps the skin hydrated, as well as an ingredient in sunscreen, anti-aging products, acne treatments, and hair care products.

Aloe Vera Market Segment Analysis:
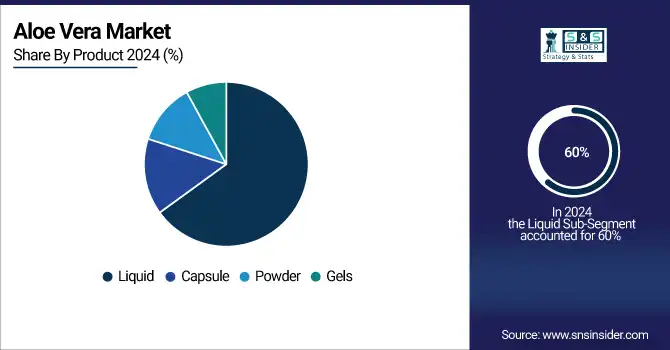
By Product

In 2024, liquid aloe vera products dominated the market with 60%, driven by their widespread use in beverages, cosmetics, and pharmaceutical formulations due to easy consumption and high bioavailability. From 2025 to 2032, the capsule segment is expected to grow at the fastest CAGR, fueled by rising consumer preference for convenient dosage forms, expanding nutraceutical applications, and increasing awareness of aloe vera’s role in boosting immunity and managing chronic health conditions, making it a preferred option among health-conscious consumers globally.

By Distribution Channel

In 2024, the offline distribution channel dominated the aloe vera market, supported by supermarkets, pharmacies, and specialty stores that provide direct product access and trust. From 2025 to 2032, the online channel is projected to witness the fastest CAGR, driven by e-commerce growth, wider product availability, attractive discounts, and the increasing shift of consumers toward digital purchasing platforms offering convenience and doorstep delivery of aloe vera-based products across personal care, health, and wellness categories.

By Application

In 2024, the cosmetic segment dominated the aloe vera market, driven by its extensive use in skincare, haircare, and personal care products due to hydrating and soothing properties. From 2025 to 2032, the pharmaceutical segment is expected to grow at the fastest CAGR, fueled by rising demand for natural remedies in treating chronic illnesses, wound healing, and immunity-boosting solutions.

Aloe Vera Market Segmentation Analysis

Aloe Vera Market Regional Analysis:

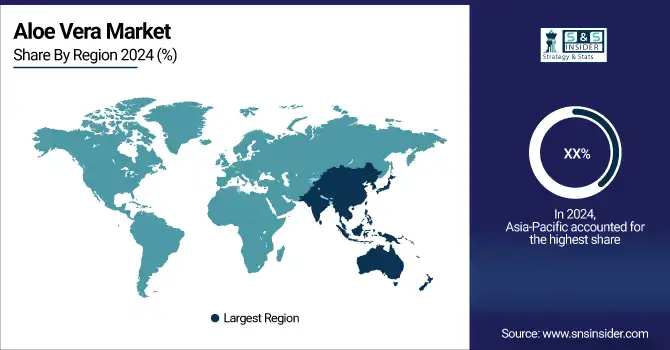
Asia Pacific Aloe Vera Market Insights

Asia-Pacific has taken over the global market for aloe vera extracts. China and India are driving the region's industry due to rising demand in the pharmaceutical and cosmetics industries. Growing population and rising per capita income levels are predicted to drive demand for skincare and cosmetic products. India has the world's fastest-growing cosmetics market. The aloe vera industry is being driven by an expanding number of organic product manufacturers.

North America Aloe Vera Market Insights

North America was the market with the second largest share in the world attributed to rising product usage for the treatment of conditions including cancer, diabetes, gum disease, hair loss, etc, Aloe vera's biggest market in North America is in Mexico, which is followed by the US and Canada.

Europe Aloe Vera Market Insights

Another attractive market is Europe, which is anticipated to rise significantly over the projection period. Consumers in European nations including the U.K., France, and Germany are becoming more interested in nutritional health and supplement products and therapies to improve their health and treatment as well as to prevent sickness. Europe's biggest aloe vera market is in Germany, followed by France and Italy.

Latin America (LATAM) and Middle East & Africa (MEA) Aloe Vera Market Insights

The cosmetic and pharmaceutical sectors are increasing their demand for aloe vera throughout Latin America, the Middle East, and Africa. Latin America's largest aloe vera market is in Brazil, followed by Argentina and Colombia. In the Middle East and Africa, Saudi Arabia has the biggest aloe vera market, followed by Egypt and Morocco.

Aloe Vera Market Key Players:

  • Agromayal Botánica S.A. de C.V.

  • Aloe Farms, Inc.

  • Aloe Laboratories, Inc.

  • Lily of the Desert Organic

  • Pharmachem Laboratories, Inc.

  • Foodchem International Corporation

  • Terry Laboratories, Inc.

  • Aloecorp, Inc.

  • Natural Aloe Costa Rica S.A.

  • Aloe Queen Inc.

  • Herbalife Nutrition Ltd.

  • Forever Living Products

  • Patanjali Ayurved Ltd.

  • Dabur India Ltd.

  • Nature’s Way Products, LLC

  • Amway Corporation

  • NOW Foods

  • Nutralo Group Inc.

  • Fruit of the Earth, Inc.

  • Aloecorp Korea Ltd.


Aloe Farms, Inc-Company Financial Analysis

Competitive Landscape for Aloe Vera Market:

Desert Harvest specializes in aloe vera-based health and wellness products, particularly targeting bladder health and skin care. The company offers highly concentrated, freeze-dried aloe vera supplements known for purity and efficacy. With a focus on natural, therapeutic solutions, Desert Harvest supports consumer demand for safe, science-backed aloe vera applications.

Desert Harvest- In 2023 Desert Harvest, a producer of nutritional supplements containing concentrated aloe vera extract, has collaborated with DopDop Salon master stylist Eddie Wünderlich to develop Wünderlich aloe-infused conditioner and shampoo.

Aloe Vera Market Report Scope:

Report Attributes Details
Market Size in 2024 USD 2.78 Billion
Market Size by 2032 USD 5.11 Billion
CAGR CAGR of 7.9% From 2025 to 2032
Base Year 2024
Forecast Period 2025-2032
Historical Data 2021-2023
Report Scope & Coverage Market Size, Segments Analysis, Competitive  Landscape, Regional Analysis, DROC & SWOT Analysis, Forecast Outlook
Key Segments • By Product (Liquid Gels, Capsule, Powder, Gels, Liquid)
• By Distribution Channel (Offline, Online)
• By Application (Food & Beverages, Pharmaceutical, Cosmetic)
Regional Analysis/Coverage North America (US, Canada), Europe (Germany, UK, France, Italy, Spain, Russia, Poland, Rest of Europe), Asia Pacific (China, India, Japan, South Korea, Australia, ASEAN Countries, Rest of Asia Pacific), Middle East & Africa (UAE, Saudi Arabia, Qatar, South Africa, Rest of Middle East & Africa), Latin America (Brazil, Argentina, Mexico, Colombia, Rest of Latin America).
Company Profiles Agromayal Botánica S.A. de C.V., Aloe Farms, Inc., Aloe Laboratories, Inc., Lily of the Desert Organic, Pharmachem Laboratories, Inc., Foodchem International Corporation, Terry Laboratories, Inc., Aloecorp, Inc., Natural Aloe Costa Rica S.A., Aloe Queen Inc.


Table Of Contents

1. Introduction

1.1 Market Definition & Scope

 1.2 Research Assumptions & Abbreviations

 1.3 Research Methodology

2. Executive Summary

2.1 Market Snapshot

 2.2 Market Absolute $ Opportunity Assessment & Y-o-Y Analysis, 2021–2032

 2.3 Market Size & Forecast, By Segmentation, 2021–2032

  2.3.1 Market Size By Product

  2.3.2 Market Size By Distribution Channel

  2.3.3 Market Size By Application

 2.4 Market Share & Bps Analysis By Region, 2024

 2.5 Industry Growth Scenarios – Conservative, Likely & Optimistic

 2.6 Industry CxO’s Perspective

3. Market Overview

3.1 Market Dynamics

  3.1.1 Drivers

  3.1.2 Restraints

  3.1.3 Opportunities

  3.1.4 Key Market Trends

 3.2 Industry PESTLE Analysis

 3.3 Key Industry Forces (Porter’s) Impacting Market Growth

 3.4 Industry Supply Chain Analysis

  3.4.1 Raw Material Suppliers

  3.4.2 Manufacturers

  3.4.3 Distributors/Suppliers

  3.4.4 Customers/End-Users

 3.5 Industry Life Cycle Assessment

 3.6 Parent Market Overview

 3.7 Market Risk Assessment

4. Statistical Insights & Trends Reporting

4.1 Cultivation & Yield Metrics

4.1.1 Average yield (tons/hectare) of Aloe Vera cultivation by region

4.1.2 Average concentration (%) of active compounds (aloin, polysaccharides, vitamins) across product grades

4.1.3 Year-on-year growth (%) in Aloe Vera farming area (hectares) globally

4.2 Adoption & Application Trends

4.2.1 Share of Aloe Vera consumption by application (cosmetics & personal care, food & beverages, pharmaceuticals, nutraceuticals) (%)

4.2.2 Average per capita Aloe Vera-based product consumption (units/liters) by region

4.2.3 Year-on-year growth (%) in Aloe Vera product launches across FMCG categories

4.3 Product & Processing Metrics

4.3.1 Share of Aloe Vera product formats (gel, juice, powder, capsules, extracts) (%)

4.3.2 Average shelf life (months) of Aloe Vera-based products by type

4.3.3 Percentage of Aloe Vera products marketed as organic/natural-certified

4.4 Sustainability & Trade Benchmarks

4.4.1 Share of Aloe Vera produced through sustainable/organic farming practices (%)

4.4.2 Average export volume (tons) of Aloe Vera products by leading countries

4.4.3 Average price trend (USD/kg) of Aloe Vera raw material vs processed products

5. Aloe Vera Market Segmental Analysis & Forecast, By Product, 2021 – 2032, Value (USD Billion)

5.1 Introduction

 5.2 Liquid

  5.2.1 Key Trends

  5.2.2 Market Size & Forecast, 2021 – 2032

 5.3 Capsule

 5.4 Powder

 5.5 Gels

6. Aloe Vera Market Segmental Analysis & Forecast, By Distribution Channel, 2021 – 2032, Value (USD Billion)

    6.1 Introduction

 6.2 Offline

  6.2.1 Key Trends

  6.2.2 Market Size & Forecast, 2021 – 2032

 6.3 Online

7. Aloe Vera Market Segmental Analysis & Forecast, By Application, 2021 – 2032, Value (USD Billion)

    7.1 Introduction

 7.2 Food & Beverages

  7.2.1 Key Trends

  7.2.2 Market Size & Forecast, 2021 – 2032

 7.3 Pharmaceutical

 7.4 Cosmetic

8. Aloe Vera Market Segmental Analysis & Forecast By Region, 2021 – 2025, Value (USD Billion)

8.1 Introduction

8.2 North America

 8.2.1 Key Trends

 8.2.2 Aloe Vera Market Size & Forecast, By Product, 2021 – 2032

 8.2.3 Aloe Vera Market Size & Forecast, By Distribution Channel, 2021 – 2032

 8.2.4 Aloe Vera Market Size & Forecast, By Application, 2021 – 2032

 8.2.5 Aloe Vera Market Size & Forecast, By Country, 2021 – 2032

  8.2.5.1 USA

   8.2.5.1.1 Aloe Vera Market Size & Forecast, By Product, 2021 – 2032

   8.2.5.1.2 Aloe Vera Market Size & Forecast, By Distribution Channel, 2021 – 2032

   8.2.5.1.3 Aloe Vera Market Size & Forecast, By Application, 2021 – 2032

  8.2.5.2 Canada

   8.2.5.2.1 Aloe Vera Market Size & Forecast, By Product, 2021 – 2032

   8.2.5.2.2 Aloe Vera Market Size & Forecast, By Distribution Channel, 2021 – 2032

   8.2.5.2.3 Aloe Vera Market Size & Forecast, By Application, 2021 – 2032

8.3 Europe

 8.3.1 Key Trends

 8.3.2 Aloe Vera Market Size & Forecast, By Product, 2021 – 2032

 8.3.3 Aloe Vera Market Size & Forecast, By Distribution Channel, 2021 – 2032

 8.3.4 Aloe Vera Market Size & Forecast, By Application, 2021 – 2032

 8.3.5 Aloe Vera Market Size & Forecast, By Country, 2021 – 2032

  8.3.5.1 Germany

   8.3.5.1.1 Aloe Vera Market Size & Forecast, By Product, 2021 – 2032

   8.3.5.1.2 Aloe Vera Market Size & Forecast, By Distribution Channel, 2021 – 2032

   8.3.5.1.3 Aloe Vera Market Size & Forecast, By Application, 2021 – 2032

  8.3.5.2 UK

   8.3.5.2.1 Aloe Vera Market Size & Forecast, By Product, 2021 – 2032

   8.3.5.2.2 Aloe Vera Market Size & Forecast, By Distribution Channel, 2021 – 2032

   8.3.5.2.3 Aloe Vera Market Size & Forecast, By Application, 2021 – 2032

  8.3.5.3 France

   8.3.5.3.1 Aloe Vera Market Size & Forecast, By Product, 2021 – 2032

   8.3.5.3.2 Aloe Vera Market Size & Forecast, By Distribution Channel, 2021 – 2032

   8.3.5.3.3 Aloe Vera Market Size & Forecast, By Application, 2021 – 2032

  8.3.5.4 Italy

   8.3.5.4.1 Aloe Vera Market Size & Forecast, By Product, 2021 – 2032

   8.3.5.4.2 Aloe Vera Market Size & Forecast, By Distribution Channel, 2021 – 2032

   8.3.5.4.3 Aloe Vera Market Size & Forecast, By Application, 2021 – 2032

  8.3.5.5 Spain

   8.3.5.5.1 Aloe Vera Market Size & Forecast, By Product, 2021 – 2032

   8.3.5.5.2 Aloe Vera Market Size & Forecast, By Distribution Channel, 2021 – 2032

   8.3.5.5.3 Aloe Vera Market Size & Forecast, By Application, 2021 – 2032

  8.3.5.6 Russia

   8.3.5.6.1 Aloe Vera Market Size & Forecast, By Product, 2021 – 2032

   8.3.5.6.2 Aloe Vera Market Size & Forecast, By Distribution Channel, 2021 – 2032

   8.3.5.6.3 Aloe Vera Market Size & Forecast, By Application, 2021 – 2032

  8.3.5.7 Poland

   8.3.5.7.1 Aloe Vera Market Size & Forecast, By Product, 2021 – 2032

   8.3.5.7.2 Aloe Vera Market Size & Forecast, By Distribution Channel, 2021 – 2032

   8.3.5.7.3 Aloe Vera Market Size & Forecast, By Application, 2021 – 2032

  8.3.5.8 Rest of Europe

   8.3.5.8.1 Aloe Vera Market Size & Forecast, By Product, 2021 – 2032

   8.3.5.8.2 Aloe Vera Market Size & Forecast, By Distribution Channel, 2021 – 2032

   8.3.5.8.3 Aloe Vera Market Size & Forecast, By Application, 2021 – 2032

8.4 Asia-Pacific

 8.4.1 Key Trends

 8.4.2 Aloe Vera Market Size & Forecast, By Product, 2021 – 2032

 8.4.3 Aloe Vera Market Size & Forecast, By Distribution Channel, 2021 – 2032

 8.4.4 Aloe Vera Market Size & Forecast, By Application, 2021 – 2032

 8.4.5 Aloe Vera Market Size & Forecast, By Country, 2021 – 2032

  8.4.5.1 China

   8.4.5.1.1 Aloe Vera Market Size & Forecast, By Product, 2021 – 2032

   8.4.5.1.2 Aloe Vera Market Size & Forecast, By Distribution Channel, 2021 – 2032

   8.4.5.1.3 Aloe Vera Market Size & Forecast, By Application, 2021 – 2032

  8.4.5.2 India

   8.4.5.2.1 Aloe Vera Market Size & Forecast, By Product, 2021 – 2032

   8.4.5.2.2 Aloe Vera Market Size & Forecast, By Distribution Channel, 2021 – 2032

   8.4.5.2.3 Aloe Vera Market Size & Forecast, By Application, 2021 – 2032

  8.4.5.3 Japan

   8.4.5.3.1 Aloe Vera Market Size & Forecast, By Product, 2021 – 2032

   8.4.5.3.2 Aloe Vera Market Size & Forecast, By Distribution Channel, 2021 – 2032

   8.4.5.3.3 Aloe Vera Market Size & Forecast, By Application, 2021 – 2032

  8.4.5.4 South Korea

   8.4.5.4.1 Aloe Vera Market Size & Forecast, By Product, 2021 – 2032

   8.4.5.4.2 Aloe Vera Market Size & Forecast, By Distribution Channel, 2021 – 2032

   8.4.5.4.3 Aloe Vera Market Size & Forecast, By Application, 2021 – 2032

  8.4.5.5 Australia

   8.4.5.5.1 Aloe Vera Market Size & Forecast, By Product, 2021 – 2032

   8.4.5.5.2 Aloe Vera Market Size & Forecast, By Distribution Channel, 2021 – 2032

   8.4.5.5.3 Aloe Vera Market Size & Forecast, By Application, 2021 – 2032

  8.4.5.6 ASEAN Countries

   8.4.5.6.1 Aloe Vera Market Size & Forecast, By Product, 2021 – 2032

   8.4.5.6.2 Aloe Vera Market Size & Forecast, By Distribution Channel, 2021 – 2032

   8.4.5.6.3 Aloe Vera Market Size & Forecast, By Application, 2021 – 2032

  8.4.5.7 Rest of Asia-Pacific

   8.4.5.7.1 Aloe Vera Market Size & Forecast, By Product, 2021 – 2032

   8.4.5.7.2 Aloe Vera Market Size & Forecast, By Distribution Channel, 2021 – 2032

   8.4.5.7.3 Aloe Vera Market Size & Forecast, By Application, 2021 – 2032

8.5 Latin America

 8.5.1 Key Trends

 8.5.2 Aloe Vera Market Size & Forecast, By Product, 2021 – 2032

 8.5.3 Aloe Vera Market Size & Forecast, By Distribution Channel, 2021 – 2032

 8.5.4 Aloe Vera Market Size & Forecast, By Application, 2021 – 2032

 8.5.5 Aloe Vera Market Size & Forecast, By Country, 2021 – 2032

  8.5.5.1 Brazil

   8.5.5.1.1 Aloe Vera Market Size & Forecast, By Product, 2021 – 2032

   8.5.5.1.2 Aloe Vera Market Size & Forecast, By Distribution Channel, 2021 – 2032

   8.5.5.1.3 Aloe Vera Market Size & Forecast, By Application, 2021 – 2032

  8.5.5.2 Argentina

   8.5.5.2.1 Aloe Vera Market Size & Forecast, By Product, 2021 – 2032

   8.5.5.2.2 Aloe Vera Market Size & Forecast, By Distribution Channel, 2021 – 2032

   8.5.5.2.3 Aloe Vera Market Size & Forecast, By Application, 2021 – 2032

  8.5.5.3 Mexico

   8.5.5.3.1 Aloe Vera Market Size & Forecast, By Product, 2021 – 2032

   8.5.5.3.2 Aloe Vera Market Size & Forecast, By Distribution Channel, 2021 – 2032

   8.5.5.3.3 Aloe Vera Market Size & Forecast, By Application, 2021 – 2032

  8.5.5.4 Colombia

   8.5.5.4.1 Aloe Vera Market Size & Forecast, By Product, 2021 – 2032

   8.5.5.4.2 Aloe Vera Market Size & Forecast, By Distribution Channel, 2021 – 2032

   8.5.5.4.3 Aloe Vera Market Size & Forecast, By Application, 2021 – 2032

  8.5.5.5 Rest of Latin America

   8.5.5.5.1 Aloe Vera Market Size & Forecast, By Product, 2021 – 2032

   8.5.5.5.2 Aloe Vera Market Size & Forecast, By Distribution Channel, 2021 – 2032

   8.5.5.5.3 Aloe Vera Market Size & Forecast, By Application, 2021 – 2032

8.6 Middle East & Africa

 8.6.1 Key Trends

 8.6.2 Aloe Vera Market Size & Forecast, By Product, 2021 – 2032

 8.6.3 Aloe Vera Market Size & Forecast, By Distribution Channel, 2021 – 2032

 8.6.4 Aloe Vera Market Size & Forecast, By Application, 2021 – 2032

 8.6.5 Aloe Vera Market Size & Forecast, By Country, 2021 – 2032

  8.6.5.1 UAE

   8.6.5.1.1 Aloe Vera Market Size & Forecast, By Product, 2021 – 2032

   8.6.5.1.2 Aloe Vera Market Size & Forecast, By Distribution Channel, 2021 – 2032

   8.6.5.1.3 Aloe Vera Market Size & Forecast, By Application, 2021 – 2032

  8.6.5.2 Saudi Arabia

   8.6.5.2.1 Aloe Vera Market Size & Forecast, By Product, 2021 – 2032

   8.6.5.2.2 Aloe Vera Market Size & Forecast, By Distribution Channel, 2021 – 2032

   8.6.5.2.3 Aloe Vera Market Size & Forecast, By Application, 2021 – 2032

  8.6.5.3 Qatar

   8.6.5.3.1 Aloe Vera Market Size & Forecast, By Product, 2021 – 2032

   8.6.5.3.2 Aloe Vera Market Size & Forecast, By Distribution Channel, 2021 – 2032

   8.6.5.3.3 Aloe Vera Market Size & Forecast, By Application, 2021 – 2032

  8.6.5.4 Egypt

   8.6.5.4.1 Aloe Vera Market Size & Forecast, By Product, 2021 – 2032

   8.6.5.4.2 Aloe Vera Market Size & Forecast, By Distribution Channel, 2021 – 2032

   8.6.5.4.3 Aloe Vera Market Size & Forecast, By Application, 2021 – 2032

  8.6.5.5 South Africa

   8.6.5.5.1 Aloe Vera Market Size & Forecast, By Product, 2021 – 2032

   8.6.5.5.2 Aloe Vera Market Size & Forecast, By Distribution Channel, 2021 – 2032

   8.6.5.5.3 Aloe Vera Market Size & Forecast, By Application, 2021 – 2032

  8.6.5.6 Rest of Middle East & Africa

   8.6.5.6.1 Aloe Vera Market Size & Forecast, By Product, 2021 – 2032

   8.6.5.6.2 Aloe Vera Market Size & Forecast, By Distribution Channel, 2021 – 2032

   8.6.5.6.3 Aloe Vera Market Size & Forecast, By Application, 2021 – 2032

9. Competitive Landscape

 9.1 Key Players' Positioning

 9.2 Competitive Developments

  9.2.1 Key Strategies Adopted (%), By Key Players, 2024

  9.2.2 Year-Wise Strategies & Development, 2021 – 2025

  9.2.3 Number Of Strategies Adopted By Key Players, 2024

 9.3 Market Share Analysis, 2024

 9.4 Product/Service & Application Benchmarking

  9.4.1 Product/Service Specifications & Features By Key Players

  9.4.2 Product/Service Heatmap By Key Players

  9.4.3 Application Heatmap By Key Players

 9.5 Industry Start-Up & Innovation Landscape

9.6 Key Company Profiles

 9.6.1 Agromayal Botánica S.A. de C.V.

  9.6.1.1 Company Overview & Snapshot

  9.6.1.2 Product/Service Portfolio

  9.6.1.3 Key Company Financials

  9.6.1.4 SWOT Analysis

9.6.2 Aloe Farms, Inc.

9.6.3 Aloe Laboratories, Inc.

9.6.4 Lily of the Desert Organic

9.6.5 Pharmachem Laboratories, Inc.

9.6.6 Foodchem International Corporation

9.6.7 Terry Laboratories, Inc.

9.6.8 Aloecorp, Inc.

9.6.9 Natural Aloe Costa Rica S.A.

9.6.10 Aloe Queen Inc.

9.6.11 Herbalife Nutrition Ltd.

9.6.12 Forever Living Products

9.6.13 Patanjali Ayurved Ltd.

9.6.14 Dabur India Ltd.

9.6.15 Nature’s Way Products, LLC

9.6.16 Amway Corporation

9.6.17 NOW Foods

9.6.18 Nutralo Group Inc.

9.6.19 Fruit of the Earth, Inc.

9.6.20 Aloecorp Korea Ltd.

10. Analyst Recommendations

 10.1 SNS Insider Opportunity Map

 10.2 Industry Low-Hanging Fruit Assessment

 10.3 Market Entry & Growth Strategy

 10.4 Analyst Viewpoint & Suggestions On Market Growth

11. Assumptions

12. Disclaimer

13. Appendix

 13.1 List Of Tables

 13.2 List Of Figures

Key Segmentation

By Product

  • Liquid
  • Capsule
  • Powder
  • Gels

By Distribution Channel

  • Offline
  • Online

By Application

  • Food & Beverages
  • Pharmaceutical
  • Cosmetic

Request for Segment Customization as per your Business Requirement: Segment Customization Request

Regional Coverage: 

North America

  • US
  • Canada

Europe

  • Germany
  • UK
  • France
  • Italy
  • Spain
  • Russia
  • Poland
  • Rest of Europe

Asia Pacific

  • China
  • India
  • Japan
  • South Korea
  • Australia
  • ASEAN Countries
  • Rest of Asia Pacific

Middle East & Africa

  • UAE
  • Saudi Arabia
  • Qatar
  • South Africa
  • Rest of Middle East & Africa

Latin America

  • Brazil
  • Argentina
  • Mexico
  • Colombia
  • Rest of Latin America

Request for Country Level Research Report: Country Level Customization Request

Available Customization 

With the given market data, SNS Insider offers customization as per the company’s specific needs. The following customization options are available for the report: 

  • Detailed Volume Analysis 
  • Criss-Cross segment analysis (e.g. Product X Application) 
  • Competitive Product Benchmarking 
  • Geographic Analysis 
  • Additional countries in any of the regions 
  • Customized Data Representation 
  • Detailed analysis and profiling of additional market player


An accurate research report requires proper strategizing as well as implementation. There are multiple factors involved in the completion of good and accurate research report and selecting the best methodology to compete the research is the toughest part. Since the research reports we provide play a crucial role in any company’s decision-making process, therefore we at SNS Insider always believe that we should choose the best method which gives us results closer to reality. This allows us to reach at a stage wherein we can provide our clients best and accurate investment to output ratio.

Each report that we prepare takes a timeframe of 350-400 business hours for production. Starting from the selection of titles through a couple of in-depth brain storming session to the final QC process before uploading our titles on our website we dedicate around 350 working hours. The titles are selected based on their current market cap and the foreseen CAGR and growth.


The 5 steps process:

Step 1: Secondary Research:

Secondary Research or Desk Research is as the name suggests is a research process wherein, we collect data through the readily available information. In this process we use various paid and unpaid databases which our team has access to and gather data through the same. This includes examining of listed companies’ annual reports, Journals, SEC filling etc. Apart from this our team has access to various associations across the globe across different industries. Lastly, we have exchange relationships with various university as well as individual libraries.

Secondary Research

Step 2: Primary Research

When we talk about primary research, it is a type of study in which the researchers collect relevant data samples directly, rather than relying on previously collected data.  This type of research is focused on gaining content specific facts that can be sued to solve specific problems. Since the collected data is fresh and first hand therefore it makes the study more accurate and genuine.

We at SNS Insider have divided Primary Research into 2 parts.

Part 1 wherein we interview the KOLs of major players as well as the upcoming ones across various geographic regions. This allows us to have their view over the market scenario and acts as an important tool to come closer to the accurate market numbers. As many as 45 paid and unpaid primary interviews are taken from both the demand and supply side of the industry to make sure we land at an accurate judgement and analysis of the market.

This step involves the triangulation of data wherein our team analyses the interview transcripts, online survey responses and observation of on filed participants. The below mentioned chart should give a better understanding of the part 1 of the primary interview.

Primary Research

Part 2: In this part of primary research the data collected via secondary research and the part 1 of the primary research is validated with the interviews from individual consultants and subject matter experts.

Consultants are those set of people who have at least 12 years of experience and expertise within the industry whereas Subject Matter Experts are those with at least 15 years of experience behind their back within the same space. The data with the help of two main processes i.e., FGDs (Focused Group Discussions) and IDs (Individual Discussions). This gives us a 3rd party nonbiased primary view of the market scenario making it a more dependable one while collation of the data pointers.

Step 3: Data Bank Validation

Once all the information is collected via primary and secondary sources, we run that information for data validation. At our intelligence centre our research heads track a lot of information related to the market which includes the quarterly reports, the daily stock prices, and other relevant information. Our data bank server gets updated every fortnight and that is how the information which we collected using our primary and secondary information is revalidated in real time.

Data Bank Validation

Step 4: QA/QC Process

After all the data collection and validation our team does a final level of quality check and quality assurance to get rid of any unwanted or undesired mistakes. This might include but not limited to getting rid of the any typos, duplication of numbers or missing of any important information. The people involved in this process include technical content writers, research heads and graphics people. Once this process is completed the title gets uploader on our platform for our clients to read it.

Step 5: Final QC/QA Process:

This is the last process and comes when the client has ordered the study. In this process a final QA/QC is done before the study is emailed to the client. Since we believe in giving our clients a good experience of our research studies, therefore, to make sure that we do not lack at our end in any way humanly possible we do a final round of quality check and then dispatch the study to the client.