Banknotes Market Report Scope & Overview:
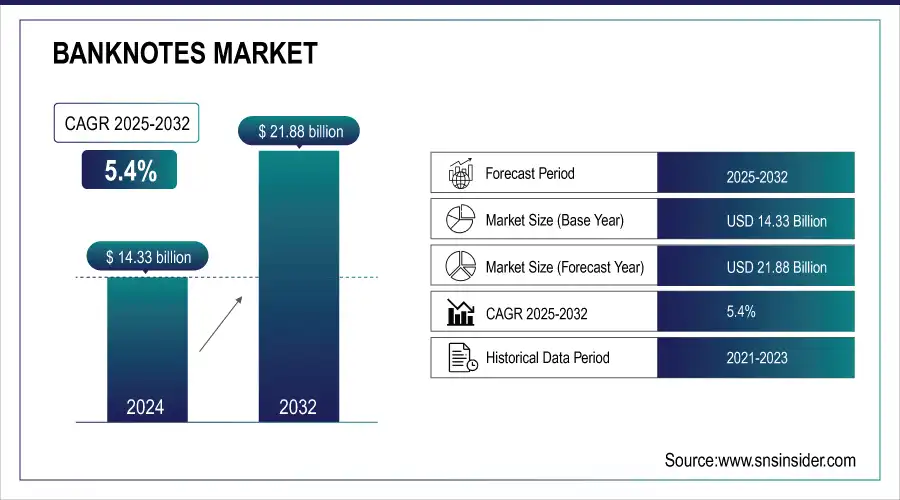
The Banknotes Market size was valued at USD 14.33 billion in 2024 and is expected to reach USD 21.88 billion by 2032, growing at a CAGR of 5.4% over the forecast period of 2025-2032.
The continued dependence on cash in developing nations, need for longer-lasting and secure banknotes, and technological advancements in printing and security features are driving growth. Digital payment may be booming, but in Asia, Africa, and Latin America, cash is king. The banknotes industry is evolving with new technologies to combat counterfeiting, ensuring the long-term sustainability of physical currency.
To Get more information on Banknotes Market - Request Free Sample Report
For instance, according to report on the state of consumer digital payments, approximately 92% of the U.S. consumers and 90% of European consumers reported making some form of digital payment over the past year.
Market Size and Forecast
-
Market Size in 2024: USD 14.33 Billion
-
Market Size by 2032: USD 21.88 Billion
-
CAGR: 5.4% from 2025 to 2032
-
Base Year: 2024
-
Forecast Period: 2025–2032
-
Historical Data: 2021–2023
Banknotes Market Trends
-
Rising demand for secure and durable currency is driving the banknotes market.
-
Adoption of advanced security features, including holograms, watermarks, and polymer substrates, is reducing counterfeiting.
-
Expansion of global cash circulation and economic growth is boosting banknote production.
-
Integration of sustainable and environmentally friendly materials is shaping market trends.
-
Increasing need for central banks to update and replace worn-out notes is fueling demand.
-
Advancements in printing technology and anti-counterfeit innovations are enhancing note quality and security.
-
Collaborations between central banks, security printing companies, and technology providers are accelerating innovation and deployment.
The U.S. banknotes Market size was USD 3.54 billion in 2024 and is expected to grow to USD 4.78 billion by 2032, with a growing CAGR of 3.83% during the forecast period of 2025-2032.
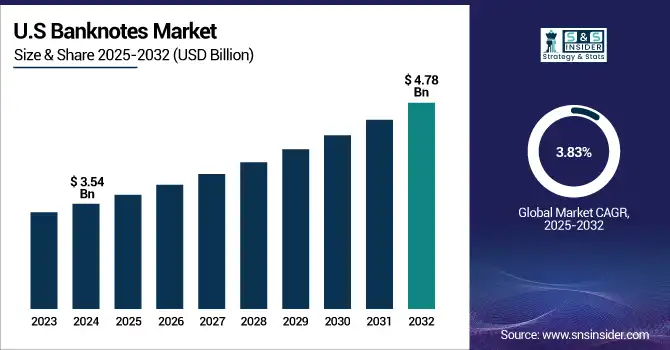
Market growth in the U.S. is driven by a sustained demand for physical money in multiple sectors, such as retail, transportation, and banking. Features including color-shifting inks and holograms improve the currency security potential with the advancement in printing technologies. Market growth is projected to continue as the U.S. Bureau of Engraving and Printing moves toward more durable and innovative polymer banknotes.
Banknotes Market Growth Drivers:
-
Continued Reliance on Physical Currency and Advancements in Security Features Fuel Market Growth
As digital payments grow, cash continues to be important, especially in cash-oriented economies. As nations are working on curtailing counterfeiting and improving safety, the desire for secure and durable banknotes is increasing. The growing expenditure in the currency security and durability by various countries, further supports the growth of the market as technological advancements change in printing. Sustained banknotes market growth is driven by the continued reliance on physical cash, especially in developing economies.
For instance, according to a 2023 report by the Bank for International Settlements (BIS), around 80% of retail transactions in developing economies, such as India, Mexico, and Indonesia are still conducted in cash.
Banknotes Market Restraints:
-
High Production and Maintenance Costs Associated with Advanced Banknote Technologies Limit Market Growth Potential
Advanced currency technologies require high production and maintenance costs, which is a key factor restraining the banknotes market growth. Sophisticated security features and polymer-based materials raise manufacturing costs, demanding special equipment and technical training. Moreover, infrastructure, such as currency processors increases operational overhead requiring markets with weaker financial infrastructure to remain in a mess.
Banknotes Market Opportunities:
-
Rising Demand for Polymer Banknotes Offers Significant Growth Potential.
A growing market opportunity in polymer banknotes due to their durability, security, and environmental benefits. Polymer notes have longer life and do not require replacements frequently, therefore lowering long-term costs and contributing to environmental goals. They are more difficult to counterfeit due to their superior security features, several emerging banknotes market trends, such as the growing adoption of polymer banknotes, are poised to enhance the market’s growth.
For instance, over 60 countries have adopted polymer banknotes, including early adopters, such as Australia, Canada, and Singapore.
Banknotes Market Challenges:
-
Counterfeiting Threats and Technological Adaptation Challenges Pose Significant Hurdles for this market Growth
Even with the most advanced security measures, counterfeiting remains the single most disruptive factor in this market. As counterfeiters always seek new ways of forging security methods and they have to constantly innovate. Although these features are currently used to prevent counterfeiting and the high pace of technological changes leads to huge costs for manufacturers. In poorer countries following anti-counterfeiting measures can be a major cost and logistical burden.
Banknotes Market Segmentation Analysis:
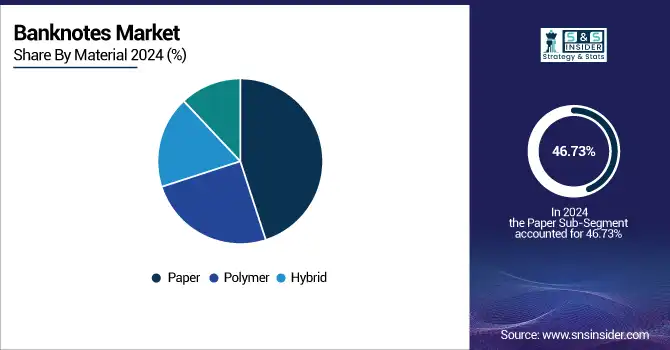
By Material, Paper dominates with 46.73% revenue share due to traditional production methods and widespread usage, while polymer grows fastest with 6.16% CAGR.
In 2024, the paper segment held the largest revenue share of 46.73% due to a plethora of nations and paper cash still being the king. The dominance of paper banknotes persists due to the relatively traditional and simple production process. Despite polymer solutions, paper money remains dominant due to traditional production methods.
The polymer segment is expected to grow with the fastest CAGR of 6.16% during the forecast period. The improved longevity and wear resistance of polymer banknotes is contributing to their increased use. Key companies, including De La Rue and Giesecke+Devrient, are leading innovations in security features and polymer technology. The rising demand for durable and long-lasting notes is driving market growth as countries prioritize sustainable currency solutions.
By Denomination, Low-denomination notes lead with 62.36% share, used widely for daily transactions; high-denomination notes grow fastest at 5.98% CAGR.
The low-denomination segment dominates the banknotes market with a 62.36% revenue share in 2024 as they are widely used for everyday transactions and are important for the stability of the economy. Governments are enhancing security and durability of low-denomination notes by advancing polymer technology and embedding security features. The market share of these high-denomination notes keeps on rising as demand remains strong in cash-oriented areas.
The high-denomination segment is expected to grow with the fastest CAGR of 5.98% during the forecast period of 2025-2032 due to their importance for higher value transactions, and are also rapidly adopting more sophisticated anti-counterfeiting measures, including colour-shifting inks and holograms. A detailed analysis reveals the expanding demand for high-security features, particularly in high-denomination notes.
By Security Features, Watermarks hold 29.60% share, offering reliable anti-counterfeiting, while color-shifting inks grow fastest with 6.48% CAGR.
The watermarks segment dominates with 29.60% revenue share in 2024. Watermarks are one of the most successful and secure anti-counterfeit features, which are common in paper-based banknotes. The incorporation of watermarking in a more advanced way by companies in the money security domain, such as Giesecke+Devrient (G+D), is growing, as such watermarks remain an important component of many central banks around the world. High reliability, ease of authentication, widespread adoption in banknotes, and strong anti-counterfeiting capabilities drive the watermarks segment growth.
The color-shifting ink segment is growing with the highest CAGR of 6.48% during the forecast period. Growing demand for anti-counterfeiting measures, enhanced currency durability, and adoption of advanced security technologies are driving color-shifting ink growth. It is the same kind of technology that banknotes employ to make them more difficult to counterfeit, where the ink appears to change color when viewed at different angles. Banknote printing companies have started to incorporate color-shifting ink in their designs, including De La Rue and Crane Currency.
By Printing Technology, Intaglio printing leads with 37.50% revenue share due to tactile security; digital printing grows fastest at 6.59% CAGR.
Intaglio printing is the fastest revenue generating segment with a 37.50% revenue share in 2024. Intaglio printing, unique to its ability is known for providing raised, tactile features that are highly secure and resistant to counterfeiting in banknotes. World-leading firms, such as De La Rue and Giesecke+Devrient keep pushing higher standards of intaglio, updating both patterns and materials, to make counterfeiting ever more difficult. Governments are focusing on enhancing the bank note's security with advanced printing technologies.
The digital printing segment is expected to grow with the fastest CAGR of 6.59% as it offers greater design flexibility and generally faster turnaround times. Due to the growing need for customized and short-run production of banknotes, companies, such as De La Rue and Giesecke+Devrient (G+D) are taking advantage of the benefits of digital printing. The advent of digital technology will take large chunk of the banknote market when it further develops.
By End-Use, Central banks dominate with 49.31% share, issuing most banknotes, while government agencies segment grows fastest at 6.11% CAGR.
The central banks segment dominates the market with a 49.31% revenue share in 2024. Banknotes are issued mainly by central banks, which invest significant resources on added protection against counterfeiting. Central banks rely on companies, such as the U.S. Bureau of Engraving and Printing and innovators including De La Rue for currency production solutions. However, central banks, leveraging their key position in the economy, will always monopolize the market for banknotes.
The government agencies segment is projected to grow with the fastest CAGR of 6.11%. Rising currency circulation, increasing anti-counterfeiting initiatives, and adoption of advanced security features are driving government agencies segment growth. However, in Government agencies, we see this trend with progressive adoption of multiple complex banknote solution for a specialized currency requirement starting from issuing new sets of commemorative or limited-edition notes. In response, specialty security features are being created.
Banknotes Market Regional Analysis
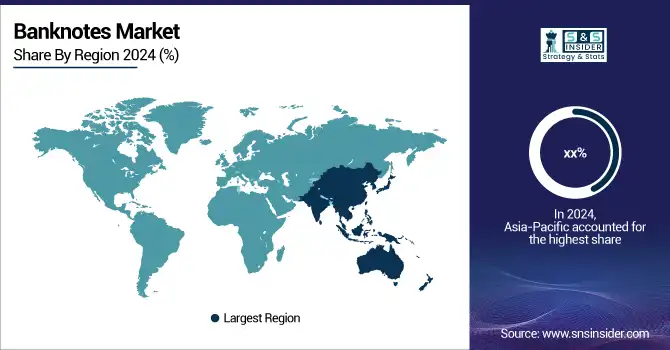
Asia Pacific Banknotes Market Insights
The Asia-Pacific banknotes market dominates globally, driven by large populations, persistent cash usage, and increasing adoption of polymer banknotes. Strong government investment in printing technologies and innovation enhances production capabilities. China’s advanced banknote printing infrastructure and India’s sustained cash circulation significantly contribute to regional demand. These factors collectively support both widespread adoption and large-scale production of secure, durable, and technologically advanced banknotes, reinforcing Asia-Pacific’s leadership position in the global banknotes market.
Get Customized Report as per Your Business Requirement - Enquiry Now
North America Banknotes Market Insights
North America holds a prominent position in the banknotes market, driven by high demand for secure and durable currency. Central banks focus on advanced printing technologies, polymer notes, and anti-counterfeiting features. Economic stability, rising cash circulation in specific sectors, and stringent regulatory standards support market growth. Additionally, investments in innovative banknote production, security features, and collaborations with global printing solution providers further strengthen the region’s leadership in high-quality, secure currency manufacturing.
Europe Banknotes Market Insights
Europe holds a significant share in the banknotes market, driven by strong demand for secure, durable currency solutions. Advanced printing technologies, including polymer and hybrid notes, are widely adopted. Central banks prioritize anti-counterfeiting features, digital integration, and sustainability initiatives. Rising economic activities, increasing cash transactions in certain regions, and government regulations enforcing high-security standards further propel market growth, making Europe a key hub for innovative banknote production and security solutions.
Middle East & Africa and Latin America Banknotes Market Insights
The Middle East & Africa and Latin America banknotes market is growing due to increasing demand for secure and durable currency solutions. Central banks focus on anti-counterfeiting technologies, polymer notes, and advanced printing techniques. Rising cash usage, economic expansion, and government regulations supporting secure transactions drive market adoption. Additionally, collaborations with global security printing firms and investments in innovative banknote production technologies are further fueling growth across these regions.
Banknotes Market Competitive Landscape:
De La Rue plc (2025)
De La Rue, founded in 1821 and headquartered in Basingstoke, UK, is a global leader in secure printing, including banknotes, passports, and authentication solutions. The company specializes in high-security currency production, anti-counterfeiting technologies, and secure identity documents, serving central banks and governments worldwide. De La Rue focuses on innovation, quality, and sustainability to ensure secure, reliable, and technologically advanced solutions in the global banknotes and secure printing market.
-
April 2025: U.S. private equity firm Atlas Holdings agreed to acquire De La Rue for USD 263 million, marking a significant shift in the global banknotes market.
Key Players
Major banknotes market companies are
-
Crane Currency
-
Giesecke+Devrient (G+D)
-
Oberthur Fiduciaire
-
Security Printing and Minting Corporation of India Ltd. (SPMCIL)
-
Royal Joh. Enschedé
-
China Banknote Printing and Minting Corporation
-
Note Printing Australia (NPA)
-
Banco de México – Banknote Printing Works
-
Orell Füssli Security Printing Ltd
-
Hong Kong Note Printing Limited (HKNPL)
-
Banque de France
-
Perum Peruri
-
Koenig & Bauer Banknote Solutions
-
Banknote Corporation of America
-
PT Pura Barutama
-
Sangal Papers Ltd
-
Pudumjee Paper Products Ltd
-
envoPAP Ltd
| Report Attributes | Details |
|---|---|
| Market Size in 2024 | USD 14.33 Billion |
| Market Size by 2032 | USD 21.88 Billion |
| CAGR | CAGR of 5.4% From 2025 to 2032 |
| Base Year | 2024 |
| Forecast Period | 2025-2032 |
| Historical Data | 2021-2023 |
| Report Scope & Coverage | Market Size, Segments Analysis, Competitive Landscape, Regional Analysis, DROC & SWOT Analysis, Forecast Outlook |
| Key Segments | •By Material (Paper, Polymer, Hybrid) •By Denomination (Low-denomination, High-denomination) •By Security Features (Watermarks, Security threads, Holograms, Color-shifting ink, Microprinting, UV features) •By Printing Technology (Offset printing, Intaglio printing, Letterpress printing, Screen printing, Digital printing) •By End Use (Central banks, Government agencies, Commercial banks) |
| Regional Analysis/Coverage | North America (US, Canada, Mexico), Europe (Germany, France, UK, Italy, Spain, Poland, Turkey, Rest of Europe), Asia Pacific (China, India, Japan, South Korea, Singapore, Australia, Rest of Asia Pacific), Middle East & Africa (UAE, Saudi Arabia, Qatar, South Africa, Rest of Middle East & Africa), Latin America (Brazil, Argentina, Rest of Latin America) |
| Company Profiles |
De La Rue plc, Crane Currency, Giesecke+Devrient (G+D), Oberthur Fiduciaire, Canadian Bank Note Company, Security Printing and Minting Corporation of India Ltd. (SPMCIL), Royal Joh. Enschedé, China Banknote Printing and Minting Corporation, Note Printing Australia (NPA), Banco de México – Banknote Printing Works, Orell Füssli Security Printing Ltd, Hong Kong Note Printing Limited (HKNPL), Banque de France, Perum Peruri, Koenig & Bauer Banknote Solutions, Banknote Corporation of America, PT Pura Barutama, Sangal Papers Ltd, Pudumjee Paper Products Ltd, envoPAP Ltd |
Frequently Asked Questions
Watermarks dominated with a 29.60% revenue share in 2024, remaining a crucial anti-counterfeiting tool across global banknote issuances.
Germany leads in Europe with cutting-edge anti-counterfeiting technologies like color-shifting inks and holograms, supporting strong euro zone stability.
Paper held the largest share at 46.73% in 2024, driven by traditional production processes and persistent preference for paper cash.
The Banknotes Market is expected to grow at a CAGR of 5.4% between 2025 and 2032, fueled by security enhancements and cash dependency.
The Banknotes Market size was USD 14.33 billion in 2024, driven by continued cash reliance and technological innovations in security features.
Get in Touch
