Brand Protection Tools Market size was valued at USD 2.93 billion in 2024 and is expected to reach USD 6.34 billion by 2032, growing at a CAGR of 9.11% from 2025-2032.
The Brand Protection Tools Market growth is fuelled by escalating online counterfeiting, e-commerce growth, and the enhanced requirement to protect brand reputation. Moreover, innovations in AI and machine learning advance detection capabilities, prompting more firms to invest in end-to-end digital brand protection solutions worldwide.
For instance, in 2022, Amazon blocked more than 800,000 attempts to open new selling accounts, thereby preventing malicious players from posting counterfeit goods. In the same vein, Red Points handles and examines over 2.7 billion data points every month to identify and eliminate counterfeit listings, supporting more than 1,300 brands across the world.
U.S. Brand Protection Tools Market size was valued at USD 0.85 billion in 2024 and is expected to reach USD 1.68 billion by 2032, growing at a CAGR of 8.93% from 2025-2032.
The U.S. Brand Protection Tools Market is growing due to the increase in instances of digital piracy, rising e-commerce fraud, and heightened concern among businesses to protect intellectual property as well as brand value through advanced AI-based monitoring and enforcement tools.
As per Mastercard's report, global e-commerce fraud losses totaled $41 billion in 2022, with more than 42% of the fraudulent transaction value coming from North America. This highlights the immediate necessity for strong digital brand protection strategies in the U.S. market.
Drivers
Growing online counterfeiting and digital brand misuse are forcing companies to take up automated brand protection solutions at scale.
The growth in e-commerce has posed exponentially more risks to counterfeit products, unauthorized resellers, and intellectual property theft, necessitating brand protection. Companies are adopting AI-based technology to monitor online platforms, identify infringements, and counter promptly. Offense prevention defends not just brand equity but consumer confidence and IP compliance worldwide too. With marketplaces expanding in cyberspace, protecting online brand assets via scalable technology is a boardroom imperative by geographies and industry.
Restraints
Absence of standardization and non-unified enforcement practices are barriers to effectiveness of brand protection measures across various jurisdictions.
Brand protection in international markets is plagued by uneven IP legislation, diverse enforcement capacity, and legal intricacies within countries. These variations hinder the ability of businesses to implement a single strategy or anticipate prompt recourse. Even where online tools exist, jurisdictional constraints can thwart takedown measures or diminish their effectiveness. Consequently, firms find it difficult to have uniform brand protection coverage across geographies, curtailing the overall impact of their tools and strategies, especially in weak enforcement economies of emerging markets.
Opportunities
Incorporation of machine learning and AI in brand protection technology is improving threat detection and opening doors to innovation.
Technological advancements have made possible smarter, faster, and more precise online brand abuse detection. Brand defense technologies enabled by artificial intelligence can now find fakes, impersonators, and unauthorized posting on thousands of online destinations in real time. Machine learning enhances the technologies by constantly refining detection based on changing threats and user behavior. This technology is not only turning brand protection into a business intelligence tool, but also into a legal defense. Technology vendors that incorporate these innovations are best positioned to offer predictive, customized solutions to more customers.
Deloitte's AI software "Dupe Killer" searches millions of web pages to identify design infringements, picking up unauthorized copies beyond trademark names. It reported 312 websites selling imitation products, suggesting legal action for 48% of instances.
Challenges
Insufficient awareness and concern for brand protection by businesses slows down investment and dilutes strategic reaction to threats.
Most organizations, particularly outside high-risk industries, still treat brand protection as an afterthought and not a strategic priority. This ignorance translates to reactive rather than proactive approaches with limited budget backing or executive attention. Without strong internal advocacy or cross-functional stewardship, even when tools are put in place, they are likely underleveraged. This organizational and cultural resistance is the biggest of all, particularly with online threats increasingly widespread and reputational harm instantly real in today's highly connected marketplace.
By Enterprise Size
Large enterprises led the Brand Protection Tools Market in 2024 with a 64% revenue share because of their widespread global reach, high brand value, and higher exposure to counterfeits across various digital channels. These players possess the financial resources and internal talent to spend on sophisticated brand protection technologies. Their proactive stance towards protecting brand value, compliance requirements, and customer confidence places them as the prime implementers of end-to-end protection solutions.
Small and medium-sized enterprises (SMEs) are anticipated to expand at the fastest CAGR of 10.25% during 2025-2032 due to rising digital adoption and enhanced awareness of IP threats. With SMEs growing online to reach wider markets, they are threatened by mounting risks of counterfeiting and brand impersonation. Economical and scalable cloud-based brand protection platforms are now available, allowing SMEs to actively track and protect their brand assets without the need for extensive in-house teams or significant capital investment.
By Application
The Consumer Goods and Retail industry accounted for the largest revenue percentage of 25% in 2024, primarily because the sector is most susceptible to counterfeiting products, unauthorized resellers, and copying packaging. Having powerful customer-facing brands and extensive online distribution channels, businesses in the industry are investing heavily in brand protection solutions to maintain brand integrity, trust from customers, and regulatory adherence. The industry's high number of SKUs and marketplace visibility make digital enforcement an ongoing and necessary process.
Pharmaceuticals and Healthcare are expected to record the highest growth at a CAGR of 12.31% over the forecast period of 2025-2032 due to mounting counterfeit drug threats and tightening worldwide regulations. With public health and safety at stake, the industry is facing increasing pressure to authenticate products and secure digital channels against fraud. Increasing use of e-pharmacies and cross-border medicine trade demand robust protection mechanisms to authenticate product origin, detect unauthorized listings, and authenticate compliance with health authority standards.
By Deployment
Cloud Based segment lead the Brand Protection Tools Market in terms of revenue share of roughly 69% in 2024 and is anticipated to progress at a fastest CAGR of roughly 9.72% during the forecast period from 2025–2032. The flexibility, cost effectiveness, and its capability to present real-time safety across global digital environments are major reasons behind it dominating the Market. Cloud-based solutions are favored due to their rapid deployment, scalability, and low infrastructure needs, making them suitable for small, medium-sized, and large organizations. Cloud-based solutions provide centralized threat identification, auto-takedown operations, and effortless updates, empowering businesses to remain at the forefront of emerging threats. As online commerce growth and cybersecurity threats increase, cloud adoption only gains momentum.
By Software Type
Digital Rights Management (DRM) Tools had the highest revenue share of 16% in 2024, with media, publishing, and software firms focusing on protecting copyrighted digital content from piracy and unauthorized distribution.Growing use of digital content and subscription services have made DRM a requirement for protecting intellectual property and maintaining revenue integrity. Businesses deploy these tools for access control, licensing, and encryption for various types of content and platforms.
Social Media Monitoring and Brand Reputation Management Tools are anticipated to grow at the highest CAGR of 11.92% from 2025-2032, as brand activity on social media increases and the risk of impersonation, fake reviews, and viral disinformation grows. With real-time consumer interaction on the rise, brands are giving importance to tools that provide real-time alerting, sentiment analysis, and automated removals. These provide protection to reputation, help preserve consumer trust, and act quickly towards reputational threats.
North America led the Brand Protection Tools Market in 2024 with a 38% revenue share, driven by effective regulatory landscapes, high penetration of digital commerce, and far-reaching intellectual property protection awareness. Companies in markets like technology, pharmaceuticals, and retail actively spend money on cutting-edge brand protection technology. The maturity of the digital ecosystem in the region and high-profile counterfeiting instances have pushed adoption of automated enforcement and monitoring technology in top U.S. and Canadian markets.
The U.S. led the Brand Protection Tools Market with robust IP enforcement, strong digital adoption, and large investments from leading enterprises across industries.
Asia Pacific is expected to expand at the highest CAGR of 10.99% during 2025-2032 due to the rapid expansion of e-commerce, widening digital brand recall, and increasing IP infringements in countries like China, India, and Southeast Asia. With regional companies expanding across the world and increasingly confronting threats of counterfeiting, demand for cost-effective and scalable solutions for brand security is on the rise. Government programs towards IP expansion of laws and enforcement are also propelling quicker adoption in industries within the region.
China is leading the Asia Pacific Brand Protection Tools Market because of its huge e-commerce landscape, high rate of counterfeiting, and rising regulatory enforcement activities.
Europe is a significant region in the Brand Protection Tools Market fueled by strict intellectual property regulations, increasing e-commerce activity, and increasing awareness amongst businesses to protect brand value over digital channels.
Germany is leading the Brand Protection Tools Market across Europe based on its robust manufacturing sector, strong IP laws, and high digital security technology adoption.
The Latin America Brand Protection Tools and Middle East & Africa Brand Protection Tools markets are evolving rapidly due to increased digital uptake, wider counterfeit threats, and more government initiatives to strengthen intellectual property enforcement within these regions.
Red Points, BrandShield, Corsearch, MarkMonitor, Counterfind, OpSec Security, NetNames, Sprockets, Incopro, Cimpress.
In 2024, MarkMonitor formed a strategic alliance with SecureWeb3 to provide comprehensive Web3 brand protection services to its clients
In 2024, Crane NXT acquired OpSec Security for $270 million, expanding its authentication solutions portfolio and creating a new Security and Authentication Technologies segment.
| Report Attributes | Details |
|---|---|
| Market Size in 2024 | USD 3.17 Billion |
| Market Size by 2032 | USD 6.34 Billion |
| CAGR | CAGR of 9.11% From 2025 to 2032 |
| Base Year | 2024 |
| Forecast Period | 2025-2032 |
| Historical Data | 2021-2023 |
| Report Scope & Coverage | Market Size, Segments Analysis, Competitive Landscape, Regional Analysis, DROC & SWOT Analysis, Forecast Outlook |
| Key Segments | • By Software Type (Digital Rights Management Tools, Anti-Counterfeiting Solutions, Trademark Monitoring and Enforcement Tools, Domain Monitoring and Protection Tools, Social Media Monitoring and Brand Reputation Management Tools, Online Brand Enforcement Tools, Intellectual Property Protection Tools, Others) • By Deployment (Cloud Based, On-Premises) • By Enterprise Size (Large Enterprises, Small and Medium Enterprises (SMEs)) • By Application (Consumer Goods and Retail, Pharmaceuticals and Healthcare, Electronics and Electrical, Automotive, Luxury Goods, Media and Entertainment, Software and Technology, Others) |
| Regional Analysis/Coverage | North America (US, Canada, Mexico), Europe (Germany, France, UK, Italy, Spain, Poland, Turkey, Rest of Europe), Asia Pacific (China, India, Japan, South Korea, Singapore, Australia, Rest of Asia Pacific), Middle East & Africa (UAE, Saudi Arabia, Qatar, South Africa, Rest of Middle East & Africa), Latin America (Brazil, Argentina, Rest of Latin America) |
| Company Profiles | Red Points, BrandShield, Corsearch, MarkMonitor, Counterfind, OpSec Security, NetNames, Sprockets, Incopro, Cimpress |
Ans: The market is expected to grow at a CAGR of 9.11% from 2025 to 2032.
Ans: The Brand Protection Tools Market was valued at USD 2.93 billion in 2024 globally.
Ans: Growth is driven by rising online counterfeiting, expanding e-commerce, and AI-powered tools enhancing detection and brand protection capabilities worldwide.
Ans: Large enterprises dominated in 2024 with 64% revenue share, due to global presence, higher brand risks, and advanced protection investments.
Ans: North America dominated with a 38% revenue share in 2024, driven by strong IP laws, high digital commerce, and regulatory enforcement.
Table Of Content
1. Introduction
1.1 Market Definition
1.2 Scope (Inclusion and Exclusions)
1.3 Research Assumptions
2. Executive Summary
2.1 Market Overview
2.2 Regional Synopsis
2.3 Competitive Summary
3. Research Methodology
3.1 Top-Down Approach
3.2 Bottom-up Approach
3.3. Data Validation
3.4 Primary Interviews
4. Market Dynamics Impact Analysis
4.1 Market Driving Factors Analysis
4.1.1 Drivers
4.1.2 Restraints
4.1.3 Opportunities
4.1.4 Challenges
4.2 PESTLE Analysis
4.3 Porter’s Five Forces Model
5. Statistical Insights and Trends Reporting
5.1 Dark Web Monitoring Metrics
5.2 Emergence of Smart ATMs in Outsourced Networks
5.3 Counterfeit Product Lifecycle
5.4 Customs and Border Protection Collaboration
6. Competitive Landscape
6.1 List of Major Companies By Region
6.2 Market Share Analysis By Region
6.3 Product Benchmarking
6.3.1 Product specifications and features
6.3.2 Pricing
6.4 Strategic Initiatives
6.4.1 Marketing and promotional activities
6.4.2 Distribution and Supply Chain Strategies
6.4.3 Expansion plans and new product launches
6.4.4 Strategic partnerships and collaborations
6.5 Technological Advancements
6.6 Market Positioning and Branding
7. Brand Protection Tools Market Segmentation By Software Type
7.1 Chapter Overview
7.2 Digital Rights Management Tools
7.2.1 Digital Rights Management Tools Market Trends Analysis (2021-2032)
7.2.2 Digital Rights Management Tools Market Size Estimates and Forecasts to 2032 (USD Billion)
7.3 Anti-Counterfeiting Solutions
7.3.1 Anti-Counterfeiting Solutions Market Trends Analysis (2021-2032)
7.3.2 Anti-Counterfeiting Solutions Market Size Estimates and Forecasts to 2032 (USD Billion)
7.4 Trademark Monitoring and Enforcement Tools
7.4.1 Trademark Monitoring and Enforcement Tools Market Trends Analysis (2021-2032)
7.4.2 Trademark Monitoring and Enforcement Tools Market Size Estimates and Forecasts to 2032 (USD Billion)
7.5 Domain Monitoring and Protection Tools
7.5.1 Domain Monitoring and Protection Tools Market Trends Analysis (2021-2032)
7.5.2 Domain Monitoring and Protection Tools Market Size Estimates and Forecasts to 2032 (USD Billion)
7.6 Social Media Monitoring and Brand Reputation Management Tools
7.6.1 Social Media Monitoring and Brand Reputation Management Tools Market Trends Analysis (2021-2032)
7.6.2 Social Media Monitoring and Brand Reputation Management Tools Market Size Estimates and Forecasts to 2032 (USD Billion)
7.7 Online Brand Enforcement Tools
7.7.1 Online Brand Enforcement Tools Market Trends Analysis (2021-2032)
7.7.2 Online Brand Enforcement Tools Market Size Estimates and Forecasts to 2032 (USD Billion)
7.8 Intellectual Property Protection Tools
7.8.1 Intellectual Property Protection Tools Market Trends Analysis (2021-2032)
7.8.2 Intellectual Property Protection Tools Tools Market Size Estimates and Forecasts to 2032 (USD Billion)
7.9 Others
7.9.1 Others Market Trends Analysis (2021-2032)
7.9.2 Others Market Size Estimates and Forecasts to 2032 (USD Billion)
8. Brand Protection Tools Market Segmentation By Enterprise Size
8.1 Chapter Overview
8.2 Large Enterprises
8.2.1 Large Enterprises Market Trends Analysis (2021-2032)
8.2.2 Large Enterprises Market Size Estimates and Forecasts to 2032 (USD Billion)
8.3 Small and Medium Enterprises (SMEs)
8.3.1 Small and Medium Enterprises (SMEs) Market Trends Analysis (2021-2032)
8.3.2 Small and Medium Enterprises (SMEs) Market Size Estimates and Forecasts to 2032 (USD Billion)
9. Brand Protection Tools Market Segmentation By Deployment
9.1 Chapter Overview
9.2 On-Premise
9.2.1 On-Premise Market Trends Analysis (2021-2032)
9.2.2 On-Premise Market Size Estimates and Forecasts to 2032 (USD Billion)
9.3 Cloud-Based
9.3.1 Cloud-Based Market Trends Analysis (2021-2032)
9.3.2 Cloud-Based Market Size Estimates and Forecasts to 2032 (USD Billion)
10. Brand Protection Tools Market Segmentation By Application
10.1 Chapter Overview
10.2 Consumer Goods and Retail
10.2.1 Consumer Goods and Retail Market Trends Analysis (2021-2032)
10.2.2 Consumer Goods and Retail Market Size Estimates and Forecasts to 2032 (USD Billion)
10.3 Pharmaceuticals and Healthcare
10.3.1 Pharmaceuticals and Healthcare Market Trend Analysis (2021-2032)
10.3.2 Pharmaceuticals and Healthcare Market Size Estimates and Forecasts to 2032 (USD Billion)
10.4 Electronics and Electrical
10.4.1 Electronics and Electrical Market Trends Analysis (2021-2032)
10.4.2 Electronics and Electrical Market Size Estimates and Forecasts to 2032 (USD Billion)
10.5 Automotive
10.5.1 Automotive Market Trends Analysis (2021-2032)
10.5.2 Automotive Market Size Estimates and Forecasts to 2032 (USD Billion)
10.6 Luxury Goods
10.6.1 Luxury Goods Market Trends Analysis (2021-2032)
10.6.2 Luxury Goods Market Size Estimates and Forecasts to 2032 (USD Billion)
10.7 Media and Entertainment
10.7.1 Media and Entertainment Market Trend Analysis (2021-2032)
10.7.2 Media and Entertainment Market Size Estimates and Forecasts to 2032 (USD Billion)
10.8 Software and Technology
10.8.1 Software and Technology Market Trends Analysis (2021-2032)
10.8.2 Software and Technology Market Size Estimates and Forecasts to 2032 (USD Billion)
10.9 Others
10.9.1 Others Market Trends Analysis (2021-2032)
10.9.2 Others Market Size Estimates and Forecasts to 2032 (USD Billion)
11. Regional Analysis
11.1 Chapter Overview
11.2 North America
11.2.1 Trend Analysis
11.2.2 North America Brand Protection Tools Market Estimates and Forecasts by Country (2021-2032) (USD Billion)
11.2.3 North America Brand Protection Tools Market Estimates and Forecasts By Software Type (2021-2032) (USD Billion)
11.2.4 North America Brand Protection Tools Market Estimates and Forecasts By Enterprise Size (2021-2032) (USD Billion)
11.2.5 North America Brand Protection Tools Market Estimates and Forecasts By Deployment (2021-2032) (USD Billion)
11.2.6 North America Brand Protection Tools Market Estimates and Forecasts By Application (2021-2032) (USD Billion)
11.2.7 USA
11.2.7.1 USA Brand Protection Tools Market Estimates and Forecasts By Software Type (2021-2032) (USD Billion)
11.2.7.2 USA Brand Protection Tools Market Estimates and Forecasts By Enterprise Size (2021-2032) (USD Billion)
11.2.7.3 USA Brand Protection Tools Market Estimates and Forecasts By Deployment (2021-2032) (USD Billion)
11.2.7.4 USA Brand Protection Tools Market Estimates and Forecasts By Application (2021-2032) (USD Billion)
11.2.8 Canada
11.2.8.1 Canada Brand Protection Tools Market Estimates and Forecasts By Software Type (2021-2032) (USD Billion)
11.2.8.2 Canada Brand Protection Tools Market Estimates and Forecasts By Enterprise Size (2021-2032) (USD Billion)
11.2.8.3 Canada Brand Protection Tools Market Estimates and Forecasts By Deployment (2021-2032) (USD Billion)
11.2.8.4 Canada Brand Protection Tools Market Estimates and Forecasts By Application (2021-2032) (USD Billion)
11.2.9 Mexico
11.2.9.1 Mexico Brand Protection Tools Market Estimates and Forecasts By Software Type (2021-2032) (USD Billion)
11.2.9.2 Mexico Brand Protection Tools Market Estimates and Forecasts By Enterprise Size (2021-2032) (USD Billion)
11.2.9.3 Mexico Brand Protection Tools Market Estimates and Forecasts By Deployment (2021-2032) (USD Billion)
11.2.9.4 Mexico Brand Protection Tools Market Estimates and Forecasts By Application (2021-2032) (USD Billion)
11.3 Europe
11.3.1 Trend Analysis
11.3.2 Europe Brand Protection Tools Market Estimates and Forecasts by Country (2021-2032) (USD Billion)
11.3.3 Europe Brand Protection Tools Market Estimates and Forecasts By Software Type (2021-2032) (USD Billion)
11.3.4 Europe Brand Protection Tools Market Estimates and Forecasts By Enterprise Size (2021-2032) (USD Billion)
11.3.5 Europe Brand Protection Tools Market Estimates and Forecasts By Deployment (2021-2032) (USD Billion)
11.3.6 Europe Brand Protection Tools Market Estimates and Forecasts By Application (2021-2032) (USD Billion)
11.3.7 Germany
11.3.7.1 Germany Brand Protection Tools Market Estimates and Forecasts By Software Type (2021-2032) (USD Billion)
11.3.7.2 Germany Brand Protection Tools Market Estimates and Forecasts By Enterprise Size (2021-2032) (USD Billion)
11.3.7.3 Germany Brand Protection Tools Market Estimates and Forecasts By Deployment (2021-2032) (USD Billion)
11.3.7.4 Germany Brand Protection Tools Market Estimates and Forecasts By Application (2021-2032) (USD Billion)
11.3.8 France
11.3.8.1 France Brand Protection Tools Market Estimates and Forecasts By Software Type (2021-2032) (USD Billion)
11.3.8.2 France Brand Protection Tools Market Estimates and Forecasts By Enterprise Size (2021-2032) (USD Billion)
11.3.8.3 France Brand Protection Tools Market Estimates and Forecasts By Deployment (2021-2032) (USD Billion)
11.3.8.4 France Brand Protection Tools Market Estimates and Forecasts By Application (2021-2032) (USD Billion)
11.3.9 UK
11.3.9.1 UK Brand Protection Tools Market Estimates and Forecasts By Software Type (2021-2032) (USD Billion)
11.3.9.2 UK Brand Protection Tools Market Estimates and Forecasts By Enterprise Size (2021-2032) (USD Billion)
11.3.9.3 UK Brand Protection Tools Market Estimates and Forecasts By Deployment (2021-2032) (USD Billion)
11.3.9.4 UK Brand Protection Tools Market Estimates and Forecasts By Application (2021-2032) (USD Billion)
11.3.10 Italy
11.3.10.1 ItalyBrand Protection Tools Market Estimates and Forecasts By Software Type (2021-2032) (USD Billion)
11.3.10.2 Italy Brand Protection Tools Market Estimates and Forecasts By Enterprise Size (2021-2032) (USD Billion)
11.3.10.3 Italy Brand Protection Tools Market Estimates and Forecasts By Deployment (2021-2032) (USD Billion)
11.3.10.4 Italy Brand Protection Tools Market Estimates and Forecasts By Application (2021-2032) (USD Billion)
11.3.11 Spain
11.3.11.1 Spain Brand Protection Tools Market Estimates and Forecasts By Software Type (2021-2032) (USD Billion)
11.3.11.2 Spain Brand Protection Tools Market Estimates and Forecasts By Enterprise Size (2021-2032) (USD Billion)
11.3.11.3 Spain Brand Protection Tools Market Estimates and Forecasts By Deployment (2021-2032) (USD Billion)
11.3.11.4 Spain Brand Protection Tools Market Estimates and Forecasts By Application (2021-2032) (USD Billion)
11.3.12 Poland
11.3.12.1 Poland Brand Protection Tools Market Estimates and Forecasts By Software Type (2021-2032) (USD Billion)
11.3.12.2 Poland Brand Protection Tools Market Estimates and Forecasts By Enterprise Size (2021-2032) (USD Billion)
11.3.12.3 Poland Brand Protection Tools Market Estimates and Forecasts By Deployment (2021-2032) (USD Billion)
11.3.12.4 Poland Brand Protection Tools Market Estimates and Forecasts By Application (2021-2032) (USD Billion)
11.3.13 Turkey
11.3.13.1 Turkey Brand Protection Tools Market Estimates and Forecasts By Software Type (2021-2032) (USD Billion)
11.3.13.2 Turkey Brand Protection Tools Market Estimates and Forecasts By Enterprise Size (2021-2032) (USD Billion)
11.3.13.3 Turkey Brand Protection Tools Market Estimates and Forecasts By Deployment (2021-2032) (USD Billion)
11.3.13.4 Turkey Brand Protection Tools Market Estimates and Forecasts By Application (2021-2032) (USD Billion)
11.3.14 Rest of Europe
11.3.14.1 Rest of Europe Brand Protection Tools Market Estimates and Forecasts By Software Type (2021-2032) (USD Billion)
11.3.14.2 Rest of Europe Brand Protection Tools Market Estimates and Forecasts By Enterprise Size (2021-2032) (USD Billion)
11.3.14.3 Rest of Europe Brand Protection Tools Market Estimates and Forecasts By Deployment (2021-2032) (USD Billion)
11.3.14.4 Rest of Europe Brand Protection Tools Market Estimates and Forecasts By Application (2021-2032) (USD Billion)
11.4 Asia Pacific
11.4.1 Trend Analysis
11.4.2 Asia Pacific Brand Protection Tools Market Estimates and Forecasts by Country (2021-2032) (USD Billion)
11.4.3 Asia Pacific Brand Protection Tools Market Estimates and Forecasts By Software Type (2021-2032) (USD Billion)
11.4.4 Asia Pacific Brand Protection Tools Market Estimates and Forecasts By Enterprise Size (2021-2032) (USD Billion)
11.4.5 Asia Pacific Brand Protection Tools Market Estimates and Forecasts By Deployment (2021-2032) (USD Billion)
11.4.6 Asia Pacific Brand Protection Tools Market Estimates and Forecasts By Application (2021-2032) (USD Billion)
11.4.7 China
11.4.7.1 China Brand Protection Tools Market Estimates and Forecasts By Software Type (2021-2032) (USD Billion)
11.4.7.2 China Brand Protection Tools Market Estimates and Forecasts By Enterprise Size (2021-2032) (USD Billion)
11.4.7.3 China Brand Protection Tools Market Estimates and Forecasts By Deployment (2021-2032) (USD Billion)
11.4.7.4 China Brand Protection Tools Market Estimates and Forecasts By Application (2021-2032) (USD Billion)
11.4.8 India
11.4.8.1 India Brand Protection Tools Market Estimates and Forecasts By Software Type (2021-2032) (USD Billion)
11.4.8.2 India Brand Protection Tools Market Estimates and Forecasts By Enterprise Size (2021-2032) (USD Billion)
11.4.8.3 India Brand Protection Tools Market Estimates and Forecasts By Deployment (2021-2032) (USD Billion)
11.4.8.4 India Brand Protection Tools Market Estimates and Forecasts By Application (2021-2032) (USD Billion)
11.4.9 Japan
11.4.9.1 Japan Brand Protection Tools Market Estimates and Forecasts By Software Type (2021-2032) (USD Billion)
11.4.9.2 Japan Brand Protection Tools Market Estimates and Forecasts By Enterprise Size (2021-2032) (USD Billion)
11.4.9.3 Japan Brand Protection Tools Market Estimates and Forecasts By Deployment (2021-2032) (USD Billion)
11.4.9.4 Japan Brand Protection Tools Market Estimates and Forecasts By Application (2021-2032) (USD Billion)
11.4.10 South Korea
11.4.10.1 South Korea Brand Protection Tools Market Estimates and Forecasts By Software Type (2021-2032) (USD Billion)
11.4.10.2 South Korea Brand Protection Tools Market Estimates and Forecasts By Enterprise Size (2021-2032) (USD Billion)
11.4.10.3 South Korea Brand Protection Tools Market Estimates and Forecasts By Deployment (2021-2032) (USD Billion)
11.4.10.4 South Korea Brand Protection Tools Market Estimates and Forecasts By Application (2021-2032) (USD Billion)
11.4.11 Singapore
11.4.11.1 Singapore Brand Protection Tools Market Estimates and Forecasts By Software Type (2021-2032) (USD Billion)
11.4.11.2 Singapore Brand Protection Tools Market Estimates and Forecasts By Enterprise Size (2021-2032) (USD Billion)
11.4.11.3 Singapore Brand Protection Tools Market Estimates and Forecasts By Deployment (2021-2032) (USD Billion)
11.4.11.4 Singapore Brand Protection Tools Market Estimates and Forecasts By Application (2021-2032) (USD Billion)
11.4.12 Australia
11.4.12.1 Australia Brand Protection Tools Market Estimates and Forecasts By Software Type (2021-2032) (USD Billion)
11.4.12.2 Australia Brand Protection Tools Market Estimates and Forecasts By Enterprise Size (2021-2032) (USD Billion)
11.4.12.3 Australia Brand Protection Tools Market Estimates and Forecasts By Deployment (2021-2032) (USD Billion)
11.4.12.4 Australia Brand Protection Tools Market Estimates and Forecasts By Application (2021-2032) (USD Billion)
11.4.13 Rest of Asia Pacific
11.4.13.1 Rest of Asia Pacific Brand Protection Tools Market Estimates and Forecasts By Software Type (2021-2032) (USD Billion)
11.4.13.2 Rest of Asia Pacific Brand Protection Tools Market Estimates and Forecasts By Enterprise Size (2021-2032) (USD Billion)
11.4.13.3 Rest of Asia Pacific Brand Protection Tools Market Estimates and Forecasts By Deployment (2021-2032) (USD Billion)
11.4.13.4 Rest of Asia Pacific Brand Protection Tools Market Estimates and Forecasts By Application (2021-2032) (USD Billion)
11.5 Middle East and Africa
11.5.1 Trend Analysis
11.5.2 Middle East and Africa Brand Protection Tools Market Estimates and Forecasts by Country (2021-2032) (USD Billion)
11.5.3 Middle East and Africa Brand Protection Tools Market Estimates and Forecasts By Software Type (2021-2032) (USD Billion)
11.5.4 Middle East and Africa Brand Protection Tools Market Estimates and Forecasts By Enterprise Size (2021-2032) (USD Billion)
11.5.5 Middle East and Africa Brand Protection Tools Market Estimates and Forecasts By Deployment (2021-2032) (USD Billion)
11.5.6 Middle East and Africa Brand Protection Tools Market Estimates and Forecasts By Application (2021-2032) (USD Billion)
11.5.7 UAE
11.5.7.1 UAE Brand Protection Tools Market Estimates and Forecasts By Software Type (2021-2032) (USD Billion)
11.5.7.2 UAE Brand Protection Tools Market Estimates and Forecasts By Enterprise Size (2021-2032) (USD Billion)
11.5.7.3 UAE Brand Protection Tools Market Estimates and Forecasts By Deployment (2021-2032) (USD Billion)
11.5.7.4 UAE Brand Protection Tools Market Estimates and Forecasts By Application (2021-2032) (USD Billion)
11.5.8 Saudi Arabia
11.5.8.1 Saudi Arabia Brand Protection Tools Market Estimates and Forecasts By Software Type (2021-2032) (USD Billion)
11.5.8.2 Saudi Arabia Brand Protection Tools Market Estimates and Forecasts By Enterprise Size (2021-2032) (USD Billion)
11.5.8.3 Saudi Arabia Brand Protection Tools Market Estimates and Forecasts By Deployment (2021-2032) (USD Billion)
11.5.8.4 Saudi Arabia Brand Protection Tools Market Estimates and Forecasts By Application (2021-2032) (USD Billion)
11.5.9 Qatar
11.5.9.1 Qatar Brand Protection Tools Market Estimates and Forecasts By Software Type (2021-2032) (USD Billion)
11.5.9.2 Qatar Brand Protection Tools Market Estimates and Forecasts By Enterprise Size (2021-2032) (USD Billion)
11.5.9.3 Qatar Brand Protection Tools Market Estimates and Forecasts By Deployment (2021-2032) (USD Billion)
11.5.1.9.4 Qatar Brand Protection Tools Market Estimates and Forecasts By Application (2021-2032) (USD Billion)
11.5.10 South Africa
11.5.10.1 South Africa Brand Protection Tools Market Estimates and Forecasts By Software Type (2021-2032) (USD Billion)
11.5.10.2 South Africa Brand Protection Tools Market Estimates and Forecasts By Enterprise Size (2021-2032) (USD Billion)
11.5.10.3 South Africa Brand Protection Tools Market Estimates and Forecasts By Deployment (2021-2032) (USD Billion)
11.5.10.4 South Africa Brand Protection Tools Market Estimates and Forecasts By Application (2021-2032) (USD Billion)
11.5.11 Rest of Middle East & Africa
11.5.11.1 Rest of Middle East & Africa Brand Protection Tools Market Estimates and Forecasts By Software Type (2021-2032) (USD Billion)
11.5.11.2 Rest of Middle East & Africa Brand Protection Tools Market Estimates and Forecasts By Enterprise Size (2021-2032) (USD Billion)
11.5.11.3 Rest of Middle East & Africa Brand Protection Tools Market Estimates and Forecasts By Deployment (2021-2032) (USD Billion)
11.5.11.4 Rest of Middle East & Africa Brand Protection Tools Market Estimates and Forecasts By Application (2021-2032) (USD Billion)
11.6 Latin America
11.6.1 Trend Analysis
11.6.2 Latin America Brand Protection Tools Market Estimates and Forecasts by Country (2021-2032) (USD Billion)
11.6.3 Latin America Brand Protection Tools Market Estimates and Forecasts By Software Type (2021-2032) (USD Billion)
11.6.4 Latin America Brand Protection Tools Market Estimates and Forecasts By Enterprise Size (2021-2032) (USD Billion)
11.6.5 Latin America Brand Protection Tools Market Estimates and Forecasts By Deployment (2021-2032) (USD Billion)
11.6.6 Latin America Brand Protection Tools Market Estimates and Forecasts By Application (2021-2032) (USD Billion)
11.6.7 Brazil
11.6.7.1 Brazil Brand Protection Tools Market Estimates and Forecasts By Software Type (2021-2032) (USD Billion)
11.6.7.2 Brazil Brand Protection Tools Market Estimates and Forecasts By Enterprise Size (2021-2032) (USD Billion)
11.6.7.3 Brazil Brand Protection Tools Market Estimates and Forecasts By Deployment (2021-2032) (USD Billion)
11.6.7.4 Brazil Brand Protection Tools Market Estimates and Forecasts By Application (2021-2032) (USD Billion)
11.6.8 Argentina
11.6.8.1 Argentina Brand Protection Tools Market Estimates and Forecasts By Software Type (2021-2032) (USD Billion)
11.6.8.2 Argentina Brand Protection Tools Market Estimates and Forecasts By Enterprise Size (2021-2032) (USD Billion)
11.6.8.3 Argentina Brand Protection Tools Market Estimates and Forecasts By Deployment (2021-2032) (USD Billion)
11.6.8.4 Argentina Brand Protection Tools Market Estimates and Forecasts By Application (2021-2032) (USD Billion)
11.6.9 Rest of Latin America
11.6.9.1 Rest of Latin America Brand Protection Tools Market Estimates and Forecasts By Software Type (2021-2032) (USD Billion)
11.6.9.2 Rest of Latin America Brand Protection Tools Market Estimates and Forecasts By Enterprise Size (2021-2032) (USD Billion)
11.6.9.3 Rest of Latin America Brand Protection Tools Market Estimates and Forecasts By Deployment (2021-2032) (USD Billion)
11.6.9.4 Rest of Latin America Brand Protection Tools Market Estimates and Forecasts By Application (2021-2032) (USD Billion)
12. Company Profiles
12.1 Red Points
12.1.1 Company Overview
12.1.2 Financial
12.1.3 Products/ Services Offered
12.1.4 SWOT Analysis
12.2 BrandShield
12.2.1 Company Overview
12.2.2 Financial
12.2.3 Products/ Services Offered
12.2.4 SWOT Analysis
12.3 Corsearch
12.3.1 Company Overview
12.3.2 Financial
12.3.3 Products/ Services Offered
12.3.4 SWOT Analysis
12.4 MarkMonitor
12.4.1 Company Overview
12.4.2 Financial
12.4.3 Products/ Services Offered
12.4.4 SWOT Analysis
12.5 Counterfind
12.5.1 Company Overview
12.5.2 Financial
12.5.3 Products/ Services Offered
12.5.4 SWOT Analysis
12.6 OpSec Security
12.6.1 Company Overview
12.6.2 Financial
12.6.3 Products/ Services Offered
12.6.4 SWOT Analysis
12.7 NetNames
12.7.1 Company Overview
12.7.2 Financial
12.7.3 Products/ Services Offered
12.7.4 SWOT Analysis
12.8 Sprockets
12.8.1 Company Overview
12.8.2 Financial
12.8.3 Products/ Services Offered
12.8.4 SWOT Analysis
12.9 Incopro
12.9.1 Company Overview
12.9.2 Financial
12.9.3 Products/ Services Offered
12.9.4 SWOT Analysis
12.10 Cimpress
12.10.1 Company Overview
12.10.2 Financial
12.10.3 Products/ Services Offered
12.10.4 SWOT Analysis
13. Use Cases and Best Practices
14. Conclusion
An accurate research report requires proper strategizing as well as implementation. There are multiple factors involved in the completion of good and accurate research report and selecting the best methodology to compete the research is the toughest part. Since the research reports we provide play a crucial role in any company’s decision-making process, therefore we at SNS Insider always believe that we should choose the best method which gives us results closer to reality. This allows us to reach at a stage wherein we can provide our clients best and accurate investment to output ratio.
Each report that we prepare takes a timeframe of 350-400 business hours for production. Starting from the selection of titles through a couple of in-depth brain storming session to the final QC process before uploading our titles on our website we dedicate around 350 working hours. The titles are selected based on their current market cap and the foreseen CAGR and growth.
The 5 steps process:
Step 1: Secondary Research:
Secondary Research or Desk Research is as the name suggests is a research process wherein, we collect data through the readily available information. In this process we use various paid and unpaid databases which our team has access to and gather data through the same. This includes examining of listed companies’ annual reports, Journals, SEC filling etc. Apart from this our team has access to various associations across the globe across different industries. Lastly, we have exchange relationships with various university as well as individual libraries.
Step 2: Primary Research
When we talk about primary research, it is a type of study in which the researchers collect relevant data samples directly, rather than relying on previously collected data. This type of research is focused on gaining content specific facts that can be sued to solve specific problems. Since the collected data is fresh and first hand therefore it makes the study more accurate and genuine.
We at SNS Insider have divided Primary Research into 2 parts.
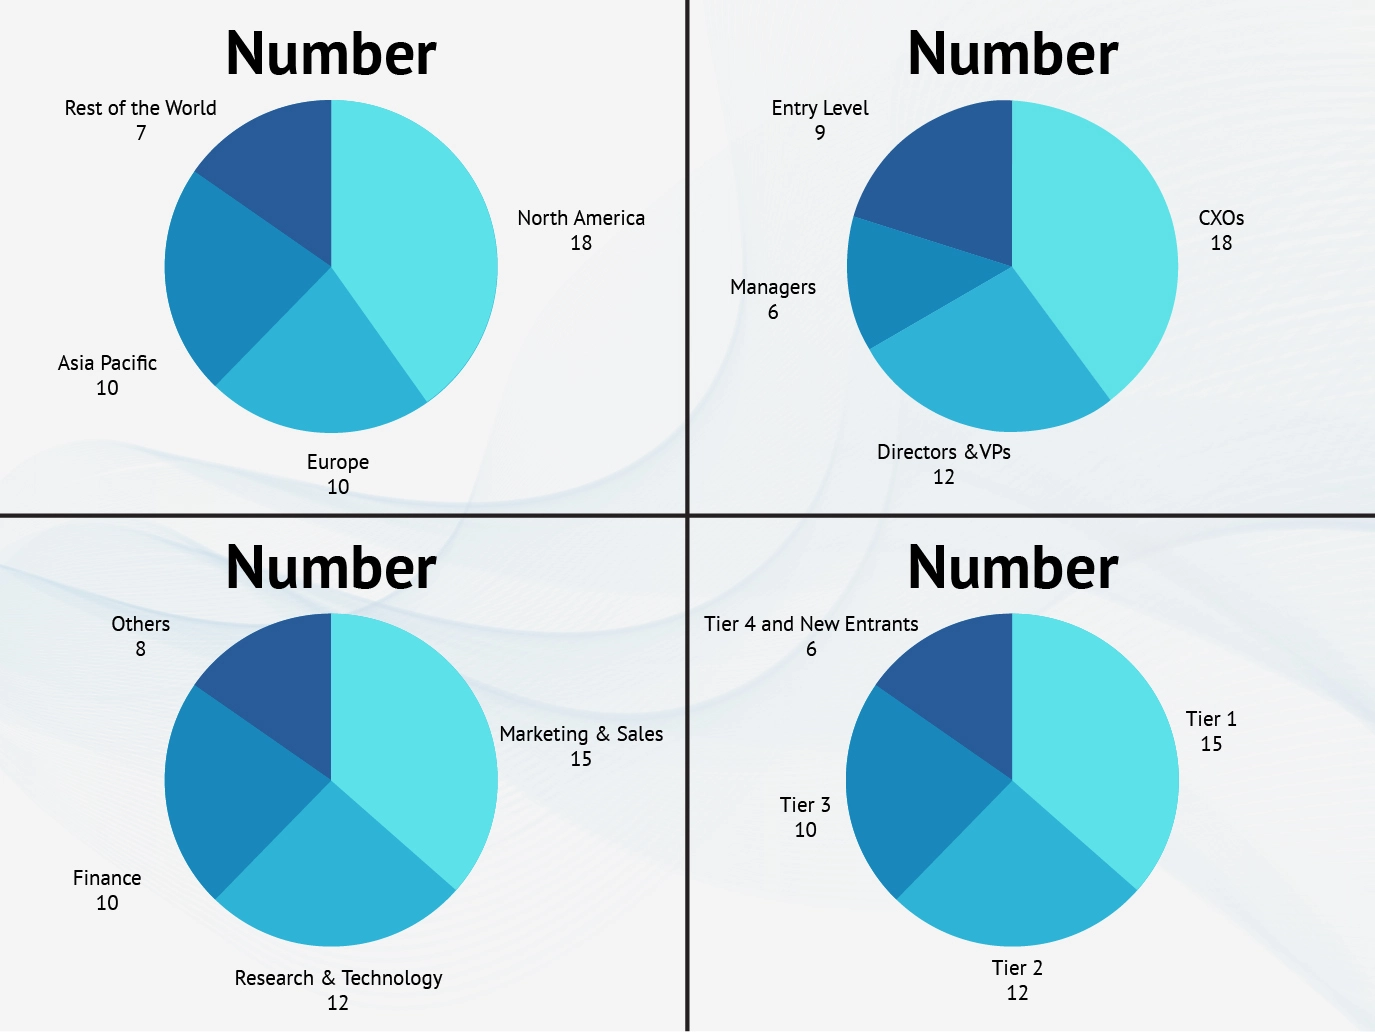
Part 1 wherein we interview the KOLs of major players as well as the upcoming ones across various geographic regions. This allows us to have their view over the market scenario and acts as an important tool to come closer to the accurate market numbers. As many as 45 paid and unpaid primary interviews are taken from both the demand and supply side of the industry to make sure we land at an accurate judgement and analysis of the market.
This step involves the triangulation of data wherein our team analyses the interview transcripts, online survey responses and observation of on filed participants. The below mentioned chart should give a better understanding of the part 1 of the primary interview.
Part 2: In this part of primary research the data collected via secondary research and the part 1 of the primary research is validated with the interviews from individual consultants and subject matter experts.
Consultants are those set of people who have at least 12 years of experience and expertise within the industry whereas Subject Matter Experts are those with at least 15 years of experience behind their back within the same space. The data with the help of two main processes i.e., FGDs (Focused Group Discussions) and IDs (Individual Discussions). This gives us a 3rd party nonbiased primary view of the market scenario making it a more dependable one while collation of the data pointers.
Step 3: Data Bank Validation
Once all the information is collected via primary and secondary sources, we run that information for data validation. At our intelligence centre our research heads track a lot of information related to the market which includes the quarterly reports, the daily stock prices, and other relevant information. Our data bank server gets updated every fortnight and that is how the information which we collected using our primary and secondary information is revalidated in real time.

Step 4: QA/QC Process
After all the data collection and validation our team does a final level of quality check and quality assurance to get rid of any unwanted or undesired mistakes. This might include but not limited to getting rid of the any typos, duplication of numbers or missing of any important information. The people involved in this process include technical content writers, research heads and graphics people. Once this process is completed the title gets uploader on our platform for our clients to read it.
Step 5: Final QC/QA Process:
This is the last process and comes when the client has ordered the study. In this process a final QA/QC is done before the study is emailed to the client. Since we believe in giving our clients a good experience of our research studies, therefore, to make sure that we do not lack at our end in any way humanly possible we do a final round of quality check and then dispatch the study to the client.
Key Segments:
By Software Type
Digital Rights Management Tools
Anti-Counterfeiting Solutions
Trademark Monitoring and Enforcement Tools
Domain Monitoring and Protection Tools
Social Media Monitoring and Brand Reputation Management Tools
Online Brand Enforcement Tools
Intellectual Property Protection Tools
Others
By Deployment
Cloud Based
On-Premises
By Enterprise Size
Large Enterprises
Small and Medium Enterprises (SMEs)
By Application
Consumer Goods and Retail
Pharmaceuticals and Healthcare
Electronics and Electrical
Automotive
Luxury Goods
Media and Entertainment
Software and Technology
Others
Request for Segment Customization as per your Business Requirement: Segment Customization Request
Regional Coverage:
North America
US
Canada
Mexico
Europe
Germany
France
UK
Italy
Spain
Poland
Turkey
Rest of Europe
Asia Pacific
China
India
Japan
South Korea
Singapore
Australia
Rest of Asia Pacific
Middle East & Africa
UAE
Saudi Arabia
Qatar
South Africa
Rest of Middle East & Africa
Latin America
Brazil
Argentina
Rest of Latin America
Request for Country Level Research Report: Country Level Customization Request
Available Customization
With the given market data, SNS Insider offers customization as per the company’s specific needs. The following customization options are available for the report:
Detailed Volume Analysis
Criss-Cross segment analysis (e.g. Product X Application)
Competitive Product Benchmarking
Geographic Analysis
Additional countries in any of the regions
Customized Data Representation
Detailed analysis and profiling of additional market players