Internet of Everything Market Report Scope & Overview:
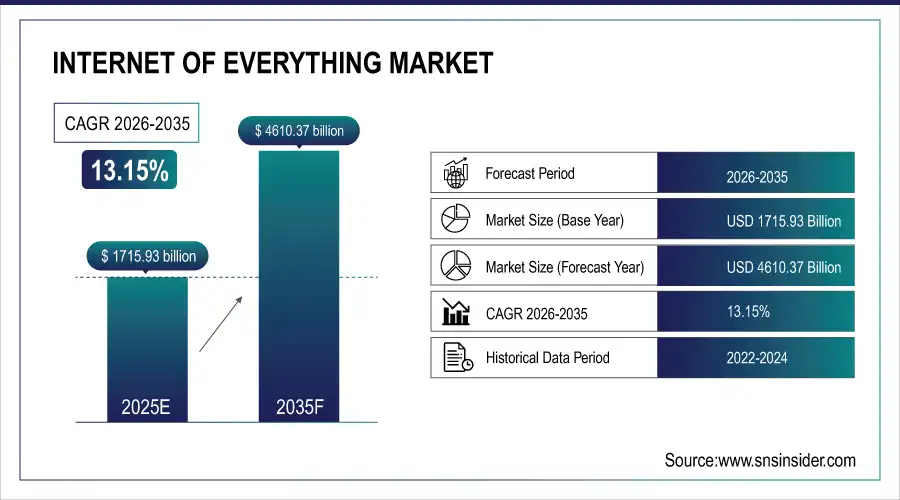
Internet of Everything Market size was valued at USD 1715.93 billion in 2025 and is expected to reach USD 4610.37 billion by 2035, growing at a CAGR of 13.15% during 2026-2035.
In 2025, the Internet of Everything (IoE) market is booming, driven by accelerated digital transformation and massive adoption of interconnected technologies. According to Research, the number of connected IoT devices globally is projected to reach 18.8 billion by the end of 2024, marking a 13% year-over-year increase. This surge demonstrates the growing integration of IoE solutions across industries such as manufacturing, healthcare, and smart cities, where real-time data exchange and automation are becoming essential. Furthermore, 51% of organizations using IoT technology will also up their IoT budgets next year, which speaks volumes about the level of confidence and investments in the IoT ecosystem from businesses. These trends highlight the importance of the IoE market to drive operational excellence and unleash digital innovation at scale in the world.
Market Size and Forecast: 2025
-
Market Size in 2025 USD 1715.93 Billion
-
Market Size by 2035 USD 4610.37 Billion
-
CAGR of 13.15% From 2026 to 2035
-
Base Year 2025
-
Forecast Period 2026-2035
-
Historical Data 2022-2024
To Get more information On Internet of Everything Market - Request Free Sample Report
Internet of Everything Market Trends:
• Rapid expansion of connected devices and sensors is accelerating real-time data generation across industries.
• Integration of AI and machine learning with IoE platforms is enabling predictive analytics and autonomous decision-making.
• 5G network deployment is enhancing low-latency, high-speed connectivity for mission-critical IoE applications.
• Smart city initiatives are driving large-scale adoption of connected infrastructure for mobility, energy, and public services.
• Growing industrial and healthcare adoption is boosting demand for automation, remote monitoring, and intelligent operations.
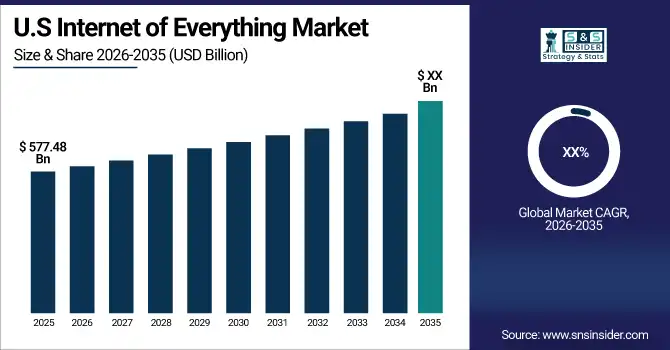
The U.S. Internet of Everything (IoE) market is projected to reach a valuation of USD 577.48 billion by 2025, underscoring the nation's leadership in digital transformation and connected technologies. The rapid adoption of automation, analytics, and smart sensors, particularly across manufacturing, logistics, and related sectors is fueling this robust market growth. A record 44,303 industrial robots were installed by the U.S. companies in 2023 alone, marking a 12% increase over the previous year and highlighting the rising focus on automation and operational efficiency. Manufacturing remains a key sector, leveraging IoE-driven IoT solutions for real-time data collection, predictive maintenance, and supply chain optimization. Additionally, the broader rollout of 5G connectivity and an increasing focus on cybersecurity are accelerating IoE implementation. Continuous enterprise investment and technological innovation are expected to sustain the U.S.'s dominance in the global IoE market.
Internet of Everything Market Growth Drivers:
• Explosive Device Growth, 5G Rollout, and AI-Driven Automation Fuel Global IoE Market Expansion
For instance, by 2025, the total number of IoT devices will exceed 18.8 billion globally, which illustrates the boom in devices penetration and instant link. Governments are using this too, with countries, such as Germany, India, and Brazil, making high investments into smart city projects, public transport upgrades, and digital infrastructure increasing citizen services and efficiency when it comes to their operations. Cloud computing affordability, access to the Internet, and falling sensor and processor prices are enabling solutions for IoE in every industry. This, combined with fast progress in artificial intelligence, machine learning, and 5G networks, is making it possible and practical for real-time data analytics and automation, driving more rapid adoption across industries including manufacturing, healthcare, and transportation. The need for continuous connectivity, smarter automation, and data-backed decision making are fuelling strong global Internet of Everything market growth.
Internet of Everything Market Restraints:
• High Cost of Adoption Remains a Major Barrier to Widespread IoE Implementation
Upgrading devices and accessing premium data services are still prohibitively expensive in many regions. For instance, India’s 5G rollout is expected to cost approximately USD 75 billion making it the most expensive among 15 emerging economies.
As billions of IoE devices come online, the cybersecurity threat landscape is rapidly expanding. Concerns over data breaches, ransomware attacks, and botnet infiltration are growing. Many IoE devices lack robust security, often relying on default passwords, weak authentication protocols, and infrequent software updates, making them highly vulnerable to exploitation. Additionally, the integration of IoE systems is hampered by challenges, such as lack of interoperability, inconsistent regulations across countries, and a shortage of technical expertise, particularly in developing markets. These issues, coupled with low awareness, significantly slow down adoption rates in emerging economies.
Internet of Everything Market Opportunities:
• Vast Opportunities across Industries through Advanced Connectivity, Real-Time Analytics, and Automation
The near-term prospects for IoE look bright as technologies, such as artificial intelligence, machine learning, and 5G networks become more widely adopted, enabling operational and decision-making intelligence. One area where smart city initiatives offer a significant opportunity is, governments are spending millions on smart cities for interconnecting infrastructure for mobility, energy, and more including public safety globally.
Industrial IoT adoption is improving automation, predictive maintenance, and supply chain efficiency in manufacturing, and the healthcare sector is using IoE for remote monitoring and smart hospitals. Globally, more than 53,000 companies and 3 million employees are now working on IoT and IoE innovation, supported by a growing ecosystem with greater than 82,000 patents. Combined with robust investment inflows and the rising wave of public-red-private partnerships to reinvigorate the economy, these opportunities are fueled and create the foundation of a hyper-connected, and intelligent tomorrow.
Internet of Everything Market Segment Analysis:
By Component
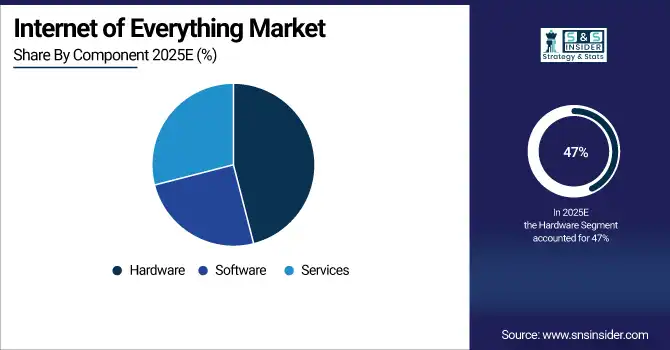
In 2025, Hardware segment continues to lead with more than 47% Internet of Everything market share. The necessity of Sensors, Actuators, Gateways and Embedded System which connects to various devices and collects, broadcast, actuates the data drives this leadership. The availability of cheap energy-efficient hardware components has paved a path for the large-scale system implementation in the domains of manufacturing, transportation, and smart city. The need for high-quality, scalable hardware solutions keeps growing as businesses upgrade old infrastructure. Meanwhile, the services segment, especially the managed and consulting services sub-segment is expected to grow at the highest CAGR of 19.5% over 2026-2035. While the IoE provides the next best opportunity for growth, IoE ecosystems are terribly complex, and as a result, no business wants to do this without expert guidance for integration, security, and maintenance, which will require ongoing management, further suggesting a shift to seamless implementation and optimizing the lifecycle of solutions.
By Network Technology
Wi-Fi holds the dominant position among network technologies in the IoE market, capturing the largest share of IoT connections in 2025 due to its widespread availability, cost-effectiveness, and compatibility with a broad range of consumer and enterprise devices. Its role is especially prominent in smart homes, healthcare, and industrial environments where high-bandwidth, short-range connectivity is essential. The adoption of advanced Wi-Fi standards further enhances performance and device density. Cellular technologies-especially 5G-and LPWAN (LoRa and NB-IoT) are the fastest-growing segments, and are projected to expand at a CAGR of 15% through 2035. The rollout of 5G is revolutionizing IoE by enabling ultra-low latency, high-speed connectivity, and massive device density, supporting real-time applications including autonomous vehicles and smart grids.
By End-User
In 2025, smart cities will be the largest end-user segment in the IoE market as the highest proportion is expected to be devoted to IoE deployments globally. The alternative providers also benefit from government initiatives and public-private partnerships that aim to enhance urban living standards, sustainability, and resource use. From IoE-enabled traffic management, smart lighting, waste management to public safety, cities around the world are buying the concept. The fastest-growing end-user categories are connected cars and wearables, with healthcare wearables expected to grow at a whopping 18.2% CAGR. Advancements in remote patient monitoring, real time health information, the evolution of autonomous mobility solutions, amongst others are all contributing to this exponential growth.
By Industry Vertical
Manufacturing continues to dominate the industry verticals, capturing over 25% market share in 2025, driven by investments in IoE-enabled automation, predictive maintenance, and supply chain optimization, which deliver significant productivity and efficiency gains. Manufacturers are deploying IoE solutions to monitor equipment health, track inventory, and ensure workplace safety. Healthcare is the fastest-growing vertical, expected to expand rapidly due to the adoption of remote patient monitoring, telemedicine, and smart diagnostics, reflecting its critical role in digital transformation and patient-centric care.
Internet of Everything Market Regional Analysis:
North America Internet of Everything Market Insights
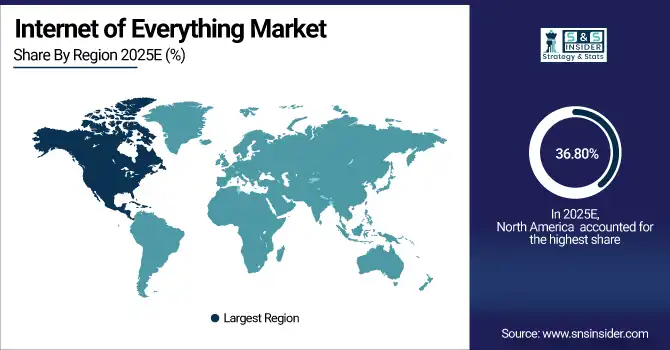
The Internet of Everything (IoE) market is dominated by North America capturing 36.80% market share with deep penetration of IoT devices, advanced digital infrastructure, and strong investments in R&D by both public and private sector.
Get Customized Report as per Your Business Requirement - Enquiry Now
The U.S. dominated the North America region with initiatives, such as the U.S. National Science Foundation (NSF) PAWR program, which has already injected more than USD 100 million into city-scale wireless testbeds. With emphasis on 5G, timely on-boarding of AI and edge computing, and overall sound security responses, North America will continue its leadership and evolution in the IoE space.
Europe Internet of Everything Market Insights
Europe is a large IoE market due to the support of smart city programs, regulations and firm adoption in manufacturing and health care will drive it. According to its report, in 2023, Europe alone features 3.48 billion connected IoT devices, a number forecasted to reach 6.56 billion by 2030, almost a doubling of the figure in only seven years. Horizon Europe program (2021–2027) with a budget of €95.5 billion and a commitment to digital innovation is suitable for that as well. With over 300 cities in Europe opening smart city frameworks, Eurostat highlights that 60% of health care infrastructure has smart technology with IoT for monitoring and diagnostics of patients. At the same time, AI adoption is on the rise, with 13.5% of EU enterprises reported to have used AI in 2024 compared to 8.0% in 2023. The joint approach and the regulatory aspect of Europe keep pushing for Europe to be one of the key regions in the global IoE market.
Asia Pacific Internet of Everything Market Insights
Asia Pacific is expected to grow the fastest during the forecast period, driven by fast urbanization, digital initiatives by governments, and aggressive investments in 5G and smart infrastructure. GSMA estimates that licensed cellular IoT connections could nearly double from 2023 to 2030, hitting 270 million with almost 40% of them in Japan. On the one hand, the two poles of power driving this growth are China and its New Infrastructure Initiative and India with its Digital India program, while on the other the Southeast Asian region will experience an increase of 197.14% of connected IoT devices from 2023 to 2030. = LPWAN and 5G continues to drive new use cases for energy, utilities and industrial automation, making the the future of the IoE business in Asia Pacific.
Internet of Everything Market Key Players:
Some of the major Internet of Everything Companies are
- Fujitsu Limited
- Google Inc.
- Microsoft Corporation
- International Business Machines Corporation
- Amazon Web Services Inc.
- SAP SE
- Cisco Systems, Inc.
- AT&T Intellectual Property
- Hewlett-Packard Enterprise
- Bosch Software Innovations GmbH
Recent Developments:
Telit Cinterion, a global leader in IoT and machine-to-machine (M2M) solutions, provides cellular modules, connectivity platforms, and IoT services that enable seamless device integration and real-time data exchange. Its offerings support smart cities, industrial automation, healthcare, and connected mobility, driving growth in the Internet of Everything (IoE) ecosystem.
• In January 2025, Telit Cinterion expanded its deviceWISE AI Visual Inspection platform by integrating NVIDIA AI Enterprise tools, including NVIDIA NIM microservices and CUDA, to empower manufacturers and industrial IoT users with advanced AI-driven analytics and natural language capabilities. This integration enables users to leverage AI for tasks, such as defect detection and process optimization without requiring coding or data science expertise, supporting industries including automotive, pharmaceuticals, and energy.
Soracom is a leading provider of IoT connectivity and cloud-native platform services, enabling secure, scalable, and cost-effective device management. Its solutions support real-time data transfer, analytics, and automation across industries such as smart cities, manufacturing, healthcare, and transportation, playing a key role in the expansion of the Internet of Everything (IoE) market.
• In July 2024, Soracom launched two new GenAI-embedded IoT connectivity platform services: Soracom Flux, a low-code application builder for real-time AI-integrated IoT applications, and Soracom Query Intelligence, which enables natural-language network data analysis for large IoT deployments. These tools are designed to accelerate IoT project deployment and simplify management, making advanced AI capabilities accessible even to non-technical users.
| Report Attributes | Details |
|---|---|
| Market Size in 2025 | USD 1715.93 Billion |
| Market Size by 2035 | USD 4610.37 Billion |
| CAGR | CAGR of 13.15% From 2026 to 2035 |
| Base Year | 2025 |
| Forecast Period | 2026-2035 |
| Historical Data | 2022-2024 |
| Report Scope & Coverage | Market Size, Segments Analysis, Competitive Landscape, Regional Analysis, DROC & SWOT Analysis, Forecast Outlook |
| Key Segments | • By Component (Hardware [Sensors, Devices, and Networking Equipment], Software [Data Management, Security Software, and Network Management], and Services [Professional Services, Managed Services, and Support & Maintenance]) • By Network Technology (Wi-Fi, Bluetooth, ZigBee, Cellular, Ethernet, NFC, and LPWAN [LoRa, NB-IoT]) • By End-User (Smart Homes, Wearables, Connected Cars, Smart Buildings, Office Automation, Digital Signage, Smart Cities, Defense, and Public Safety) • By Industry Vertical (Manufacturing, Healthcare, Retail, Transportation & Logistics, Energy & Utilities, Agriculture, BFSI, and IT & Telecom) |
| Regional Analysis/Coverage | North America (US, Canada), Europe (Germany, UK, France, Italy, Spain, Russia, Poland, Rest of Europe), Asia Pacific (China, India, Japan, South Korea, Australia, ASEAN Countries, Rest of Asia Pacific), Middle East & Africa (UAE, Saudi Arabia, Qatar, South Africa, Rest of Middle East & Africa), Latin America (Brazil, Argentina, Mexico, Colombia, Rest of Latin America). |
| Company Profiles | Fujitsu Limited, Google Inc., Microsoft Corporation, International Business Machines Corporation, Amazon Web Services Inc., Sap, Cisco Systems, Inc., At&T Intellectual Property, Hewlett-Packard Enterprise, Bosch Software Innovations Gmbh |
Get in Touch
