image

Card Random Number Generator Market Size, Share & Segmentation By Type (Hardware RNG, Software RNG) Application (Gaming, Lottery, Cryptography, Simulation, Others) End-User (Casinos, Online Gaming Platforms, Financial Institutions, Research Institutions, Others), and Region | Global Forecast 2025-2032

Date: June 2025 Report Code: SNS/ICT/7670 Page 300

Card Random Number Generator Market Report Scope & Overview:

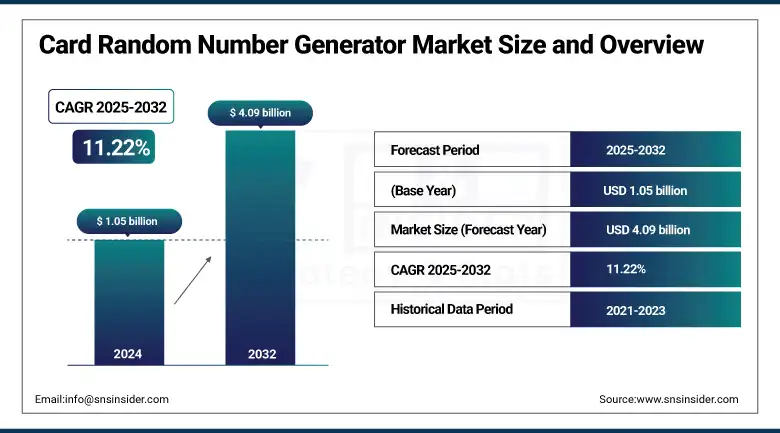
The Card Random Number Generator Market size was valued at USD 1.05 billion in 2024 and is expected to reach USD 4.09 billion by 2032, expanding at a CAGR of 11.22% over the forecast period of 2025-2032.

The Card RNG Market has been gradually rising, given the demand for secure and unbiased random number generation, especially in online gaming, cryptography, and simulations. Hardware RNGs are secure, but software RNGs are flexible and easy to integrate. Market usage is mainly in the gaming sector, led by global casinos and lottery systems, as well as financial institutions and research organizations centered on secure data processing. North America is prominent in the market, owing to mature technology and legislation, while Asia Pacific is the fastest-growing region. The rise of digital transactions combined with the same old concerns about cybersecurity is expected to drive more adoption of RNG, enabled by advancements in both AI and quantum RNG technologies.

According to research, RNG-certified platforms report a 37% reduction in player disputes due to fairer game outcomes, while over 72% of fintech encryption systems in 2024 relied on hardware RNGs, boosting cryptographic strength by 40% compared to pseudo-random alternatives.

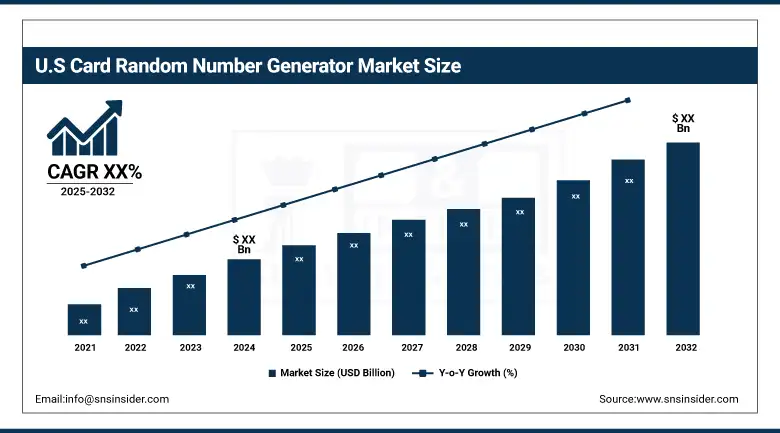
The U.S Card Random Number Generator Market size reached USD XX billion in 2024 and is expected to reach USD XX billion in 2032 at a CAGR of XX% from 2025 to 2032.

The U.S. dominates the Card Random Number Generator (RNG) Market, because it has a very sophisticated technological structure and is a major center for key RNG solution providers, not to mention that both gaming and financial sectors are also well-established in the region, which highly depend on secure number generation systems. Meeting Market Needs The call for digital gaming platforms, the regulation slice of online gambling and growing fears of cybersecurity in finance are the fundamental drivers for growth across the marketplace. Companies in the U.S. have always led the world when it comes to hardware and software innovations in RNG, and continued advances in areas such as artificial intelligence (AI), cryptographic security, and quantum computing will further fuel this space.

Market Dynamics

Drivers:

  • Increasing Adoption of RNGs in Cryptography and Digital Transactions Drives Industry Expansion Globally.

With the increasing demand for strong encryption in financial services, e-commerce, and blockchain technologies, demand for card-based RNGs is expected to drive market growth. It guarantees the secure generation of keys and their authentication in a digital environment. For example, the U.S. and European financial sectors is now utilizing hardware RNGs to increase security and reduce data breaches. For example, in 2024, Infineon and Microchip Technology commercialized RNG integration into secure microcontrollers to fulfill cryptographic standards like FIPS 140-3.

  • Over 80% of the top 50 global fintech companies had adopted hardware RNGs in transaction encryption, up from just 55% in 2021.

  • Financial institutions that deployed hardware RNGs reported a 38% reduction in successful cyberattacks on encrypted data in 2023.

Restraints:

  • High Implementation Costs and Limited Awareness in Emerging Markets Hinder Widespread Technology Deployment.

Despite their growing significance in cybersecurity and gaming, card RNG solutions remain underutilized in several developing regions. High costs associated with secure hardware modules and limited technical expertise are barriers to adoption. Small and mid-sized enterprises often opt for less secure software-based alternatives. Additionally, awareness regarding the role of RNGs in securing digital assets is relatively low outside mature economies. Without broader education and cost-efficient offerings, market penetration in regions like Africa and parts of Southeast Asia remains limited.

Opportunities:

  • Rising Integration of RNGs in Quantum-Resistant Encryption Offers Significant Growth Potential for Technology Vendors.

As concerns about quantum computing’s ability to break current encryption systems grow, demand for quantum-resistant security is surging. This has led to the increasing adoption of high-quality RNGs as core components in next-generation cryptographic protocols. In 2025, Rambus and ID Quantique introduced RNG-enabled solutions designed to meet post-quantum cryptographic standards. Enterprises and governments are now prioritizing RNG infrastructure that aligns with emerging NIST guidelines for post-quantum cryptography.

Challenges:

  • Difficulty in Validating True Randomness and Ensuring Regulatory Compliance Challenges Market Expansion Efforts.

One of the core challenges facing the RNG industry is validating the authenticity of “true” randomness, especially in hardware solutions. Regulatory bodies demand compliance with stringent standards like NIST SP 800-90B, FIPS 140-3, and ISO/IEC 18031. Ensuring compliance while maintaining performance and low latency is complex and resource-intensive. Additionally, improper implementation of entropy sources or poorly validated algorithms can introduce vulnerabilities. The lack of uniform global standards also creates confusion among developers and delays certification processes.

Segment Analysis

By Application

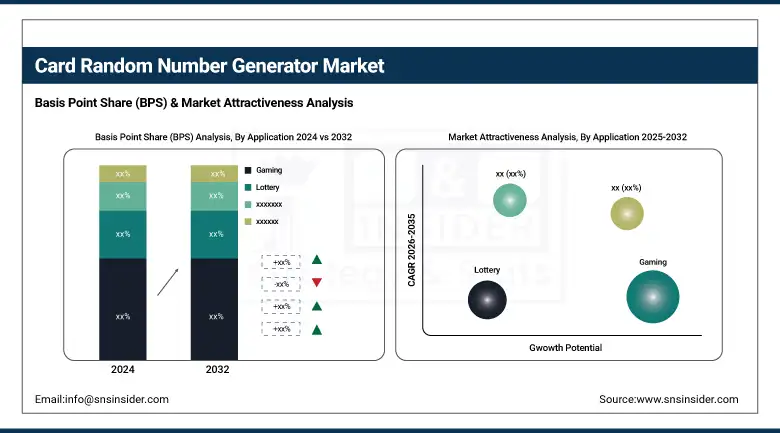
The gaming segment led with 12.22% revenue share in 2024, driven by demand for fairness and unpredictability in digital card-based games. Companies like Light & Wonder and Playtech integrated certified RNG engines to enhance trust in online poker and slot games. Regulatory compliance, immersive experiences, and anti-cheating mechanisms are major drivers. RNG technology ensures fair draws, making it indispensable in digital gaming environments within the Card RNG Market.

The influencer management segment is rapidly expanding with a projected CAGR of 23.84%, as brands and creators adopt gamified campaigns. RNG is used for random winner selection, loyalty draws, and contest mechanisms. Platforms like Upfluence and CreatorIQ are launching plugins that integrate secure randomization for engagement transparency. The rise of social commerce, demand for unbiased reward distribution, and content gamification are driving RNG adoption in influencer ecosystems.

By Type

Hardware RNG dominated the market with 64.72% revenue share in 2024, owing to its true randomness and physical entropy sources ideal for secure systems. Firms like ID Quantique and Microchip Technology released advanced quantum RNG chips embedded in secure modules. Key drivers include increased cybersecurity concerns, regulatory standards, and usage in high-stakes card gaming systems. Hardware RNG ensures unmanipulated outcomes, essential in regulated and cryptographic card-based operations.

Software RNG is projected to grow at a CAGR of 12.03%, driven by its cost-effectiveness, integration ease, and flexibility. Cloud-based platforms like Random.org and Google’s RNG API have been enhancing APIs for gaming, education, and promotional use. Mobile-first applications and digital marketing tools are major adopters. Drivers include rapid deployment, demand from SMEs, and the need for scalable, software-based randomness in the Card RNG Market.

By End User

Financial institutions held the highest share at 30.37% in 2024, using RNGs for encryption, PIN generation, and secure authentication. Vendors like Thales, Entrust, and Utimaco launched RNG-enabled HSMs to support banking-grade security. Drivers include growing fraud, zero-trust frameworks, and regulatory compliance like FIPS 140-3. In the Card RNG Market, RNGs are vital for generating cryptographic keys and ensuring non-deterministic operations in financial systems.

Online gaming platforms are growing fastest with a CAGR of 12.27%, fueled by demand for secure, fair gameplay. Platforms like DraftKings and Stake.com integrate third-party RNGs for verified card shuffling and draw mechanics. Drivers include rising mobile gaming, global betting legalization, and transparency requirements. RNGs form the backbone of online card games, ensuring integrity and randomness that meet gaming authority regulations globally.

Regional Analysis

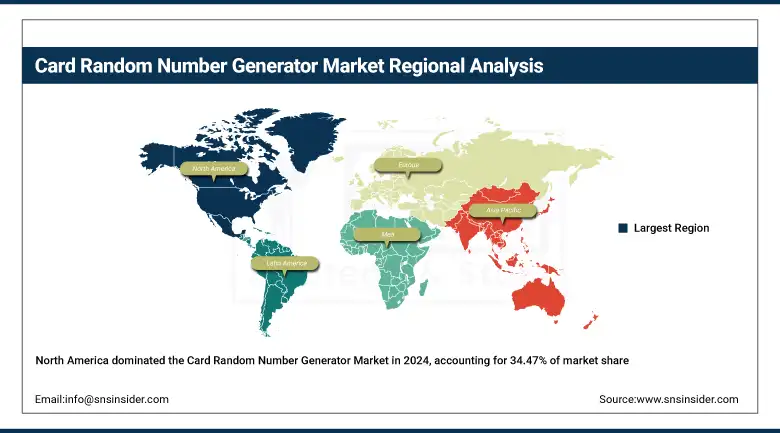
North America dominated the global Non-Terrestrial Network Market, accounting for approximately 34.47% of the total market revenue. The region’s leadership is driven by major satellite deployments, advanced 5G integration trials, and robust public-private partnerships. Companies like SpaceX and AST SpaceMobile have expanded satellite-based broadband and mobile connectivity, benefiting from the region’s mature telecom and aerospace ecosystems. The United States leads North America due to its substantial investment in LEO satellite constellations, government-led space programs, and active private-sector participation in global NTN infrastructure.

Europe contributed a significant portion to the market in 2024, backed by government initiatives and regulatory frameworks supporting satellite communication and 5G backhaul solutions. With a focus on bridging connectivity gaps in remote and maritime zones, European nations are collaborating on space and digital strategies through the European Space Agency and national efforts. Germany emerged as the dominant country in Europe, driven by its advanced aerospace R&D, investment in industrial digitalization, and leadership in cross-border NTN pilot programs.

Asia Pacific represented the fastest-growing region in the Non-Terrestrial Network Market in 2024, with a remarkable market share of 30.61%. Rapid urbanization, high mobile penetration, and the need for rural internet access have spurred satellite deployment and innovation across China, India, and Japan. China holds the leading position in Asia Pacific due to state-funded satellite networks, its Belt and Road digital expansion, and a robust national policy pushing NTN integration across public infrastructure and defense. 

The Middle East & Africa and Latin America regions demonstrated steady adoption of non-terrestrial network solutions, focusing on bridging connectivity gaps in remote and underserved areas. The UAE led MEA with strategic satellite initiatives like Thuraya, while Brazil dominated Latin America through national satellite programs and global partnerships aimed at expanding rural broadband and digital services.

Key Players

The major key players of the Card Random Number Generator Market are Microchip Technology Inc., Texas Instruments Incorporated, NXP Semiconductors, STMicroelectronics, Analog Devices, Inc., Infineon Technologies AG, Renesas Electronics Corporation, ON Semiconductor, Qualcomm Technologies, Inc., Intel Corporation, and others.

Key Developments

  • In November 2024, Infineon Technologies partnered with Quantinuum to enhance encryption through Quantum Random Number Generators (QRNGs), strengthening cryptographic security in financial and identity-based applications and advancing secure data solutions within quantum computing frameworks.

  • In May 2025, Elmos Semiconductor and ID Quantique launched a compact 2×2 mm quantum RNG chip featuring in-chip photoemission, designed to deliver enhanced entropy for secure communications across automotive, IoT, and other high-security application environments.

Card Random Number Generator Market Report Scope:

Report Attributes Details
Market Size in 2024 USD 12.96 Billion 
Market Size by 2032 USD 35.84 Billion 
CAGR CAGR of 13.56% From 2025 to 2032
Base Year 2024
Forecast Period 2025-2032
Historical Data 2021-2023
Report Scope & Coverage Market Size, Segments Analysis, Competitive Landscape, Regional Analysis, DROC & SWOT Analysis, Forecast Outlook
Key Segments •By Component (Software, Services)
•By Application (Healthcare, Automotive, Retail, Security and Surveillance, Manufacturing, Others)
•By Deployment Mode (On-Premises, Cloud)
•By Enterprise Size (Small and Medium Enterprises, Large Enterprises)
•By End-User (BFSI, Healthcare, Retail, Automotive, Manufacturing, IT and Telecommunications, Others) 
Regional Analysis/Coverage North America (US, Canada, Mexico), Europe (Germany, France, UK, Italy, Spain, Poland, Turkey, Rest of Europe), Asia Pacific (China, India, Japan, South Korea, Singapore, Australia, Rest of Asia Pacific), Middle East & Africa (UAE, Saudi Arabia, Qatar, South Africa, Rest of Middle East & Africa), Latin America (Brazil, Argentina, Rest of Latin America)
Company Profiles Google LLC, Microsoft Corporation, Amazon Web Services, Inc., IBM Corporation, Intel Corporation, NVIDIA Corporation, Qualcomm Technologies, Inc., Cognex Corporation, Basler AG, Keyence Corporation

Frequently Asked Questions

Ans: The expected CAGR of the Card Random Number Generator Market over the forecast period of 2025 to 2032 is 11.22%.

Ans: The market size of the Card Random Number Generator Market was USD 1.05 billion in 2024.

Ans: A major growth factor is the increasing adoption of RNGs in cryptography and digital transactions, driven by growing cybersecurity needs in financial services, blockchain, and online gaming ecosystems.

Ans: The Hardware RNG segment dominated the Card Random Number Generator Market, accounting for the highest revenue share in 2024 due to its physical entropy sources and true randomness.

Ans: North America dominated the Card Random Number Generator Market in 2024, owing to its mature technological infrastructure, regulatory compliance, and a high concentration of key RNG solution providers

Table of Contents

1. Introduction

1.1 Market Definition

1.2 Scope (Inclusion and Exclusions)

1.3 Research Assumptions

2. Executive Summary

2.1 Market Overview

2.2 Regional Synopsis

2.3 Competitive Summary

3. Research Methodology

3.1 Top-Down Approach

3.2 Bottom-up Approach

3.3. Data Validation

3.4 Primary Interviews

4. Market Dynamics Impact Analysis

4.1 Market Driving Factors Analysis

4.1.1 Drivers

4.1.2 Restraints

4.1.3 Opportunities

4.1.4 Challenges

4.2 PESTLE Analysis

4.3 Porter’s Five Forces Model

5. Statistical Insights and Trends Reporting

5.1 Security Standards & Certification Metrics

5.2 Industry-Wise Adoption Rates

5.3 Failure Rates and Entropy Statistics

5.4 User Behavior / Purchase Trends

6. Competitive Landscape

6.1 List of Major Companies, By Region

6.2 Market Share Analysis, By Region

6.3 Product Benchmarking

6.3.1 Product specifications and features

6.3.2 Pricing

6.4 Strategic Initiatives

6.4.1 Marketing and promotional activities

6.4.2 Distribution and Supply Chain Strategies

6.4.3 Expansion plans and new Product launches

6.4.4 Strategic partnerships and collaborations

6.5 Technological Advancements

6.6 Market Positioning and Branding

7. Card Random Number Generator Market Segmentation By Type

7.1 Chapter Overview

7.2 Hardware RNG

7.2.1 Hardware RNG Market Trends Analysis (2021-2032)

7.2.2 Hardware RNG Market Size Estimates and Forecasts to 2032 (USD Billion)

7.3 Software RNG

     7.3.1 Software RNG Market Trends Analysis (2021-2032)

           7.3.2 Software RNG Market Size Estimates and Forecasts to 2032 (USD Billion)

8. Card Random Number Generator Market Segmentation By Application

8.1 Chapter Overview

8.2 Gaming

     8.2.1 Gaming Market Trend Analysis (2021-2032)

           8.2.2 Gaming Market Size Estimates and Forecasts to 2032 (USD Billion)

8.3 Lottery

      8.3.1 Lottery Market Trends Analysis (2021-2032)

           8.3.2 Lottery Market Size Estimates and Forecasts to 2032 (USD Billion)

8.4 Cryptography

      8.4.1 Cryptography Market Trends Analysis (2021-2032)

           8.4.2 Cryptography Market Size Estimates and Forecasts to 2032 (USD Billion)

8.5 Simulation

      8.5.1 Simulation Market Trends Analysis (2021-2032)

           8.5.2 Simulation Market Size Estimates and Forecasts to 2032 (USD Billion)

8.6 Others

      8.6.1 Others Market Trends Analysis (2021-2032)

           8.6.2 Others  Market Size Estimates and Forecasts to 2032 (USD Billion)

9. Card Random Number Generator Market Segmentation By End User

9.1 Chapter Overview

9.2 Casinos

        9.2.1 Casinos Market Trends Analysis (2021-2032)

9.2.2 Casinos Market Size Estimates and Forecasts to 2032 (USD Billion)

9.3 Online Gaming Platforms

        9.3.1 Online Gaming Platforms Market Trends Analysis (2021-2032)

9.3.2 Online Gaming Platforms Market Size Estimates and Forecasts to 2032 (USD Billion)

9.4 Financial Institutions

        9.4.1 Financial Institutions Market Trends Analysis (2021-2032)

9.4.2 Financial Institutions Market Size Estimates and Forecasts to 2032 (USD Billion)

9.5 Research Institutions

        9.5.1 Research Institutions Market Trends Analysis (2021-2032)

9.5.2 Research Institutions Market Size Estimates and Forecasts to 2032 (USD Billion)

9.6 Others

        9.6.1 Others Market Trends Analysis (2021-2032)

9.6.2 Others Market Size Estimates and Forecasts to 2032 (USD Billion)

10. Regional Analysis

10.1 Chapter Overview

10.2 North America

10.2.1 Trends Analysis

10.2.2 North America Card Random Number Generator Market Estimates and Forecasts, by Country (2021-2032) (USD Billion)

10.2.3 North America Card Random Number Generator Market Estimates and Forecasts, By Type (2021-2032) (USD Billion) 

10.2.4 North America Card Random Number Generator Market Estimates and Forecasts, By Application (2021-2032) (USD Billion)

10.2.5 North America Card Random Number Generator Market Estimates and Forecasts, By End User (2021-2032) (USD Billion)

10.2.6 USA

10.2.6.1 USA Card Random Number Generator Market Estimates and Forecasts, By Type (2021-2032) (USD Billion)

10.2.6.2 USA Card Random Number Generator Market Estimates and Forecasts, By Application (2021-2032) (USD Billion)

10.2.6.3 USA Card Random Number Generator Market Estimates and Forecasts, By End User (2021-2032) (USD Billion)

10.2.7 Canada

10.2.7.1 Canada Card Random Number Generator Market Estimates and Forecasts, By Type (2021-2032) (USD Billion)

10.2.7.2 Canada Card Random Number Generator Market Estimates and Forecasts, By Application (2021-2032) (USD Billion)

10.2.7.3 Canada Card Random Number Generator Market Estimates and Forecasts, By End User (2021-2032) (USD Billion)

10.2.8 Mexico

10.2.8.1 Mexico Card Random Number Generator Market Estimates and Forecasts, By Type (2021-2032) (USD Billion)

10.2.8.2 Mexico Card Random Number Generator Market Estimates and Forecasts, By Application (2021-2032) (USD Billion)

10.2.8.3 Mexico Card Random Number Generator Market Estimates and Forecasts, By End User (2021-2032) (USD Billion)

10.3 Europe

10.3.1 Trends Analysis

10.3.2 Europe Card Random Number Generator Market Estimates and Forecasts, by Country (2021-2032) (USD Billion)

10.3.3 Europe Card Random Number Generator Market Estimates and Forecasts, By Type (2021-2032) (USD Billion) 

10.3.4 Europe Card Random Number Generator Market Estimates and Forecasts, By Application (2021-2032) (USD Billion)

10.3.5 Europe Card Random Number Generator Market Estimates and Forecasts, By End User(2021-2032) (USD Billion)

10.3.6 Germany

10.3.1.6.1 Germany Card Random Number Generator Market Estimates and Forecasts, By Type (2021-2032) (USD Billion)

10.3.1.6.2 Germany Card Random Number Generator Market Estimates and Forecasts, By Application (2021-2032) (USD Billion)

10.3.1.6.3 Germany Card Random Number Generator Market Estimates and Forecasts, By End User (2021-2032) (USD Billion)

10.3.7 France

10.3.7.1 France Card Random Number Generator Market Estimates and Forecasts, By Type (2021-2032) (USD Billion)

10.3.7.2 France a Card Random Number Generator Market Estimates and Forecasts, By Application (2021-2032) (USD Billion)

10.3.7.3 France Card Random Number Generator Market Estimates and Forecasts, By End User (2021-2032) (USD Billion)

10.3.8 UK

10.3.8.1 UK Card Random Number Generator Market Estimates and Forecasts, By Type (2021-2032) (USD Billion)

10.3.8.2 UK Card Random Number Generator Market Estimates and Forecasts, By Application (2021-2032) (USD Billion)

10.3.8.3 UK Card Random Number Generator Market Estimates and Forecasts, By End User (2021-2032) (USD Billion)

10.3.9 Italy

10.3.9.1 Italy Card Random Number Generator Market Estimates and Forecasts, By Type (2021-2032) (USD Billion)

10.3.9.2 Italy Card Random Number Generator Market Estimates and Forecasts, By Application (2021-2032) (USD Billion)

10.3.9.3 Italy Card Random Number Generator Market Estimates and Forecasts, By End User (2021-2032) (USD Billion)

10.3.10 Spain

10.3.10.1 Spain Card Random Number Generator Market Estimates and Forecasts, By Type (2021-2032) (USD Billion)

10.3.10.2 Spain Card Random Number Generator Market Estimates and Forecasts, By Application (2021-2032) (USD Billion)

10.3.10.3 Spain Card Random Number Generator Market Estimates and Forecasts, By End User (2021-2032) (USD Billion)

10.3.12 Poland

10.3.12.1 Poland Card Random Number Generator Market Estimates and Forecasts, by Country (2021-2032) (USD Billion)

10.3.12.1 Poland Card Random Number Generator Market Estimates and Forecasts, By Type (2021-2032) (USD Billion) 

10.3.12.3 Poland Card Random Number Generator Market Estimates and Forecasts, By Application (2021-2032) (USD Billion)

10.3.12.3 Poland Card Random Number Generator Market Estimates and Forecasts, By End User (2021-2032) (USD Billion)

10.3.13 Turkey

10.3.13.1 Turkey Card Random Number Generator Market Estimates and Forecasts, By Type (2021-2032) (USD Billion)

10.3.13.2 Turkey Card Random Number Generator Market Estimates and Forecasts, By Application (2021-2032) (USD Billion)

10.3.13.3 Turkey Card Random Number Generator Market Estimates and Forecasts, By End User (2021-2032) (USD Billion)

10.3.14 Rest of Europe

10.3.14.1 Rest of Europe Card Random Number Generator Market Estimates and Forecasts, By Type (2021-2032) (USD Billion)

10.3.14.2 Rest of Europe Card Random Number Generator Market Estimates and Forecasts, By Application (2021-2032) (USD Billion)

10.3.14.3 Rest of Europe Card Random Number Generator Market Estimates and Forecasts, By End User(2021-2032) (USD Billion)

10.4 Asia-Pacific

10.4.1 Trends Analysis

  10.4.2 Asia-Pacific Card Random Number Generator Market Estimates and Forecasts, by Country (2021-2032) (USD Billion)

 10.4.3 Asia-Pacific Card Random Number Generator Market Estimates and Forecasts, By Type (2021-2032) (USD Billion) 

 10.4.4 Asia-Pacific Card Random Number Generator Market Estimates and Forecasts, By Application (2021-2032) (USD Billion)

 10.4.5 Asia-Pacific Card Random Number Generator Market Estimates and Forecasts, By End User (2021-2032) (USD Billion)

10.4.6 China

10.4.6.1 China Card Random Number Generator Market Estimates and Forecasts, By Type (2021-2032) (USD Billion)

10.4.6.2 China Card Random Number Generator Market Estimates and Forecasts, By Application (2021-2032) (USD Billion)

10.4.6.3 China Card Random Number Generator Market Estimates and Forecasts, By End User (2021-2032) (USD Billion)

10.4.7 India

10.4.7.1 India Card Random Number Generator Market Estimates and Forecasts, By Type (2021-2032) (USD Billion)

10.4.7.2 India Card Random Number Generator Market Estimates and Forecasts, By Application (2021-2032) (USD Billion)

10.4.7.3 India Card Random Number Generator Market Estimates and Forecasts, By End User (2021-2032) (USD Billion)

10.4.8 Japan

10.4.8.1 Japan Card Random Number Generator Market Estimates and Forecasts, By Type (2021-2032) (USD Billion)

10.4.8.2 Japan Card Random Number Generator Market Estimates and Forecasts, By Application (2021-2032) (USD Billion)

10.4.8.3 Japan Card Random Number Generator Market Estimates and Forecasts, By End User (2021-2032) (USD Billion)

10.4.9 South Korea

10.4.9.1 South Korea Card Random Number Generator Market Estimates and Forecasts, By Type (2021-2032) (USD Billion)

10.4.9.2 South Korea Card Random Number Generator Market Estimates and Forecasts, By Application (2021-2032) (USD Billion)

10.4.9.3 South Korea Card Random Number Generator Market Estimates and Forecasts, By End User (2021-2032) (USD Billion)

10.4.10 Singapore

10.4.10.1 Singapore Card Random Number Generator Market Estimates and Forecasts, By Type (2021-2032) (USD Billion)

10.4.10.2 Singapore Card Random Number Generator Market Estimates and Forecasts, By Application (2021-2032) (USD Billion)

10.4.10.3 Singapore Card Random Number Generator Market Estimates and Forecasts, By End User (2021-2032) (USD Billion)

10.4.11 Australia

10.4.11.1 Australia Card Random Number Generator Market Estimates and Forecasts, By Type (2021-2032) (USD Billion)

10.4.11.2 Australia Card Random Number Generator Market Estimates and Forecasts, By Application (2021-2032) (USD Billion)

10.4.11.3 Australia Card Random Number Generator Market Estimates and Forecasts, By End User (2021-2032) (USD Billion)

10.4.12 Rest of Asia-Pacific

10.4.12.1 Rest of Asia-Pacific Card Random Number Generator Market Estimates and Forecasts, By Type (2021-2032) (USD Billion)

10.4.12.2 Rest of Asia-Pacific Card Random Number Generator Market Estimates and Forecasts, By Application (2021-2032) (USD Billion)

10.4.12.3 Rest of Asia-Pacific Card Random Number Generator Market Estimates and Forecasts, By End User (2021-2032) (USD Billion)

10.5 Middle East and Africa

10.5.1 Trends Analysis

10.5.2 Middle East and Africa East Card Random Number Generator Market Estimates and Forecasts, by Country (2021-2032) (USD Billion)

10.5.3Middle East and Africa Card Random Number Generator Market Estimates and Forecasts, By Type (2021-2032) (USD Billion) 

10.5.4 Middle East and Africa Card Random Number Generator Market Estimates and Forecasts, By Application (2021-2032) (USD Billion)

10.5.5 Middle East and Africa Card Random Number Generator Market Estimates and Forecasts, By End User (2021-2032) (USD Billion)

10.5.6 UAE

10.5.6.1 UAE Card Random Number Generator Market Estimates and Forecasts, By Type (2021-2032) (USD Billion)

10.5.6.2 UAE Card Random Number Generator Market Estimates and Forecasts, By Application (2021-2032) (USD Billion)

10.5.6.3 UAE Card Random Number Generator Market Estimates and Forecasts, By End User (2021-2032) (USD Billion)

10.5.7 Saudi Arabia

10.5.7.1 Saudi Arabia Card Random Number Generator Market Estimates and Forecasts, By Type (2021-2032) (USD Billion)

10.5.7.2 Saudi Arabia Card Random Number Generator Market Estimates and Forecasts, By Application (2021-2032) (USD Billion)

10.5.7.3 Saudi Arabia Card Random Number Generator Market Estimates and Forecasts, By End User (2021-2032) (USD Billion)

10.5.8 Qatar

10.5.8.1 Qatar Card Random Number Generator Market Estimates and Forecasts, By Type (2021-2032) (USD Billion)

10.5.8.2 Qatar Card Random Number Generator Market Estimates and Forecasts, By Application (2021-2032) (USD Billion)

10.5.8.3 Qatar Card Random Number Generator Market Estimates and Forecasts, By End User (2021-2032) (USD Billion)

10.5.9 South Africa

10.5.9 1 South Africa Card Random Number Generator Market Estimates and Forecasts, By Type (2021-2032) (USD Billion)

10.5.9 2 South Africa Card Random Number Generator Market Estimates and Forecasts By Application (2021-2032) (USD Billion)

10.5.9 3 South Africa Card Random Number Generator Market Estimates and Forecasts, By End User (2021-2032) (USD Billion)

10.5.10 Rest of Middle East & Africa

10.5.10.1 Rest of Middle East & Africa Card Random Number Generator Market Estimates and Forecasts, By Type (2021-2032) (USD Billion)

10.5.10.2 Rest of Middle East & Africa Card Random Number Generator Market Estimates and Forecasts, By Application (2021-2032) (USD Billion)

10.5.10.3 Rest of Middle East & Africa Card Random Number Generator Market Estimates and Forecasts, By End User (2021-2032) (USD Billion)

10.6 Latin America

10.6.1 Trends Analysis

10.6.2 Latin America Card Random Number Generator Market Estimates and Forecasts, by Country (2021-2032) (USD Billion)

10.6.3 Latin America Card Random Number Generator Market Estimates and Forecasts, By Type (2021-2032) (USD Billion) 

10.6.4 Latin America Card Random Number Generator Market Estimates and Forecasts, By Application (2021-2032) (USD Billion)

10.6.5 Latin America Card Random Number Generator Market Estimates and Forecasts, By End User (2021-2032) (USD Billion)

10.6.6 Brazil

10.6.6.1 Brazil Card Random Number Generator Market Estimates and Forecasts, By Type (2021-2032) (USD Billion)

10.6.6.2 Brazil Card Random Number Generator Market Estimates and Forecasts, By Application (2021-2032) (USD Billion)

10.6.6.3 Brazil Card Random Number Generator Market Estimates and Forecasts, By End User (2021-2032) (USD Billion)

10.6.7 Argentina

10.6.7.1 Argentina Card Random Number Generator Market Estimates and Forecasts, By Type (2021-2032) (USD Billion)

10.6.7.2 Argentina Card Random Number Generator Market Estimates and Forecasts, By Application (2021-2032) (USD Billion)

10.6.7.3 Argentina Card Random Number Generator Market Estimates and Forecasts, By End User (2021-2032) (USD Billion)

10.6.8 Rest of Latin America

10.6.8.1 Rest of Latin America Card Random Number Generator Market Estimates and Forecasts, By Type (2021-2032) (USD Billion)

10.6.8.2 Rest of Latin America Card Random Number Generator Market Estimates and Forecasts, By Application (2021-2032) (USD Billion)

10.6.8.3 Rest of Latin America Card Random Number Generator Market Estimates and Forecasts, By End User (2021-2032) (USD Billion)

12. Company Profiles

12.1 Microchip Technology Inc.

          12.1.1 Company Overview

12.1.2 Financial

12.1.3 Products/ Services Offered

12.1.4 SWOT Analysis

12.2 Texas Instruments Incorporated

           12.2.1 Company Overview

12.2.2 Financial

12.2.3 Products/ Services Offered

12.2.4 SWOT Analysis

12.3 NXP Semiconductors

          12.3.1 Company Overview

12.3.2 Financial

12.3.3 Products/ Services Offered

12.3.4 SWOT Analysis

12.4 STMicroelectronics

          12.4.1 Company Overview

12.4.2 Financial

12.4.3 Products/ Services Offered

12.4.4 SWOT Analysis

12.5 Analog Devices, Inc.

          12.5.1 Company Overview

12.5.2 Financial

12.5.3 Products/ Services Offered

12.5.4 SWOT Analysis

12.6 Infineon Technologies AG

            12.6.1 Company Overview

12.6.2 Financial

12.6.3 Products/ Services Offered

12.6.4 SWOT Analysis

12.7 Renesas Electronics Corporation

          12.7.1 Company Overview

12.7.2 Financial

12.7.3 Products/ Services Offered

12.7.4 SWOT Analysis

12.8 ON Semiconductor

12.8.1 Company Overview

12.8.2 Financial

12.8.3 Products/ Services Offered

12.8.4 SWOT Analysis

12.9 Qualcomm Technologies, Inc.

12.9.1 Company Overview

12.9.2 Financial

12.9.3 Products/ Services Offered

12.9.4 SWOT Analysis

12.10 Intel Corporation

12.10.1 Company Overview

12.10.2 Financial

12.10.3 Products/ Services Offered

12.10.4 SWOT Analysi

12. Use Cases and Best Practices

13. Conclusion

An accurate research report requires proper strategizing as well as implementation. There are multiple factors involved in the completion of good and accurate research report and selecting the best methodology to compete the research is the toughest part. Since the research reports we provide play a crucial role in any company’s decision-making process, therefore we at SNS Insider always believe that we should choose the best method which gives us results closer to reality. This allows us to reach at a stage wherein we can provide our clients best and accurate investment to output ratio.

Each report that we prepare takes a timeframe of 350-400 business hours for production. Starting from the selection of titles through a couple of in-depth brain storming session to the final QC process before uploading our titles on our website we dedicate around 350 working hours. The titles are selected based on their current market cap and the foreseen CAGR and growth.


The 5 steps process:

Step 1: Secondary Research:

Secondary Research or Desk Research is as the name suggests is a research process wherein, we collect data through the readily available information. In this process we use various paid and unpaid databases which our team has access to and gather data through the same. This includes examining of listed companies’ annual reports, Journals, SEC filling etc. Apart from this our team has access to various associations across the globe across different industries. Lastly, we have exchange relationships with various university as well as individual libraries.

Secondary Research

Step 2: Primary Research

When we talk about primary research, it is a type of study in which the researchers collect relevant data samples directly, rather than relying on previously collected data.  This type of research is focused on gaining content specific facts that can be sued to solve specific problems. Since the collected data is fresh and first hand therefore it makes the study more accurate and genuine.

We at SNS Insider have divided Primary Research into 2 parts.

Part 1 wherein we interview the KOLs of major players as well as the upcoming ones across various geographic regions. This allows us to have their view over the market scenario and acts as an important tool to come closer to the accurate market numbers. As many as 45 paid and unpaid primary interviews are taken from both the demand and supply side of the industry to make sure we land at an accurate judgement and analysis of the market.

This step involves the triangulation of data wherein our team analyses the interview transcripts, online survey responses and observation of on filed participants. The below mentioned chart should give a better understanding of the part 1 of the primary interview.

Primary Research

Part 2: In this part of primary research the data collected via secondary research and the part 1 of the primary research is validated with the interviews from individual consultants and subject matter experts.

Consultants are those set of people who have at least 12 years of experience and expertise within the industry whereas Subject Matter Experts are those with at least 15 years of experience behind their back within the same space. The data with the help of two main processes i.e., FGDs (Focused Group Discussions) and IDs (Individual Discussions). This gives us a 3rd party nonbiased primary view of the market scenario making it a more dependable one while collation of the data pointers.

Step 3: Data Bank Validation

Once all the information is collected via primary and secondary sources, we run that information for data validation. At our intelligence centre our research heads track a lot of information related to the market which includes the quarterly reports, the daily stock prices, and other relevant information. Our data bank server gets updated every fortnight and that is how the information which we collected using our primary and secondary information is revalidated in real time.

Data Bank Validation

Step 4: QA/QC Process

After all the data collection and validation our team does a final level of quality check and quality assurance to get rid of any unwanted or undesired mistakes. This might include but not limited to getting rid of the any typos, duplication of numbers or missing of any important information. The people involved in this process include technical content writers, research heads and graphics people. Once this process is completed the title gets uploader on our platform for our clients to read it.

Step 5: Final QC/QA Process:

This is the last process and comes when the client has ordered the study. In this process a final QA/QC is done before the study is emailed to the client. Since we believe in giving our clients a good experience of our research studies, therefore, to make sure that we do not lack at our end in any way humanly possible we do a final round of quality check and then dispatch the study to the client.

Key Segments: 

By Type

  • Hardware RNG

  • Software RNG

By Application

  • Gaming

  • Lottery

  • Cryptography

  • Simulation

  • Others

By End-User

  • Casinos

  • Online Gaming Platforms

  • Financial Institutions

  • Research Institutions

  • Others

Request for Segment Customization as per your Business Requirement: Segment Customization Request

Regional Coverage: 

North America

  • US

  • Canada

  • Mexico

Europe

  • Germany

  • France

  • UK

  • Italy

  • Spain

  • Poland

  • Turkey

  • Rest of Europe

Asia Pacific

  • China

  • India

  • Japan

  • South Korea

  • Singapore

  • Australia

  • Rest of Asia Pacific

Middle East & Africa

  • UAE

  • Saudi Arabia

  • Qatar

  • South Africa

  • Rest of Middle East & Africa

Latin America

  • Brazil

  • Argentina

  • Rest of Latin America

Request for Country Level Research Report: Country Level Customization Request

Available Customization 

With the given market data, SNS Insider offers customization as per the company’s specific needs. The following customization options are available for the report: 

  • Detailed Volume Analysis 

  • Criss-Cross segment analysis (e.g. Product X Application) 

  • Competitive Product Benchmarking 

  • Geographic Analysis 

  • Additional countries in any of the regions 

  • Customized Data Representation 

  • Detailed analysis and profiling of additional market players

Explore Key Insights.


  • Analyzes market trends, forecasts, and regional dynamics
  • Covers core offerings, innovations, and industry use cases
  • Profiles major players, value chains, and strategic developments
  • Highlights innovation trends, regulatory impacts, and growth opportunities
Request an Analyst Call