Chemical Licensing Market Report Scope & Overview:
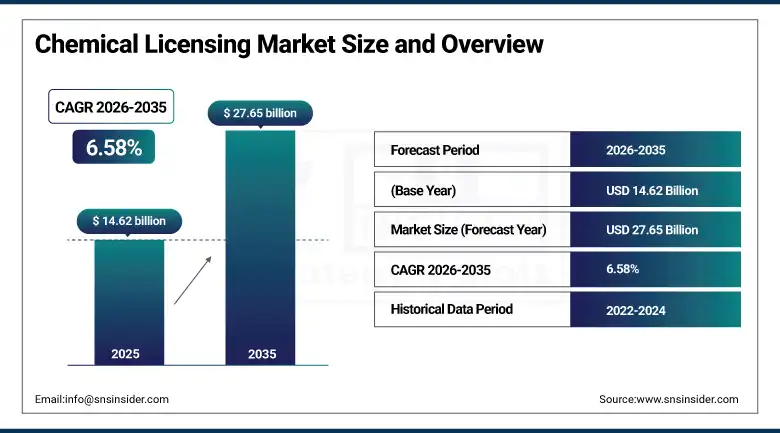
The chemical licensing market was valued at USD 14.62 billion in 2025 and is expected to reach USD 27.65 billion by 2035, growing at a CAGR of 6.58% from 2026 to 2035.
There are ongoing positive trends in the chemical licensing market, which are associated with a significant rise in global demand for innovative and environmentally friendly production technologies within the petrochemical and specialty chemicals industries. Companies in the chemical industry are progressively using licensed technologies as a solution to meet environmental standards, reduce the carbon footprint of operations, and increase production efficiency. The rising interest in eco-friendly technologies, coupled with the development of refineries and petrochemical facilities in Asia Pacific and the Middle East regions, is fueling the demand for licensed technologies. Moreover, investments in digital process optimization, AI-driven plant management systems, and green chemicals processes will ensure further market opportunities.
In April 2025, Sinopec's subsidiary Ningbo Zhenhai picked up a license for HPPE technology and process design offered by ECI Group for its new high-pressure plant.
Market Size and Forecast
-
Market Size in 2025: USD 14.62 Billion
-
Market Size by 2032: USD 27.65 Billion
-
CAGR: 6.58% from 2026 to 2035
-
Fastest Growing Region: Asia Pacific
-
Largest Region: Asia Pacific
To Get more information On Chemical Licensing Market - Request Free Sample Report
Chemical Licensing Market Trends
-
The growing acceptance of energy-efficient and sustainable chemical processes is expanding the market scope worldwide.
-
The rising investments in petrochemical capacity expansion in Asia Pacific and the Middle East regions are fueling the demand for process licensing.
-
The growing regulations on carbon emission have pushed the manufacturers to opt for licensed chemical processes with lower emissions.
-
The digital twin technology and artificial intelligence-enabled process control have improved the operational efficiency and made licensed chemical processes more valuable.
-
The increasing cross-border process licensing agreements between global and emerging chemical companies are changing the competitive landscape.
U.S. Chemical Licensing Market Size Outlook
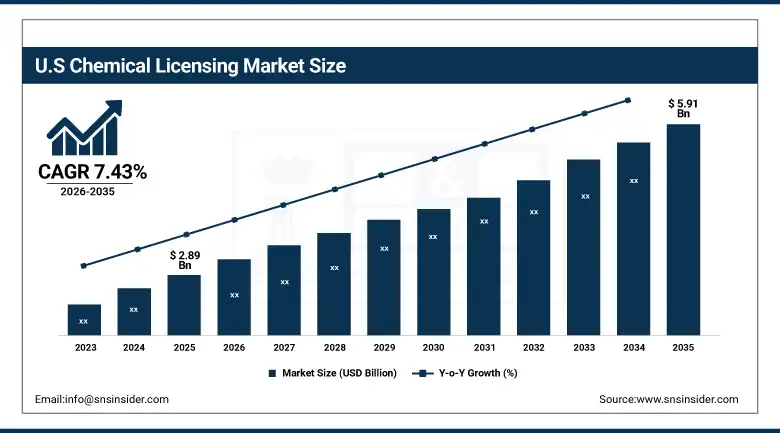
The U.S. chemical licensing market was valued at USD 2.89 billion in 2025 and is expected to reach USD 5.91 billion by 2035, growing at a CAGR of 7.43% from 2026 to 2035.
The U.S. chemicals licensing market is growing due to the efforts made by companies to decrease their carbon intensity and increase efficiency in their operations. Some of the leading companies in this area include Dow Inc. and Lummus Technology, who have started collaborations for licensing of olefin processes that produce fewer emissions. Adoption of digital twin and artificial intelligence-powered process controls are also helping to boost licensing due to improved efficiency and reduced downtime. Increasing focus on responsible production of chemicals and use of clean energy is expected to fuel the growth of the market.
According to the American Chemistry Council, investments in specialty chemicals in the United States grew by 3.2% in 2023.
Chemical Licensing Market Segment Analysis
-
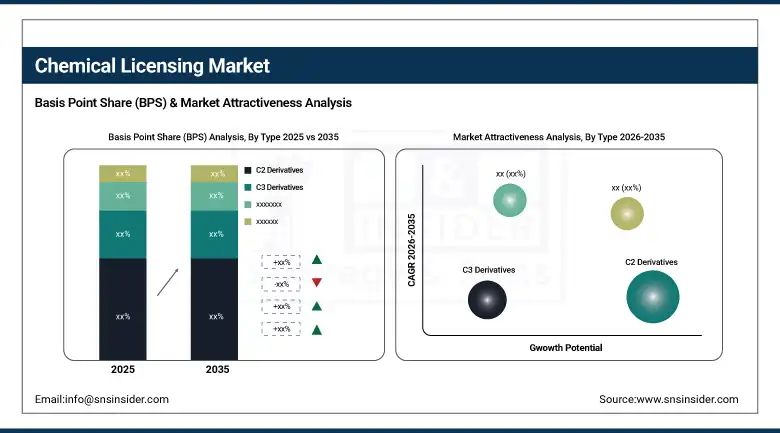
By Type, C2 Derivatives segment dominated the Chemical Licensing Market in 2025 with around 42% share; C1 Derivatives segment fastest growing.
-
By End User, Chemical segment dominated the Chemical Licensing Market in 2025 with around 64% share; Oil & Gas segment fastest growing.
By Type, C2 Derivatives segment dominates the chemical licensing market, C1 Derivatives segment expected to grow fastest
The C2 Derivatives segment dominated the chemical licensing market during the forecast period, driven by increasing global demand for ethylene, which is key to polyethylene and other polymers utilized in packaging, automotive, and consumer goods sectors. ExxonMobil and Shell offer enhanced cracking licenses that promote higher efficiencies and lower energy usage, giving an edge to C2 derivatives in the market. The record-breaking consumption of ethane witnessed in 2023 further fueled licensing requirements. New capacities were added to Middle Eastern projects, such as SABIC's new ethylene plants. Continued demand for lightweight plastics in automotive and packaging applications keeps pushing the demand for licenses for C2 derivatives.
The C1 Derivatives segment is the fastest-growing segment in the chemical licensing market, thanks to increasing licensing requirements for natural gas-based chemical production technologies like methanol, ammonia, and hydrogen. Companies are looking to license innovative C1 conversion processes to reduce costs and cope with surging demand for clean energy carriers. Growing utilization of methanol as a fuel blending additive and hydrogen as an industrial feedstock is generating demand for licenses for C1 derivatives. Growing investment in low-carbon ammonia and green methanol projects in Asia, the Middle East, and North America is driving segment growth.
By End User, Chemical segment dominates the chemical licensing market, Oil & Gas segment expected to grow fastest
The Chemical segment dominated the chemical licensing market during 2025 owing to chemical producers' dependency on licensed technologies for accessing high margin products and complying with stringent global regulations. The companies such as BASF and Linde licensed hydrogen production process technologies to companies operating in Asia and Europe during 2023. Continuous demand for polymers, surfactants, and specialty intermediates forces chemical companies to depend on licensed technologies for improving their performance, efficiency, and compliance. Dominance of the segment is also driven by diverse types of products that need specific licensed production processes.
Oil & Gas segment is the fastest growing end user in the chemical licensing market due to increasing adoption of licensed refinery process technologies to improve efficiency and comply with fuel quality norms. The use of licensed hydrocracking, isomerization, and alkylation process technologies is becoming prevalent among refineries to increase the output from their current capacities. Rising complexity of feedstock and fuel quality regulations are driving adoption of licensed technologies in refineries. Growth in refinery modernization initiatives in Asia, the Middle East, and North America is expected to drive the demand for licensed Oil & Gas process technologies during the forecast period.
Regional Analysis
|
Region |
Major Country |
Share within Region, 2025 (%) |
|---|---|---|
|
North America |
United States |
72.5% |
|
Europe |
Germany |
31.2% |
|
Asia Pacific |
China |
48.6% |
|
Middle East & Africa |
Saudi Arabia |
42.3% |
|
Latin America |
Brazil |
38.1% |
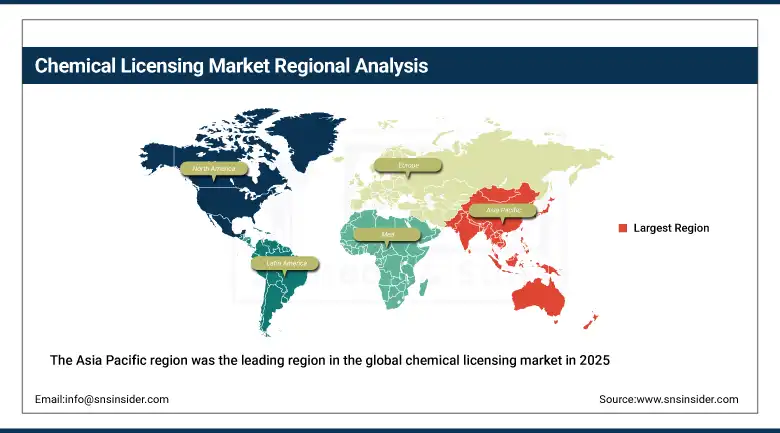
Asia Pacific Chemical Licensing Market Insights
The Asia Pacific region was the leading region in the global chemical licensing market in 2025, accounting for a revenue share of 38.23%. This is due to the fast-growing refining and petrochemical capacity in countries like China, India, and Southeast Asia because of rapid industrialization and growing energy needs. Licensing of technologies by PetroChina to enhance production capacity and the utilization of licensed technology by Indian Oil Corporation in their chemical plants are examples of this strategy by the region. This strategy is influenced by energy security concerns and stringent environmental regulations, thus the consistent demand for licensed chemical processes in the region.
Get Customized Report as per Your Business Requirement - Enquiry Now
North America Chemical Licensing Market Insights
The North American chemical licensing market is experiencing steady growth driven by corporate efforts to decarbonize their businesses along with the development of more sophisticated licensed process technology. The U.S. plays a significant role as a key player driving regional demand through investments in low emission olefins, hydrogen production, and chemical licensing contracts. In addition, the rising importance of sustainable manufacturing and the deployment of digital solutions and artificial intelligence in chemical plants is fueling market growth. Furthermore, collaborations between leading chemical process licensors and chemical manufacturers are helping expand capacities in petrochemicals and specialty chemicals.
Europe Chemical Licensing Market Insights
Europe chemical licensing market is registering stable growth underpinned by stringent environmental regulations and active investments in sustainable chemical production technologies. Chemical manufacturers across the region are licensing advanced processes to meet the European Green Deal targets, reduce carbon emissions, and transition toward bio-based and renewable feedstocks. Germany, France, and the Netherlands are key licensing hubs, with strong activity in specialty chemicals, polymers, and hydrogen processes. Growing demand for licensed low-carbon ammonia and green hydrogen technologies is emerging as a prominent growth driver across European chemical licensing activity.
Middle East & Africa and Latin America Chemical Licensing Market Insights
The markets for chemical licensing in Middle East and Africa and Latin America are experiencing steady growth due to growing investments in petrochemicals and establishment of refinery and chemical complexes. Countries in the Middle East, especially Saudi Arabia and the UAE, are utilizing their ample reserves of hydrocarbons to boost their chemical manufacturing capacity. In Latin America, the focus is on Brazil, which is making efforts to introduce licensed refinery technology. There is an increase in government funding for achieving self-reliance in petrochemicals.
Market Dynamics
Growth Drivers: Rising demand for sustainable and green chemical process technologies is driving widespread adoption of licensed production systems across global industries
The rising trend of regulation in the world to limit carbon emissions and move towards clean energy in industrial processes is driving a high demand for licensed energy-efficient chemical processes. Chemical companies are on the lookout for licensed technologies related to green hydrogen production, low-carbon ammonia, bio-based chemicals, and renewable feedstock utilization to achieve sustainability goals. Process licensors providing solutions which help minimize waste creation, use less energy, and follow circular economy practices are witnessing high levels of commercial activity. Also, the rise in petrochemical production capacities in developing countries and upgrades of aging chemical facilities in developed countries are leading to many opportunities in process licensing. In addition, the increasing complexity of the global chemical value chain and standardization of product quality across specialty chemicals and petrochemicals add more importance to process licensing.
Restraints: High upfront licensing costs and technology access barriers are limiting adoption among smaller chemical producers and emerging market players
Licensing fees, royalty charges, and technology transfer costs create difficulties for smaller chemical producers and manufacturing firms operating in developing nations. Most companies in emerging markets do not have the capital investment necessary to invest in sophisticated licensed technology, and hence are unable to compete effectively against bigger firms that are utilizing modern technology. The complexity of regulatory procedures when it comes to licensing and intellectual property laws in certain jurisdictions make it even more difficult to expand into new markets. Furthermore, the availability of cheaper alternatives and the unwillingness on the part of certain firms in the region to enter into long-term licensing agreements is making it increasingly difficult for firms to gain market traction.
Opportunities: Growing investments in green hydrogen and low-carbon chemical processes are creating significant new licensing opportunities across global chemical and energy sectors
The move towards clean energy and decarbonization of industrial processes is creating a high level of demand for licensed green hydrogen, low-carbon ammonia, and biochemical production processes. Governments around the world, particularly in North America, Europe, and Asia, have been making huge investments in sustainable chemical infrastructure development, which has helped drive the use of advanced licensed chemical processes. Some of the top chemical technology firms have developed their own licenses for carbon capture, hydrogen production using electrolysis, and bio-refinery integration, thereby providing commercial opportunities in the licensing space. There is an increasing interest among energy companies looking at chemicals manufacturing, along with the emergence of green chemical hubs in the Middle East and Asia. This makes the licensing of sustainable chemical processes a lucrative area for the global chemical licensing market.
Recent Developments:
-
2025: Sinopec’s Ningbo Zhenhai unit opted for ECI Group’s high-pressure polyethylene (HPPE) license and process design package in the installation of the high-pressure system, indicating increased use of innovative technologies through licenses in major petrochemical plants.
-
2024: BASF and Linde extended licensing partnerships on hydrogen production technologies, providing licensed technologies to Asian and European chemical companies in response to sustainable practices in the industry.
-
2024: License deals on cracking technology from ExxonMobil and Shell contributed to higher output and energy savings during the production of polyethylene and C2 derivatives.
-
2023: Dow Inc. and Lummus Technology expanded licensing collaboration to commercialize lower-emission olefins processes, targeting corporate decarbonization goals and the growing demand for cleaner chemical manufacturing technologies in North America and globally.
Chemical Licensing Market Companies are:
-
BASF
-
Dow
-
DuPont
-
Chevron Phillips Chemical
-
ExxonMobil
-
Shell
-
Huntsman
-
Eastman
-
Johnson Matthey
-
LyondellBasell
-
Linde
-
Honeywell UOP
-
KBR
-
Lummus Technology
-
SABIC
-
TechnipFMC
-
Clariant
-
Sinopec
-
PetroChina
-
Toyo Engineering
Chemical Licensing Market Report Scope:
| Report Attributes | Details |
|---|---|
| Market Size in 2025 | USD 14.62 Billion |
| Market Size by 2035 | USD 22.74 Billion |
| CAGR | CAGR of 6.58% From 2026 to 2035 |
| Base Year | 2025 |
| Forecast Period | 2026-2035 |
| Historical Data | 2022-2024 |
| Report Scope & Coverage | Market Size, Segments Analysis, Competitive Landscape, Regional Analysis, DROC & SWOT Analysis, Forecast Outlook |
| Key Segments | • By Type (C1 Derivatives, C2 Derivatives, C3 Derivatives, C4 Derivatives) • By End User (Oil & Gas, Chemical) |
| Regional Analysis/Coverage | North America (US, Canada, Mexico), Europe (Eastern Europe [Poland, Romania, Hungary, Turkey, Rest of Eastern Europe] Western Europe] Germany, France, UK, Italy, Spain, Netherlands, Switzerland, Austria, Rest of Western Europe]), Asia Pacific (China, India, Japan, South Korea, Vietnam, Singapore, Australia, Rest of Asia Pacific), Middle East & Africa (Middle East [UAE, Egypt, Saudi Arabia, Qatar, Rest of Middle East], Africa [Nigeria, South Africa, Rest of Africa], Latin America (Brazil, Argentina, Colombia, Rest of Latin America) |
| Company Profiles | BASF, Dow, DuPont, Chevron Phillips Chemical, ExxonMobil, Shell, Huntsman, Eastman, Johnson Matthey, LyondellBasell, Linde, Honeywell UOP, KBR, Lummus Technology, SABIC, TechnipFMC, Clariant, Sinopec, PetroChina, Toyo Engineering |
Frequently Asked Questions
Asia Pacific dominated the Chemical Licensing Market in 2025.
The C2 Derivatives segment dominated the Chemical Licensing Market in 2025.
Rising demand for sustainable and green chemical process technologies is driving widespread adoption of licensed production systems across global industries.
The Chemical Licensing Market was valued at USD 14.62 billion in 2025.
The Chemical Licensing Market is expected to grow at a CAGR of 6.58% from 2025 to 2032.
Get in Touch
