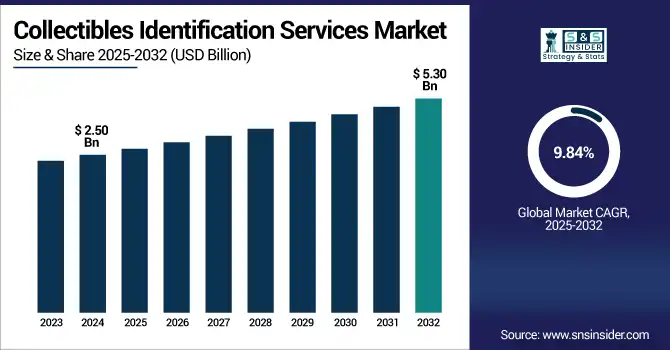
The Collectibles Identification Services Market Size was valued at USD 2.50 billion in 2024 and is expected to reach USD 5.30 billion by 2032 and grow at a CAGR of 9.84% over the forecast period 2025-2032.
The market is experiencing robust growth, driven by rising interest in rare and valuable items such as coins, art, stamps, toys, and vintage fashion. These services include authentication, valuation, condition reporting, provenance research, and certification, offered via online platforms, mobile apps, and in-person evaluations. Growing participation from individual collectors, dealers, and investment firms, alongside technological advancements, is fueling demand for reliable identification solutions. Notably, authentication services lead the market, supported by increased digitalization and the global expansion of grading institutions. This market plays a crucial role in preserving asset integrity, boosting buyer confidence, and ensuring long-term value.
According to a study, the growing popularity of collectibles such as coins, artworks, and vintage items has significantly increased the demand for identification services. This surge has made authentication services the most dominant and fastest-growing segment. With a rise in online and mobile-based platforms, over 60% of users now prefer digital identification channels. The expansion of individual collectors and investment firms further drives the need for valuation and certification, ensuring the integrity, provenance, and marketability of high-value collectibles.
The U.S. Collectibles Identification Services Market size was USD 0.59 billion in 2024 and is expected to reach USD 1.07 billion by 2032, growing at a CAGR of 7.68% over the forecast period of 2025–2032. The U.S. market is a rising demand for authentication and valuation of rare items due to increased investment in alternative assets. As a result, service providers are expanding digital offerings to meet collector expectations. The U.S. dominates in North America because of its large base of individual collectors, advanced grading infrastructure, and widespread use of mobile and online identification services across diverse collectible categories.
Escalating Demand for Trusted Authentication Services Driven by Rising Collector Investment in Rare and Valuable Assets
The high-value collectibles, such as coins, artworks, and vintage items, are increasingly seen as alternative investment assets, and the demand for reliable authentication, valuation, and documentation services has surged. This is driven by growing investor interest in physical assets that retain or increase in value over time. As a result, service providers are enhancing their offerings to meet expectations for transparency, security, and expert evaluation. This shift is particularly visible in the U.S., where a large base of collectors and investors exists. Institutions are leveraging digital tools, AI-driven condition reporting, and expanded certification services to ensure buyers and sellers can transact with confidence. The ripple effect is a rising adoption rate among individual collectors, auction houses, and investment firms, further stimulating market growth.
For example, in February 2025, PCGS launched the Online Submission Portal 2.0, significantly reducing turnaround times and improving service accessibility, highlighting how increased collector demand drives operational innovation.
Restraints:
Regulatory Ambiguity in Certification Standards Inhibits Market Consistency and Consumer Confidence
There is no universal standard or federal regulatory oversight governing how collectibles are authenticated, graded, or certified in the U.S.; many identification service providers apply differing methodologies and evaluation scales. This inconsistency leads to confusion among collectors, especially newcomers, who may question the legitimacy or accuracy of assessments. As a result, trust in third-party services can waver, limiting widespread adoption. For seasoned collectors or dealers, it complicates resale and reduces value certainty. The lack of regulatory benchmarks also prevents smaller players from gaining industry-wide recognition, thus reducing competition and innovation. While major companies maintain internal grading systems, the absence of enforceable quality standards across the sector restricts market maturation and poses a significant hurdle to scalability.
This regulatory gap forces buyers and sellers to rely heavily on brand reputation rather than industry validation, which restricts entry into global markets and inhibits integration with financial and insurance services that demand standardized documentation.
Opportunities:
Expansion Into AI-Powered Condition Reporting Opens New Markets and Spurs Technological Advancements
The rapid advancement of artificial intelligence and its ability to detect minute details with consistency, collectible identification services are beginning to integrate AI-powered tools for condition reporting and authentication. This shift enhances both speed and accuracy, particularly for high-volume assessments involving coins, stamps, and vintage cards. As a result, companies adopting AI gain a significant advantage in operational efficiency, offering faster turnaround times and reducing human error. These tools also democratize access by allowing mobile-based users and remote collectors to receive near-expert-level evaluations without physically shipping items, cutting costs, and opening untapped customer segments.
For instance, in July 2025, a major auction house introduced an AI-based grading system that automatically evaluates coin surface integrity and wear levels within seconds. This innovation streamlined cataloging and authentication processes, showing how AI deployment not only boosts productivity but also makes condition reporting more scalable, accessible, and consistent across user tiers.
Challenges:
High Operational Costs for State-of-the-Art Grading Labs Challenge Market Profitability and Accessibility
Because high-quality authentication services require advanced imaging equipment, secure facilities, climate-controlled storage, and experienced graders, the cost of establishing and operating grading labs is substantial. As a result, only a few established players can afford the overhead, creating high barriers to entry for startups and limiting innovation. These costs also translate into expensive service fees for end users, discouraging broader adoption, especially among casual collectors or hobbyists. The impact is twofold: the market remains concentrated among a few large firms, and price-sensitive segments remain underserved. Moreover, maintaining consistent turnaround times and quality under high demand increases staffing and logistical burdens, further straining operational budgets.
This challenge is amplified when trying to expand regionally or internationally, as replicating infrastructure in new markets is capital-intensive. Consequently, the high-cost structure limits scalability, affects profitability margins, and slows down technological rollout, despite clear demand signals from growing segments such as digital collectors and app-based users.
By Type of Collectibles
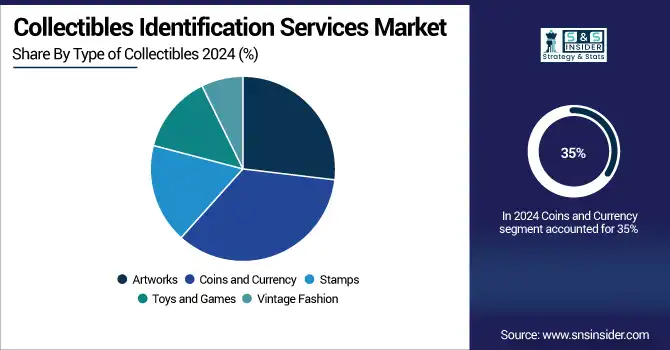
High investment value and historical appeal have led the Coins and Currency segment to capture 35% of revenue in 2024. This demand has prompted grading firms like PCGS and NGC to enhance secure authentication and encapsulation features. Improved services have elevated buyer confidence, increased transactions, and reinforced trust. As more collectors seek third-party validation, this segment continues driving the Collectibles Identification Services Market, particularly through product innovation and expanded digital platforms tailored to currency collectors.
Surging collector interest in nostalgic items and rising resale values have pushed the Toys and Games segment to grow at a 13.26% CAGR. Service providers have responded with digital grading systems and app-based evaluation tools. For instance, Heritage Auctions expanded grading options for retro toys in 2024. Enhanced tools have simplified authentication and improved collectible value accuracy, accelerated demand, and strengthened the Collectibles Identification Services Market in the pop culture and entertainment niche.
By Service Type
Widespread digital adoption and platform reliability contributed to Online Identification Services leading the market with 37% of revenue in 2024. Identification providers launched instant grading portals, secure uploads, and digital certificates. NGC, in 2024, expanded its online coin grading infrastructure, boosting service accessibility. These innovations support faster, remote evaluations and scalability, resulting in higher engagement among collectors and investors. The shift to digital-first solutions continues to propel the Collectibles Identification Services Market forward.
Strong smartphone penetration and on-the-go user behavior fueled Mobile App-based Identification to achieve a 12.23% CAGR. Developers introduced AI-driven tools for real-time grading via photo input. In 2025, a leading company launched an app offering instant card condition analysis. Greater convenience and instant results have improved customer engagement and broadened reach. These advancements are transforming collector experiences, increasing market participation, and directly boosting the collectibles identification services market growth.
By Customer Type
Growing personal interest in rare items and collectibles drove Individual Collectors to capture 36% of the market revenue in 2024. Tailored services such as subscription grading, online consultations, and digital storage appealed to this segment. In 2024, PCGS introduced flexible pricing tiers for hobbyists. Increased accessibility and personalized tools have deepened engagement, expanded user bases, and strengthened the Collectibles Identification Services Market, particularly among those collecting for passion, legacy, or long-term investment.
High-volume trading and rapid valuation needs helped the Retailers and Dealers segment grow at a CAGR of 11.70%. Service providers developed enterprise dashboards and batch authentication tools. NGC launched a dedicated dealer portal in 2024 to simplify bulk submissions. These solutions streamlined operations, reduced turnaround time, and improved transaction trust. As business clients seek operational efficiency, their demand continues to support the acceleration and scalability of the Collectibles Identification Services Market.
By Features Offered
Increasing counterfeit risks and the need for secure verification positioned Authentication Services as the top contributor, reaching 39% of revenue in 2024. Industry leaders added tamper-evident cases, digital scans, and blockchain-enabled verification. In 2024, PCGS adopted AI-powered fraud detection. These advancements reassured buyers, minimized risk, and expanded global reach. As market participants prioritize authenticity, demand for robust services remains central to the evolution of the Collectibles Identification Services Market.
Investor demand for verified records and long-term value preservation pushed Documentation and Certification to grow at a 13.76% CAGR. Providers began offering blockchain-led certificates and digital recordkeeping systems. In 2024, Sotheby’s launched NFT-backed provenance reports with a tech partner. This transparency and traceability uplifted consumer trust, boosted resale potential, and made documentation a critical component in expanding the Collectibles Identification Services Market, especially for high-value, insurable, and institutional-grade assets.
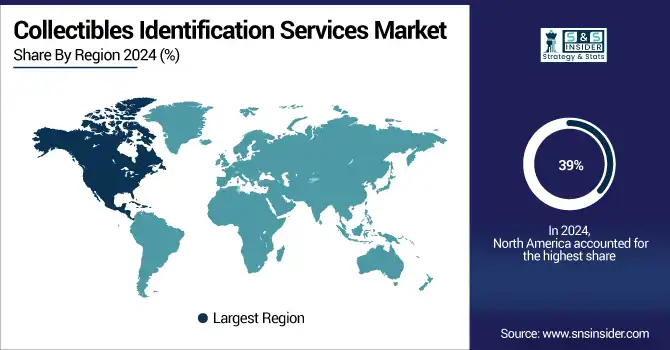
North America is the dominant region in the Collectibles Identification Services Market in 2024, with an estimated market share of 39%. High collector engagement, mature grading infrastructure, and widespread adoption of online identification platforms drive North America’s leadership. The United States leads the region, supported by industry pioneers like PCGS and NGC, digital authentication tools, and a strong network of auction houses and individual investors. In 2024, major providers introduced AI-powered grading systems and secure digital certification portals. These innovations strengthen the U.S. position as the regional hub for high-trust, technology-driven collectibles authentication and valuation services.
Asia Pacific is the fastest-growing region in the Collectibles Identification Services Market in 2024, with an estimated CAGR of 12.92%. Rising middle-class wealth, expanding auction participation, and mobile-first user behavior are accelerating market growth across the region. China dominates this fast-growing region due to deep cultural affinity for collectibles, strong demand for provenance research, and rapid digitization of identification platforms. In 2024, leading Chinese institutions like Rongbaozhai and Duoyunxuan launched mobile-enabled grading services and expanded blockchain-based certification. Backed by cultural preservation initiatives and technology adoption, China is setting the pace for modern identification services across Asia Pacific.
Europe’s strong heritage market and demand for provenance validation drive the Collectibles Identification Services Market in 2024. Institutional collecting, strict authenticity standards, and high-value art transactions support Europe’s market strength. Germany leads the region, driven by its thriving auction ecosystem, emphasis on fine art documentation, and digital transition in grading protocols. In 2024, German firms like Nagel introduced digital provenance reports and AI-supported appraisal systems. With a legacy of cultural stewardship and regulatory alignment, Germany anchors Europe’s trusted and increasingly digitized collectibles identification landscape.
In 2024, the collectibles identification services market in the Middle East & Africa (MEA) and Latin America gains momentum, driven by cultural revival and digitization. In MEA, the UAE leads with growing interest in art authentication and mobile-based verification tools supported by smart city strategies. Dubai’s rising number of private collectors and digital auction platforms highlights regional advancement. In Latin America, Brazil dominates due to a strong market for coins, sports memorabilia, and antique artifacts. In 2024, regional providers invested in localized grading facilities and launched mobile submission services, enabling scalable growth in culturally rich but previously underserved markets.
The collectibles identification services market companies are Professional Coin Grading Service, Numismatic Guaranty Corporation, Nagel, Bonhams, Sotheby's, Christie's Auction, Davids Auction, Skinners, Heritage Dallas, Susanina's Auctions, Bunte Auction, Tom Harris Marshall Town, Leslie Hindman Auctioneers, John Moran Auctioneers Inc, Poly, Guardian Auctions, Rongbaozhai, Duoyunxuan, Council International, Xiling Yinshe, and Others.
In February 2025, PCGS launched a revamped Online Coin Submission Portal (OSC 2.0), modernizing and streamlining the coin submission and grading experience with improved tools and efficiency for collectors submitting coins for authentication and grading service.
Report Attributes | Details |
---|---|
Market Size in 2024 | USD 2.50 Billion |
Market Size by 2032 | USD 5.30 Billion |
CAGR | CAGR of 9.84% From 2025 to 2032 |
Base Year | 2024 |
Forecast Period | 2025-2032 |
Historical Data | 2021-2023 |
Report Scope & Coverage | Market Size, Segments Analysis, Competitive Landscape, Regional Analysis, DROC & SWOT Analysis, Forecast Outlook |
Key Segments | • By Type of Collectibles (Artworks, Coins and Currency, Stamps, Toys and Games, Vintage Fashion) • By Service Type (Online Identification Services, In-Person Evaluation Services, Mobile App-based Identification, Subscription-based Services) • By Customer Type (Individual Collectors, Retailers and Dealers, Museums and Galleries, Investment Firms) • By Features Offered (Authentication Services, Valuation and Appraisal, Condition Reporting, Provenance Research, Documentation and Certification) |
Regional Analysis/Coverage | North America (US, Canada), Europe (Germany, UK, France, Italy, Spain, Russia, Poland, Rest of Europe), Asia Pacific (China, India, Japan, South Korea, Australia, ASEAN Countries, Rest of Asia Pacific), Middle East & Africa (UAE, Saudi Arabia, Qatar, South Africa, Rest of Middle East & Africa), Latin America (Brazil, Argentina, Mexico, Colombia, Rest of Latin America). |
Company Profiles | Professional Coin Grading Service, Numismatic Guaranty Corporation, Nagel, Bonhams, Sotheby's, Christie's Auction, Davids Auction, Skinners, Heritage Dallas, Susanina's Auctions, Bunte Auction, Tom Harris Marshall Town, Leslie Hindman Auctioneers, John Moran Auctioneers Inc, Poly, Guardian Auctions, Rongbaozhai, Duoyunxuan, Council International, Xiling Yinshe, and Others. |
Ans: The Collectibles Identification Services Market is expected to grow at a CAGR of 9.84% during 2025-2032.
Ans: The Collectibles Identification Services Market size was USD 2.50 billion in 2024 and is expected to reach USD 5.30 billion by 2032.
Ans: The major growth factor of the Collectibles Identification Services Market is the rising demand for authentication and valuation of high-value collectibles.
Ans: The Coins and Currency segment dominated the Collectibles Identification Services Market.
Ans: North America dominated the Collectibles Identification Services Market in 2024.
1. Introduction
1.1 Market Definition & Scope
1.2 Research Assumptions & Abbreviations
1.3 Research Methodology
2. Executive Summary
2.1 Market Snapshot
2.2 Market Absolute $ Opportunity Assessment & Y-o-Y Analysis, 2021–2032
2.3 Market Size & Forecast, By Segmentation, 2021–2032
2.3.1 Market Size By Type of Collectibles
2.3.2 Market Size By Customer Type
2.3.2 Market Size By Features Offered
2.3.2 Market Size By Security Type
2.4 Market Share & BPS Analysis By Region, 2024
2.5 Industry Growth Scenarios – Conservative, Likely & Optimistic
2.6 Industry CxO’s Perspective
3. Market Overview
3.1 Market Dynamics
3.1.1 Drivers
3.1.2 Restraints
3.1.3 Opportunities
3.1.4 Key Market Trends
3.2 Industry PESTLE Analysis
3.3 Key Industry Forces (Porter’s) Impacting Market Growth
3.4 Industry Supply Chain Analysis
3.4.1 Raw Material Suppliers
3.4.2 Manufacturers
3.4.3 Distributors/Suppliers
3.4.4 Customers/End-Users
3.5 Industry Life Cycle Assessment
3.6 Parent Market Overview
3.7 Market Risk Assessment
4. Statistical Insights & Trends Reporting
4.1 Service Accuracy & Performance Metrics
4.1.1 Average authentication accuracy rate (%) across different collectible categories (art, coins, sports memorabilia, comics)
4.1.2 Median turnaround time for completing identification services (in hours)
4.1.3 False identification rate (%) across manual vs. automated systems
4.1.4 Percentage of re-submissions due to unclear or disputed identification results
4.1.5 Industry-standard grading variance tolerance levels (e.g., +/- 2 grading points)
4.2 Operational Benchmarking Indicators
4.2.1 Average number of items authenticated per expert per month
4.2.2 Identification service throughput (items per day per facility)
4.2.3 Ratio of physical vs. digital submissions in top-tier firms
4.2.4 Number of authentication rejections due to counterfeit detection (%)
4.2.5 Client dispute resolution timeframes (median days to resolve)
4.3 Quality Control & Compliance Metrics
4.3.1 Share of providers certified under ISO 17020 or similar accreditation
4.3.2 Annual audit frequency (%) of collectible grading accuracy by third parties
4.3.3 Staff-to-item ratio in certified collectible authentication facilities
4.3.4 Percentage of insurance providers accepting identification reports from certified vendors
4.3.5 Number of legal claims filed per 10,000 authenticated items
4.4 Marketplace Integration & Logistics Stats
4.4.1 Proportion of marketplace listings that include third-party authentication certification (%)
4.4.2 Volume of cross-border authentication requests by region (North America, Europe, Asia-Pacific)
4.4.3 Authentication-linked sales uplift (%) for certified collectibles
4.4.4 Average shipping time (in days) for physical submission and return of collectibles
4.4.5 Authentication-related transaction failure rates on major collectibles platforms (%)
5. Collectibles Identification Services Market Segmental Analysis & Forecast, By Type of Collectibles, 2021 – 2032, Value (USD Billion)
5.1 Introduction
5.2 Artworks
5.2.1 Key Trends
5.2.2 Market Size & Forecast, 2021 – 2032
5.3 Coins and Currency
5.3.1 Key Trends
5.3.2 Market Size & Forecast, 2021 – 2032
5.4 Stamps
5.4.1 Key Trends
5.4.2 Market Size & Forecast, 2021 – 2032
5.5 Toys and Games
5.5.1 Key Trends
5.5.2 Market Size & Forecast, 2021 – 2032
5.6 Vintage Fashion
5.6.1 Key Trends
5.6.2 Market Size & Forecast, 2021 – 2032
6. Collectibles Identification Services Market Segmental Analysis & Forecast, By Customer Type, 2021 – 2032, Value (USD Billion)
6.1 Introduction
6.2 Individual Collectors
6.2.1 Key Trends
6.2.2 Market Size & Forecast, 2021 – 2032
6.3 Retailers and Dealers
6.3.1 Key Trends
6.3.2 Market Size & Forecast, 2021 – 2032
6.4 Museums and Galleries
6.4.1 Key Trends
6.4.2 Market Size & Forecast, 2021 – 2032
6.5 Investment Firms
6.5.1 Key Trends
6.5.2 Market Size & Forecast, 2021 – 2032
7. Collectibles Identification Services Market Segmental Analysis & Forecast, By Security Type, 2021 – 2032, Value (USD Billion)
7.1 Introduction
7.2 Online Identification Services
7.2.1 Key Trends
7.2.2 Market Size & Forecast, 2021 – 2032
7.3 In-Person Evaluation Services
7.3.1 Key Trends
7.3.2 Market Size & Forecast, 2021 – 2032
7.4 Mobile App-based Identification
7.4.1 Key Trends
7.4.2 Market Size & Forecast, 2021 – 2032
7.5 Subscription-based Services
7.5.1 Key Trends
7.5.2 Market Size & Forecast, 2021 – 2032
8. Collectibles Identification Services Market Segmental Analysis & Forecast, By Features Offered, 2021 – 2032, Value (USD Billion)
8.1 Introduction
8.2 Authentication services
8.2.1 Key Trends
8.2.2 Market Size & Forecast, 2021 – 2032
8.3 Valuation and Appraisal
8.3.1 Key Trends
8.3.2 Market Size & Forecast, 2021 – 2032
8.4 Condition Reporting
8.4.1 Key Trends
8.4.2 Market Size & Forecast, 2021 – 2032
8.5 Provenance Research
8.5.1 Key Trends
8.5.2 Market Size & Forecast, 2021 – 2032
8.6.4 Documentation and Certification
8.6.1 Key Trends
8.6.2 Market Size & Forecast, 2021 – 2032
9. Collectibles Identification Services Market Segmental Analysis & Forecast By Region, 2021 – 2025, Value (USD Billion)
9.1 Introduction
9.2 North America
9.2.1 Key Trends
9.2.2 Collectibles Identification Services Market Size & Forecast, By Type of Collectibles, 2021 – 2032
9.2.3 Collectibles Identification Services Market Size & Forecast, By Customer Type, 2021 – 2032
9.2.4 Collectibles Identification Services Market Size & Forecast, By Security Type, 2021 – 2032
9.2.5 Collectibles Identification Services Market Size & Forecast, By Features Offered, 2021 – 2032
9.2.6 Collectibles Identification Services Market Size & Forecast, By Country, 2021 – 2032
9.2.6.1 USA
9.2.6.1.1 Collectibles Identification Services Market Size & Forecast, By Type of Collectibles, 2021 – 2032
9.2.6.1.2 Collectibles Identification Services Market Size & Forecast, By Customer Type, 2021 – 2032
9.2.6.1.3 Collectibles Identification Services Market Size & Forecast, By Security Type, 2021 – 2032
9.2.6.1.4 Collectibles Identification Services Market Size & Forecast, By Features Offered, 2021 – 2032
9.2.6.2 Canada
9.2.6.2.1 Collectibles Identification Services Market Size & Forecast, By Type of Collectibles, 2021 – 2032
9.2.6.2.2 Collectibles Identification Services Market Size & Forecast, By Customer Type, 2021 – 2032
9.2.6.2.3 Collectibles Identification Services Market Size & Forecast, By Security Type, 2021 – 2032
9.2.6.2.4 Collectibles Identification Services Market Size & Forecast, By Features Offered, 2021 – 2032
9.3 Europe
9.3.1 Key Trends
9.3.2 Collectibles Identification Services Market Size & Forecast, By Type of Collectibles, 2021 – 2032
9.3.3 Collectibles Identification Services Market Size & Forecast, By Customer Type, 2021 – 2032
9.3.4 Collectibles Identification Services Market Size & Forecast, By Security Type, 2021 – 2032
9.3.5 Collectibles Identification Services Market Size & Forecast, By Features Offered, 2021 – 2032
9.3.6 Collectibles Identification Services Market Size & Forecast, By Country, 2021 – 2032
9.3.6.1 Germany
9.3.6.1.1 Collectibles Identification Services Market Size & Forecast, By Type of Collectibles, 2021 – 2032
9.3.6.1.2 Collectibles Identification Services Market Size & Forecast, By Customer Type, 2021 – 2032
9.3.6.1.3 Collectibles Identification Services Market Size & Forecast, By Security Type, 2021 – 2032
9.3.6.1.4 Collectibles Identification Services Market Size & Forecast, By Features Offered, 2021 – 2032
9.3.6.2 UK
9.3.6.2.1 Collectibles Identification Services Market Size & Forecast, By Type of Collectibles, 2021 – 2032
9.3.6.2.2 Collectibles Identification Services Market Size & Forecast, By Customer Type, 2021 – 2032
9.3.6.2.3 Collectibles Identification Services Market Size & Forecast, By Security Type, 2021 – 2032
9.3.6.2.4 Collectibles Identification Services Market Size & Forecast, By Features Offered, 2021 – 2032
9.3.6.3 France
9.3.6.3.1 Collectibles Identification Services Market Size & Forecast, By Type of Collectibles, 2021 – 2032
9.3.6.3.2 Collectibles Identification Services Market Size & Forecast, By Customer Type, 2021 – 2032
9.3.6.3.3 Collectibles Identification Services Market Size & Forecast, By Security Type, 2021 – 2032
9.3.6.3.4 Collectibles Identification Services Market Size & Forecast, By Features Offered, 2021 – 2032
9.3.6.4 Italy
9.3.6.4.1 Collectibles Identification Services Market Size & Forecast, By Type of Collectibles, 2021 – 2032
9.3.6.4.2 Collectibles Identification Services Market Size & Forecast, By Customer Type, 2021 – 2032
9.3.6.4.3 Collectibles Identification Services Market Size & Forecast, By Security Type, 2021 – 2032
9.3.6.4.4 Collectibles Identification Services Market Size & Forecast, By Features Offered, 2021 – 2032
9.3.6.5 Spain
9.3.6.5.1 Collectibles Identification Services Market Size & Forecast, By Type of Collectibles, 2021 – 2032
9.3.6.5.2 Collectibles Identification Services Market Size & Forecast, By Customer Type, 2021 – 2032
9.3.6.5.3 Collectibles Identification Services Market Size & Forecast, By Security Type, 2021 – 2032
9.3.6.5.4 Collectibles Identification Services Market Size & Forecast, By Features Offered, 2021 – 2032
9.3.6.6 Russia
9.3.6.6.1 Collectibles Identification Services Market Size & Forecast, By Type of Collectibles, 2021 – 2032
9.3.6.6.2 Collectibles Identification Services Market Size & Forecast, By Customer Type, 2021 – 2032
9.3.6.6.3 Collectibles Identification Services Market Size & Forecast, By Security Type, 2021 – 2032
9.3.6.6.4 Collectibles Identification Services Market Size & Forecast, By Features Offered, 2021 – 2032
9.3.6.7 Poland
9.3.6.7.1 Collectibles Identification Services Market Size & Forecast, By Type of Collectibles, 2021 – 2032
9.3.6.7.2 Collectibles Identification Services Market Size & Forecast, By Customer Type, 2021 – 2032
9.3.6.7.3 Collectibles Identification Services Market Size & Forecast, By Security Type, 2021 – 2032
9.3.6.7.4 Collectibles Identification Services Market Size & Forecast, By Features Offered, 2021 – 2032
9.3.6.8 Rest of Europe
9.3.6.8.1 Collectibles Identification Services Market Size & Forecast, By Type of Collectibles, 2021 – 2032
9.3.6.8.2 Collectibles Identification Services Market Size & Forecast, By Customer Type, 2021 – 2032
9.3.6.8.3 Collectibles Identification Services Market Size & Forecast, By Security Type, 2021 – 2032
9.3.6.8.4 Collectibles Identification Services Market Size & Forecast, By Features Offered, 2021 – 2032
9.4 Asia-Pacific
9.4.1 Key Trends
9.4.2 Collectibles Identification Services Market Size & Forecast, By Type of Collectibles, 2021 – 2032
9.4.3 Collectibles Identification Services Market Size & Forecast, By Customer Type, 2021 – 2032
9.4.4 Collectibles Identification Services Market Size & Forecast, By Security Type, 2021 – 2032
9.4.5 Collectibles Identification Services Market Size & Forecast, By Features Offered, 2021 – 2032
9.4.6 Collectibles Identification Services Market Size & Forecast, By Country, 2021 – 2032
9.4.6.1 China
9.4.6.1.1 Collectibles Identification Services Market Size & Forecast, By Type of Collectibles, 2021 – 2032
9.4.6.1.2 Collectibles Identification Services Market Size & Forecast, By Customer Type, 2021 – 2032
9.4.6.1.3 Collectibles Identification Services Market Size & Forecast, By Security Type, 2021 – 2032
9.4.6.1.4 Collectibles Identification Services Market Size & Forecast, By Features Offered, 2021 – 2032
9.4.6.2 India
9.4.6.2.1 Collectibles Identification Services Market Size & Forecast, By Type of Collectibles, 2021 – 2032
9.4.6.2.2 Collectibles Identification Services Market Size & Forecast, By Customer Type, 2021 – 2032
9.4.6.2.3 Collectibles Identification Services Market Size & Forecast, By Security Type, 2021 – 2032
9.4.6.2.4 Collectibles Identification Services Market Size & Forecast, By Features Offered, 2021 – 2032
9.4.6.3 Japan
9.4.6.3.1 Collectibles Identification Services Market Size & Forecast, By Type of Collectibles, 2021 – 2032
9.4.6.3.2 Collectibles Identification Services Market Size & Forecast, By Customer Type, 2021 – 2032
9.4.6.3.3 Collectibles Identification Services Market Size & Forecast, By Security Type, 2021 – 2032
9.4.6.3.4 Collectibles Identification Services Market Size & Forecast, By Features Offered, 2021 – 2032
9.4.6.4 South Korea
9.4.6.4.1 Collectibles Identification Services Market Size & Forecast, By Type of Collectibles, 2021 – 2032
9.4.6.4.2 Collectibles Identification Services Market Size & Forecast, By Customer Type, 2021 – 2032
9.4.6.4.3 Collectibles Identification Services Market Size & Forecast, By Security Type, 2021 – 2032
9.4.6.4.4 Collectibles Identification Services Market Size & Forecast, By Features Offered, 2021 – 2032
9.4.6.5 Australia
9.4.6.5.1 Collectibles Identification Services Market Size & Forecast, By Type of Collectibles, 2021 – 2032
9.4.6.5.2 Collectibles Identification Services Market Size & Forecast, By Customer Type, 2021 – 2032
9.4.6.5.3 Collectibles Identification Services Market Size & Forecast, By Security Type, 2021 – 2032
9.4.6.5.4 Collectibles Identification Services Market Size & Forecast, By Features Offered, 2021 – 2032
9.4.6.6 ASEAN Countries
9.4.6.6.1 Collectibles Identification Services Market Size & Forecast, By Type of Collectibles, 2021 – 2032
9.4.6.6.2 Collectibles Identification Services Market Size & Forecast, By Customer Type, 2021 – 2032
9.4.6.6.3 Collectibles Identification Services Market Size & Forecast, By Security Type, 2021 – 2032
9.4.6.6.4 Collectibles Identification Services Market Size & Forecast, By Features Offered, 2021 – 2032
9.4.6.7 Rest of Asia-Pacific
9.4.6.7.1 Collectibles Identification Services Market Size & Forecast, By Type of Collectibles, 2021 – 2032
9.4.6.7.2 Collectibles Identification Services Market Size & Forecast, By Customer Type, 2021 – 2032
9.4.6.7.3 Collectibles Identification Services Market Size & Forecast, By Security Type, 2021 – 2032
9.4.6.7.4 Collectibles Identification Services Market Size & Forecast, By Features Offered, 2021 – 2032
9.5 Latin America
9.5.1 Key Trends
9.5.2 Collectibles Identification Services Market Size & Forecast, By Type of Collectibles, 2021 – 2032
9.5.3 Collectibles Identification Services Market Size & Forecast, By Customer Type, 2021 – 2032
9.5.4 Collectibles Identification Services Market Size & Forecast, By Security Type, 2021 – 2032
9.5.5 Collectibles Identification Services Market Size & Forecast, By Features Offered, 2021 – 2032
9.5.6 Collectibles Identification Services Market Size & Forecast, By Country, 2021 – 2032
9.5.6.1 Brazil
9.5.6.1.1 Collectibles Identification Services Market Size & Forecast, By Type of Collectibles, 2021 – 2032
9.5.6.1.2 Collectibles Identification Services Market Size & Forecast, By Customer Type, 2021 – 2032
9.5.6.1.3 Collectibles Identification Services Market Size & Forecast, By Security Type, 2021 – 2032
9.5.6.1.4 Collectibles Identification Services Market Size & Forecast, By Features Offered, 2021 – 2032
9.5.6.2 Argentina
9.5.6.2.1 Collectibles Identification Services Market Size & Forecast, By Type of Collectibles, 2021 – 2032
9.5.6.2.2 Collectibles Identification Services Market Size & Forecast, By Customer Type, 2021 – 2032
9.5.6.2.3 Collectibles Identification Services Market Size & Forecast, By Security Type, 2021 – 2032
9.5.6.2.4 Collectibles Identification Services Market Size & Forecast, By Features Offered, 2021 – 2032
9.5.6.3 Mexico
9.5.6.3.1 Collectibles Identification Services Market Size & Forecast, By Type of Collectibles, 2021 – 2032
9.5.6.3.2 Collectibles Identification Services Market Size & Forecast, By Customer Type, 2021 – 2032
9.5.6.3.3 Collectibles Identification Services Market Size & Forecast, By Security Type, 2021 – 2032
9.5.6.3.4 Collectibles Identification Services Market Size & Forecast, By Features Offered, 2021 – 2032
9.5.6.4 Colombia
9.5.6.4.1 Collectibles Identification Services Market Size & Forecast, By Type of Collectibles, 2021 – 2032
9.5.6.4.2 Collectibles Identification Services Market Size & Forecast, By Customer Type, 2021 – 2032
9.5.6.4.3 Collectibles Identification Services Market Size & Forecast, By Security Type, 2021 – 2032
9.5.6.4.4 Collectibles Identification Services Market Size & Forecast, By Features Offered, 2021 – 2032
9.5.6.5 Rest of Latin America
9.5.6.5.1 Collectibles Identification Services Market Size & Forecast, By Type of Collectibles, 2021 – 2032
9.5.6.5.2 Collectibles Identification Services Market Size & Forecast, By Customer Type, 2021 – 2032
9.5.6.5.3 Collectibles Identification Services Market Size & Forecast, By Security Type, 2021 – 2032
9.5.6.5.4 Collectibles Identification Services Market Size & Forecast, By Features Offered, 2021 – 2032
9.6 Middle East & Africa
9.6.1 Key Trends
9.6.2 Collectibles Identification Services Market Size & Forecast, By Type of Collectibles, 2021 – 2032
9.6.3 Collectibles Identification Services Market Size & Forecast, By Customer Type, 2021 – 2032
9.6.4 Collectibles Identification Services Market Size & Forecast, By Security Type, 2021 – 2032
9.6.5 Collectibles Identification Services Market Size & Forecast, By Features Offered, 2021 – 2032
9.6.6 Collectibles Identification Services Market Size & Forecast, By Country, 2021 – 2032
9.6.6.1 UAE
9.6.6.1.1 Collectibles Identification Services Market Size & Forecast, By Type of Collectibles, 2021 – 2032
9.6.6.1.2 Collectibles Identification Services Market Size & Forecast, By Customer Type, 2021 – 2032
9.6.6.1.3 Collectibles Identification Services Market Size & Forecast, By Security Type, 2021 – 2032
9.6.6.1.4 Collectibles Identification Services Market Size & Forecast, By Features Offered, 2021 – 2032
9.6.6.2 Saudi Arabia
9.6.6.2.1 Collectibles Identification Services Market Size & Forecast, By Type of Collectibles, 2021 – 2032
9.6.6.2.2 Collectibles Identification Services Market Size & Forecast, By Customer Type, 2021 – 2032
9.6.6.2.3 Collectibles Identification Services Market Size & Forecast, By Security Type, 2021 – 2032
9.6.6.2.4 Collectibles Identification Services Market Size & Forecast, By Features Offered, 2021 – 2032
9.6.6.3 Qatar
9.6.6.3.1 Collectibles Identification Services Market Size & Forecast, By Type of Collectibles, 2021 – 2032
9.6.6.3.2 Collectibles Identification Services Market Size & Forecast, By Customer Type, 2021 – 2032
9.6.6.3.3 Collectibles Identification Services Market Size & Forecast, By Security Type, 2021 – 2032
9.6.6.3.4 Collectibles Identification Services Market Size & Forecast, By Features Offered, 2021 – 2032
9.6.6.4 Egypt
9.6.6.4.1 Collectibles Identification Services Market Size & Forecast, By Type of Collectibles, 2021 – 2032
9.6.6.4.2 Collectibles Identification Services Market Size & Forecast, By Customer Type, 2021 – 2032
9.6.6.4.3 Collectibles Identification Services Market Size & Forecast, By Security Type, 2021 – 2032
9.6.6.4.4 Collectibles Identification Services Market Size & Forecast, By Features Offered, 2021 – 2032
9.6.6.5 South Africa
9.6.6.5.1 Collectibles Identification Services Market Size & Forecast, By Type of Collectibles, 2021 – 2032
9.6.6.5.2 Collectibles Identification Services Market Size & Forecast, By Customer Type, 2021 – 2032
9.6.6.5.3 Collectibles Identification Services Market Size & Forecast, By Security Type, 2021 – 2032
9.6.6.5.4 Collectibles Identification Services Market Size & Forecast, By Features Offered, 2021 – 2032
9.6.6.6 Rest of Middle East & Africa
9.6.6.6.1 Collectibles Identification Services Market Size & Forecast, By Type of Collectibles, 2021 – 2032
9.6.6.6.2 Collectibles Identification Services Market Size & Forecast, By Customer Type, 2021 – 2032
9.6.6.6.3 Collectibles Identification Services Market Size & Forecast, By Security Type, 2021 – 2032
9.6.6.6.4 Collectibles Identification Services Market Size & Forecast, By Features Offered, 2021 – 2032
10. Competitive Landscape
10.1 Key Players' Positioning
10.2 Competitive Developments
10.2.1 Key Strategies Adopted (%), By Key Players, 2024
10.2.2 Year-Wise Strategies & Development, 2021 – 2025
10.2.3 Number Of Strategies Adopted By Key Players, 2024
10.3 Market Share Analysis, 2024
10.4 Product/Service & Application Benchmarking
10.4.1 Product/Service Specifications & Features By Key Players
10.4.2 Product/Service Heatmap By Key Players
10.4.3 Application Heatmap By Key Players
10.5 Industry Start-Up & Innovation Landscape
10.6 Key Company Profiles
10.6.1 Professional Coin Grading Service
10.6.1.1 Company Overview & Snapshot
10.6.1.2 Product/Service Portfolio
10.6.1.3 Key Company Financials
10.6.1.4 SWOT Analysis
10.6.2 Numismatic Guaranty Corporation
10.6.2.1 Company Overview & Snapshot
10.6.2.2 Product/Service Portfolio
10.6.2.3 Key Company Financials
10.6.2.4 SWOT Analysis
10.6.3 Nagel
10.6.3.1 Company Overview & Snapshot
10.6.3.2 Product/Service Portfolio
10.6.3.3 Key Company Financials
10.6.3.4 SWOT Analysis
10.6.4 Bonhams
10.6.4.1 Company Overview & Snapshot
10.6.4.2 Product/Service Portfolio
10.6.4.3 Key Company Financials
10.6.4.4 SWOT Analysis
10.6.5 Sotheby's
10.6.5.1 Company Overview & Snapshot
10.6.5.2 Product/Service Portfolio
10.6.5.3 Key Company Financials
10.6.5.4 SWOT Analysis
10.6.6 Christie's Auction
10.6.6.1 Company Overview & Snapshot
10.6.6.2 Product/Service Portfolio
10.6.6.3 Key Company Financials
10.6.6.4 SWOT Analysis
10.6.7 Davids Auction
10.6.7.1 Company Overview & Snapshot
10.6.7.2 Product/Service Portfolio
10.6.7.3 Key Company Financials
10.6.7.4 SWOT Analysis
10.6.8 Skinners
10.6.8.1 Company Overview & Snapshot
10.6.8.2 Product/Service Portfolio
10.6.8.3 Key Company Financials
10.6.8.4 SWOT Analysis
10.6.9 Heritage Dallas
10.6.9.1 Company Overview & Snapshot
10.6.9.2 Product/Service Portfolio
10.6.9.3 Key Company Financials
10.6.9.4 SWOT Analysis
10.6.10 Susanina's Auctions
10.6.10.1 Company Overview & Snapshot
10.6.10.2 Product/Service Portfolio
10.6.10.3 Key Company Financials
10.6.10.4 SWOT Analysis
10.6.11 Bunte Auction
10.6.11.1 Company Overview & Snapshot
10.6.11.2 Product/Service Portfolio
10.6.11.3 Key Company Financials
10.6.11.4 SWOT Analysis
10.6.12 Tom Harris Marshall Town
10.6.12.1 Company Overview & Snapshot
10.6.12.2 Product/Service Portfolio
10.6.12.3 Key Company Financials
10.6.12.4 SWOT Analysis
10.6.13 Leslie Hindman Auctioneers
10.6.13.1 Company Overview & Snapshot
10.6.13.2 Product/Service Portfolio
10.6.13.3 Key Company Financials
10.6.13.4 SWOT Analysis
10.6.14 John Moran Auctioneers Inc
10.6.14.1 Company Overview & Snapshot
10.6.14.2 Product/Service Portfolio
10.6.14.3 Key Company Financials
10.6.14.4 SWOT Analysis
10.6.15 Poly
10.6.15.1 Company Overview & Snapshot
10.6.15.2 Product/Service Portfolio
10.6.15.3 Key Company Financials
10.6.15.4 SWOT Analysis
10.6.16 Guardian Auctions
10.6.16.1 Company Overview & Snapshot
10.6.16.2 Product/Service Portfolio
10.6.16.3 Key Company Financials
10.6.16.4 SWOT Analysis
10.6.17 Rongbaozhai
10.6.17.1 Company Overview & Snapshot
10.6.17.2 Product/Service Portfolio
10.6.17.3 Key Company Financials
10.6.17.4 SWOT Analysis
10.6.18 Duoyunxuan
10.6.18.1 Company Overview & Snapshot
10.6.18.2 Product/Service Portfolio
10.6.18.3 Key Company Financials
10.6.18.4 SWOT Analysis
10.6.19 Council International
10.6.19.1 Company Overview & Snapshot
10.6.19.2 Product/Service Portfolio
10.6.19.3 Key Company Financials
10.6.19.4 SWOT Analysis
10.6.20 Xiling Yinshe
10.6.20.1 Company Overview & Snapshot
10.6.20.2 Product/Service Portfolio
10.6.20.3 Key Company Financials
10.6.20.4 SWOT Analysis
11. Analyst Recommendations
11.1 SNS Insider Opportunity Map
11.2 Industry Low-Hanging Fruit Assessment
11.3 Market Entry & Growth Strategy
11.4 Analyst Viewpoint & Suggestions On Market Growth
12. Assumptions
13. Disclaimer
14. Appendix
14.1 List Of Tables
14.2 List Of Figures
An accurate research report requires proper strategizing as well as implementation. There are multiple factors involved in the completion of good and accurate research report and selecting the best methodology to compete the research is the toughest part. Since the research reports we provide play a crucial role in any company’s decision-making process, therefore we at SNS Insider always believe that we should choose the best method which gives us results closer to reality. This allows us to reach at a stage wherein we can provide our clients best and accurate investment to output ratio.
Each report that we prepare takes a timeframe of 350-400 business hours for production. Starting from the selection of titles through a couple of in-depth brain storming session to the final QC process before uploading our titles on our website we dedicate around 350 working hours. The titles are selected based on their current market cap and the foreseen CAGR and growth.
The 5 steps process:
Step 1: Secondary Research:
Secondary Research or Desk Research is as the name suggests is a research process wherein, we collect data through the readily available information. In this process we use various paid and unpaid databases which our team has access to and gather data through the same. This includes examining of listed companies’ annual reports, Journals, SEC filling etc. Apart from this our team has access to various associations across the globe across different industries. Lastly, we have exchange relationships with various university as well as individual libraries.
Step 2: Primary Research
When we talk about primary research, it is a type of study in which the researchers collect relevant data samples directly, rather than relying on previously collected data. This type of research is focused on gaining content specific facts that can be sued to solve specific problems. Since the collected data is fresh and first hand therefore it makes the study more accurate and genuine.
We at SNS Insider have divided Primary Research into 2 parts.
Part 1 wherein we interview the KOLs of major players as well as the upcoming ones across various geographic regions. This allows us to have their view over the market scenario and acts as an important tool to come closer to the accurate market numbers. As many as 45 paid and unpaid primary interviews are taken from both the demand and supply side of the industry to make sure we land at an accurate judgement and analysis of the market.
This step involves the triangulation of data wherein our team analyses the interview transcripts, online survey responses and observation of on filed participants. The below mentioned chart should give a better understanding of the part 1 of the primary interview.
Part 2: In this part of primary research the data collected via secondary research and the part 1 of the primary research is validated with the interviews from individual consultants and subject matter experts.
Consultants are those set of people who have at least 12 years of experience and expertise within the industry whereas Subject Matter Experts are those with at least 15 years of experience behind their back within the same space. The data with the help of two main processes i.e., FGDs (Focused Group Discussions) and IDs (Individual Discussions). This gives us a 3rd party nonbiased primary view of the market scenario making it a more dependable one while collation of the data pointers.
Step 3: Data Bank Validation
Once all the information is collected via primary and secondary sources, we run that information for data validation. At our intelligence centre our research heads track a lot of information related to the market which includes the quarterly reports, the daily stock prices, and other relevant information. Our data bank server gets updated every fortnight and that is how the information which we collected using our primary and secondary information is revalidated in real time.
Step 4: QA/QC Process
After all the data collection and validation our team does a final level of quality check and quality assurance to get rid of any unwanted or undesired mistakes. This might include but not limited to getting rid of the any typos, duplication of numbers or missing of any important information. The people involved in this process include technical content writers, research heads and graphics people. Once this process is completed the title gets uploader on our platform for our clients to read it.
Step 5: Final QC/QA Process:
This is the last process and comes when the client has ordered the study. In this process a final QA/QC is done before the study is emailed to the client. Since we believe in giving our clients a good experience of our research studies, therefore, to make sure that we do not lack at our end in any way humanly possible we do a final round of quality check and then dispatch the study to the client.
By Type of Collectibles
Artworks
Coins and Currency
Stamps
Toys and Games
Vintage Fashion
By Service Type
Online Identification Services
In-Person Evaluation Services
Mobile App-based Identification
Subscription-based Services
By Customer Type
Individual Collectors
Retailers and Dealers
Museums and Galleries
Investment Firms
By Features Offered
Authentication services
Valuation and Appraisal
Condition Reporting
Provenance Research
Documentation and Certification
Request for Segment Customization as per your Business Requirement: Segment Customization Request
Regional Coverage:
North America
US
Canada
Europe
Germany
France
UK
Italy
Spain
Poland
Russia
Rest of Europe
Asia Pacific
China
India
Japan
South Korea
Australia
ASEAN Countries
Rest of Asia Pacific
Middle East & Africa
UAE
Saudi Arabia
Qatar
South Africa
Rest of Middle East & Africa
Latin America
Brazil
Argentina
Mexico
Colombia
Rest of Latin America
Request for Country Level Research Report: Country Level Customization Request
Available Customization
With the given market data, SNS Insider offers customization as per the company’s specific needs. The following customization options are available for the report:
Detailed Volume Analysis
Criss-Cross segment analysis (e.g. Product X Application)
Competitive Product Benchmarking
Geographic Analysis
Additional countries in any of the regions
Customized Data Representation
Detailed analysis and profiling of additional market players