image

Data Center Busway Market Size, Share & Segmentation By Product Type (Air Splicing Busway (BMC), Intensive Insulation Plug Busway (CMC), High Strength Enclosed Busway (CFW), Power Distribution Units (PDUs), Others), Type (3-Phase 4-Wire, 3-Phase 5-Wire, Others), Implementation (Raised Floor, Ceiling Overhead), By Current Ampere (Low, High), Vertical (Banking, Financial Services and Insurance (BFSI), IT & Telecom, Government & Defence, Healthcare, Retail & E-commerce, Research & Academia, Energy & Utilities, Manufacturing, Others), End Use (Colocation Data Centers, Enterprise Data Centers, Cloud Data Centers), Region | Global Forecast 2025-2032

Date: July 2025 Report Code: SNS/ICT/7734 Page 320

Data Center Busway Market Report Scope & Overview:

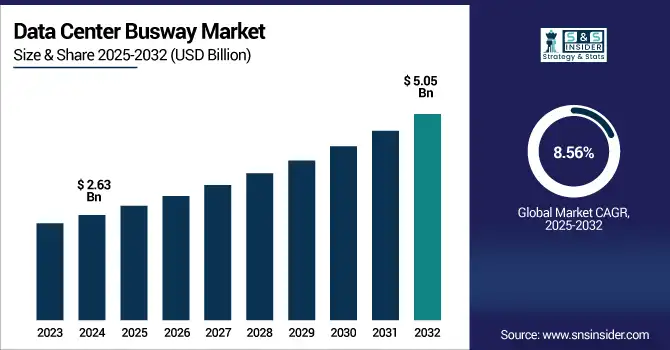
Data Center Busway Market size was valued at USD 2.63 billion in 2024 and is expected to reach USD 5.05 billion by 2032, growing at a CAGR of 8.56% from 2025-2032. 

 Data Center Busway Market revenue analysis

To Get more information on Data Center Busway Market - Request Free Sample Report

The Data Center Busway Market growth  is primarily driven by the rising demand for scalable and energy-efficient power distribution solutions in modern data centers. With increasing data consumption, cloud computing, and AI workloads, data centers are expanding rapidly, requiring reliable and flexible power infrastructure. Busway systems offer advantages such as reduced installation time, ease of reconfiguration, and better thermal performance compared to traditional cabling. Additionally, the growing focus on green data centers and the integration of modular designs are further fueling adoption. Increased investments in hyperscale facilities and edge data centers also contribute significantly to market expansion.

  • The U.S. hosts roughly 142 million sq ft of data center space, with Digital Realty, Meta, Google, and Microsoft accounting for nearly 48% of this total footprint, highlighting the scale of infrastructure that demands high-performance and efficient power systems.

  • Modular and sustainable data center design is gaining traction, with standards bodies such as the EMerge Alliance (380 Vdc) and BICSI (DC-PDS) promoting DC-based busway architectures for compatibility with renewable energy and rapid modular deployment.

  • Responding to this shift, Schneider Electric's I‑Line Track Medium‑Power Busway is designed to be 60% more compact, features patented plug-in tap-offs, offers intelligent energy monitoring, and holds ASTA-certified reliability, supporting next-generation data center requirements.

U.S. Data Center Busway Market size was valued at USD 0.72 billion in 2024 and is expected to reach USD 1.37 billion by 2032, growing at a CAGR of 8.28% from 2025-2032. 

The U.S. Data Center Busway Market is growing due to rising demand for scalable, energy-efficient power solutions in hyperscale and colocation facilities. Busways offer flexibility, faster installation, and better thermal management than traditional cabling, aligning with growing cloud adoption, AI workloads, and sustainability initiatives across the data center landscape.

Market Dynamics

Drivers

  • Rising Demand For Scalable And Energy-Efficient Power Distribution Solutions In Hyperscale And Colocation Data Centers Accelerates Busway System Adoption.

High Density, Modular and Energy Efficient Power Infrastructure Aiding Growing Adoption of Hyperscale and Colocation Data Centers Solution such as busway systems provide a scalable yet flexible form of power distribution that can match the growing complexity of today data center. Ideal for dynamic set-ups, they can adapt to changing IT loads without all the major rewiring. Busways help to save money in operational costs due to their lower energy wastage and maintenance needs. Busway systems arise as a sustainable power distribution solution for data centers that are becoming modular and power-hungry.

  • Microsoft continues massive investment in hyperscale campuses, recently committing USD 1.5 billion to build 10 data centers near Castroville, Texas, including sites covering 250,000 sq ft and 489,000 sq ft, with construction extending through mid-2027. Microsoft’s Quincy site in Washington champions scalable modular design, high-density cooling, and integration of power-efficient busway-like systems.

  • Similarly, the “Stargate” AI data center project in Texas led by Oracle, OpenAI, and SoftBank has begun construction on a 480,000 sq ft building with a planned investment of USD 1.1 billion, further illustrating the scale and momentum behind modular, high-power data center campuses.

Restraints

  • Limited Awareness And Technical Expertise Among Facility Operators In Emerging Economies Restrict Large-Scale Implementation Of Busway Solutions.

In the emerging regions, some of the data center operators still use old cabling systems, since the overall level of knowledge and abilities in busway technology are still low. Deployment is complicated especially in load balancing, safety and layout design, whilst the required skill set is unavailable in local area in most cases. This gap in knowledge, combined with limited vendor support and training, is a barrier to adoption. The smaller class/data centers and Tier II or III data centers, however, are arming and hesitant to make the move for penetration is slow and the busway system is not in wide use in emerging markets.

Opportunities

  • Integration Of AI And Iot In Data Centers Boosts Demand For Adaptive Power Infrastructure, Opening Up New Roles For Smart Busway Systems.

The emergence AI-based workloads and IoT-based monitoring is driving demand for intelligent and reconfigurable power systems in data centers. Newer busway technology has evolved with smart modules that allow for real-time power monitoring, thermal tracking, and fault detection. These features enable operators to more effectively control dynamic loads, optimize energy usage and increase system uptime. As data centers get smarter, sensor integration and analytics in busway systems open the door for vendors to provide value-added offerings such as predictive maintenance, automatic fault response, and digital twin infrastructure modeling.

  • Compass Datacenters, in collaboration with Schneider Electric, deployed AI-enabled sensors and analytics across power and cooling systems achieving 40% fewer on-site maintenance interventions and a 20% reduction in operational expenses through condition-based, predictive maintenance.

  • Further strengthening this trend, Schneider Electric introduced the Galaxy VXL UPS, a compact and modular 1.25 MW unit with integrated intelligence, which enables real-time monitoring while reducing physical footprint by 52%.

Challenges

  • Complex Integration With Legacy Power Infrastructure Complicates Busway Adoption In Existing Data Center Environments, Requiring Costly Design Modifications.

Retrofit installations with busway systems encounters problems because of the incompatibility with the existing wiring of the legacy and existing power layout. Connecting busways to existing switchgear, rack layout and ceiling limitations is complicated and custom, driving costs and delivery schedules. Historically, older buildings are also less adaptable and don’t meet current safety requirements, which complicates integration. Moreover, the time it takes to shut down and switch over to new lights is unappealing as most facilities simply cannot afford to turn down and risk an outage. The rail-based systems due to such reasons are not ideal for installs and are restricted in their adoption in the retrofits as well as in some configuration of the datacenter market.

  • According to Eaton, key components such as busways and power cables have a typical service life of 8–20 years, while switchgear and transformers last 20+ years, further necessitating modernization in legacy environments where aging infrastructure presents an additional barrier to seamless integration.

Segment Analysis

By Implementation

Raised floor systems led the Data Center Busway Market in 2024 with a revenue share of 55%, supported by the long-standing integration of raised floor in conventional data center constructions. They offer efficient cable management, underfloor cooling, and system upgrades, making them perfect for high-density IT environments. Their familiarity and adaptability provide continued demand in both legacy upgrade and greenfield modular data centre projects worldwide.

Ceiling overhead systems are projected to grow at the fastest CAGR of 9.53% from 2025 to 2032, due to growing demand for space-efficient and airflow efficient facilities. They provide improved thermal management and reduce cabling under raised floors. With greenfield and hyperscale facilities requiring cleaner, more scalable power distribution, overhead busways provide ease of deployment and future-proofing, and this is driving a rapid adoption across North America, Asia‐Pacific, and Europe.

By Vertical

The IT & Telecom segment dominated the Data Center Busway Market share in 2024 of a 29%, due to the high infrastructure demand in data processing, storage, and real-time communication. Telecom operators and IT service providers also need steady, scalable power provisioning. Busway systems are designed to provide the flexibility, redundancy and high energy efficiency required to power the backbone of worldwide connectivity and cloud computing.

Retail & E-commerce is expected to grow at the fastest CAGR of 12.35% from 2025 to 2032, as companies scale infrastructure to meet digital demand. Power-hungry applications, such as big data analytics and health monitoring, and real-time logistics demand highly scalable power distribution. Thanks to busways which allow fast expansion, a decrease in installation complexity, and they are aimed perfectly at the changing operational requirements of omni-channel and e-commerce platforms.

By Product Type

Power Distribution Units (PDUs) held the largest share of the Data Center Busway Market in 2024 at 34%, owing to their critical role in all data centers. They provide precise control, load balancing, and monitoring across racks. They offer fine-grained control deployment and monitoring at rack level. Their underlying value proposition of maintaining power availability and safety in high-density settings makes PDUs indispensable for both on-premises and colo data centers, driving ongoing market demand.

Air Splicing Busway (BMC) is projected to grow at the highest CAGR of 10.42% from 2025 to 2032, owing to its excellent heat dissipation and energy saving. BMC systems reduce transmission losses, can carry much higher currents, thus providing modularity with lower maintenance cost. Such qualities are proving more critical for data centers in cutting down on energy footprints as well as performance in larger high-density IT environments.

By End Use

Colocation data centers led the Data Center Busway Market in 2024 with a 40% revenue share, as business organizations across the globe are outsourcing their infrastructure to minimize their investments and facilitate concentration on their core business activities. Colocation centers are multi-tenant facilities in need of scalable, secure, and readily applicable power solutions. Busway Solutions Busway systems are the answer, providing the flexibility and high capacity power delivery required in shared, high-density spaces.

Cloud data centers are expected to grow at the fastest CAGR of 10.35% from 2025 to 2032, driven by the burgeoning requirement for hyperscale cloud services in various end-use sectors. Global campuses of organisations are mushrooming, which need modular power distribution systems with space-saving, efficient features. Busways provide easy connectivity to smart monitoring systems and also can respond to dynamic load requirements, key to hyperscale operational aspirations of agility, speed, and energy efficiency.

By Type

3-Phase 5-Wire segment dominated the Data Center Busway Market in 2024 with a 50% revenue share due to its ability to support high-capacity, balanced power loads essential for modern data centers. This configuration ensures better voltage stability, phase balancing, and reduced electrical losses, which are critical for large-scale server environments. It is also projected to grow at the fastest CAGR of 9.59% from 2025 to 2032, as hyperscale and colocation facilities increasingly adopt high-efficiency, modular, and scalable power distribution systems to meet escalating data processing demands.

By Current Ampere

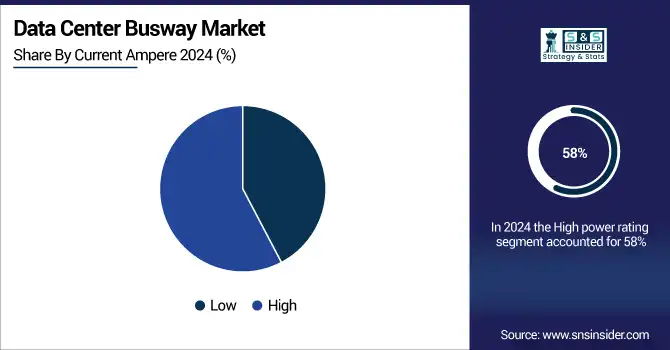
High power rating segment led the Data Center Busway Market in 2024 with a 58% revenue share because high-capacity systems are essential to meet the demands of power-intensive equipment used in hyperscale and enterprise data centers. These systems support higher current levels, reduce the need for multiple low-capacity units, and enhance energy efficiency. The segment is also expected to grow at the fastest CAGR of 9.38% from 2025 to 2032, driven by the expansion of high-density computing environments, AI workloads, and the need for future-proof, high-capacity infrastructure solutions.

Data-Center-Busway-Market-By-Current-Ampere

Regional Analysis

North America

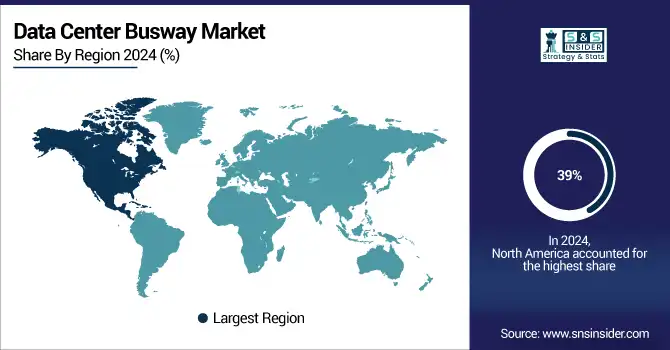
North America led the Data Center Busway Market in 2024 with a 39% revenue share due to its mature data center ecosystem, presence of major hyperscale players, and high adoption of advanced infrastructure technologies. Strong investments in colocation and cloud services, coupled with increasing power demands from AI and big data workloads, continue to drive robust deployment of modular, scalable power distribution solutions like busways.

  • According to Eaton, U.S. data center capacity is forecasted to grow 4–6× by 2028, driven by AI, big data, and cloud expansion—fueling demand for modular power solutions like busways.

The U.S. is dominating the Data Center Busway Market due to large-scale hyperscale deployments, strong cloud adoption, and continuous infrastructure modernization initiatives.

Asia Pacific

Asia Pacific is projected to grow at the fastest CAGR of 10.21% from 2025 to 2032, driven by rapid digitalization, cloud adoption, and data center construction across countries like China, India, and Southeast Asia. Government initiatives, rising internet penetration, and expanding e-commerce and telecom sectors are fueling demand for high-efficiency power infrastructure, making busway systems essential for meeting evolving capacity and operational needs in the region.

  • China is dominating the Data Center Busway Market in Asia Pacific due to rapid hyperscale expansion, strong government support, and aggressive cloud and AI infrastructure growth. Providers like Chindata report 1,640 MW of IT capacity in service or under construction, with new hyperscale centers being delivered in six months, underscoring the aggressive pace.

  • Additionally, under the “Eastern Data, Western Computing” plan, China is building 8 computing hubs and 10 data center clusters to balance data processing capacity across regions.

China is dominating the Data Center Busway Market in Asia Pacific due to rapid hyperscale expansion, strong government support, and aggressive cloud and AI infrastructure growth.

Europe

Europe is experiencing steady growth in the Data Center Busway Market due to increasing demand for cloud computing, colocation services, and energy-efficient infrastructure. Growing focus on digital transformation and green data centers is further driving adoption of scalable power solutions.

  • The Climate Neutral Data Centre Pact, backed by the European Commission, commits EU data centers to 100% carbon-free energy by 2030 and strict energy-efficiency targets (PUE ≤ 1.3–1.4). This green push is driving investments in scalable, efficient power systems—including busways.

  • Frankfurt alone holds 745 MW of IT load, with another 542 MW under construction and 383 MW in planning, reflecting robust demand for power infrastructure.

Germany is dominating the Data Center Busway Market in Europe, driven by robust industrial digitalization, strong colocation presence, and sustained investments in high-performance data centers.

Middle East & Africa and Latin America

Middle East & Africa are emerging as key players in the Data Center Busway Market, fueled by rising digitalization and AI investments. Notable projects include Ooredoo’s QAR 2 billion expansion to over 120 MW across the region and the upcoming 200 MW “Stargate UAE” AI complex. These initiatives are accelerating demand for scalable, modular busway systems, vital for energy-efficient, high-capacity data center infrastructure aligned with the region’s long-term growth vision.

Latin America is experiencing strong momentum in the Data Center Busway Market, driven by cloud expansion and digital transformation. Brazil leads with 46 new data centers underway, and AWS is investing USD 4 billion in Chile for a renewable-powered facility by 2026. These developments underscore growing adoption of modular, scalable busway systems to meet rising infrastructure needs across e-commerce, telecom, and enterprise sectors focused on sustainability and rapid deployment.

Data-Center-Busway-Market--By-region

Get Customized Report as per Your Business Requirement - Enquiry Now

Key Players

Data Center Busway Market companies are EAE Electric, Vass Electrical Industries, Anord Mardix, ABB, Schneider Electric, Dingsheng group, Eaton, Siemens, Delta Power Solutions, Wetown, Power Plug Busduct Sdn. Bhd, Rittal Pvt. Ltd, Tai Sin Electric Limited, Furukawa Electric Co., Ltd., Vertiv Group Corp., FURUTEC ELECTRICAL.

Recent Developments:

  • 2025: ABB announced a USD 120 million expansion in the U.S., with a new facility in Tennessee and upgraded Mississippi plant to boost busway and bus‑plug production for growing data center demand.

  • 2024: Schneider Electric released the modular iBusway for Data Centre, a plug‑and‑play prefabricated busbar trunking solution supporting 150 m² to 1 000 m² spaces and 150–5000 kVA loads.

  • 2023: ABB introduced the Lmax‑T low‑voltage busway for data centers during CIIE 2023 in Chinapart of three new electrification products unveiled at the exhibition.

Data Center Busway Market Report Scope:

Report Attributes Details
Market Size in 2024 USD 2.63 Billion 
Market Size by 2032 USD 5.05 Billion 
CAGR CAGR of 8.56% From 2025 to 2032
Base Year 2024
Forecast Period 2025-2032
Historical Data 2021-2023
Report Scope & Coverage Market Size, Segments Analysis, Competitive Landscape, Regional Analysis, DROC & SWOT Analysis, Forecast Outlook
Key Segments • By Product Type (Air Splicing Busway (BMC), Intensive Insulation Plug Busway (CMC), High Strength Enclosed Busway (CFW), Power Distribution Units (PDUs), Others)
• By Type (3-Phase 4-Wire, 3-Phase 5-Wire, Others)
• By Implementation (Raised Floor, Ceiling Overhead)
• By Current Ampere (Low, High)
• By Vertical (Banking, Financial Services and Insurance (BFSI), IT & Telecom, Government & Defence, Healthcare, Retail & E-commerce, Research & Academia, Energy & Utilities, Manufacturing, Others)
• By End Use (Colocation Data Centers, Enterprise Data Centers, Cloud Data Centers)
Regional Analysis/Coverage North America (US, Canada, Mexico), Europe (Germany, France, UK, Italy, Spain, Poland, Turkey, Rest of Europe), Asia Pacific (China, India, Japan, South Korea, Singapore, Australia, Rest of Asia Pacific), Middle East & Africa (UAE, Saudi Arabia, Qatar, South Africa, Rest of Middle East & Africa), Latin America (Brazil, Argentina, Rest of Latin America)
Company Profiles EAE Electric, Vass Electrical Industries, Anord Mardix, ABB, Schneider Electric, Dingsheng group, Eaton, Siemens, Delta Power Solutions, Wetown, Power Plug Busduct Sdn. Bhd, Rittal Pvt. Ltd, Tai Sin Electric Limited, Furukawa Electric Co., Ltd., Vertiv Group Corp., FURUTEC ELECTRICAL SDN. BHD

Frequently Asked Questions

Ans: The Data Center Busway Market is expected to grow at a CAGR of 8.56% from 2025 to 2032, driven by demand for scalable power infrastructure.

Ans: The global Data Center Busway Market was valued at USD 2.63 billion in 2024, led by rising hyperscale and cloud data center deployments.

Ans: Increasing demand for scalable, energy-efficient power solutions in modern data centers is the primary driver of market growth.

Ans: The 3-Phase 5-Wire segment dominated with a 50% share in 2024 and is projected to grow at the fastest CAGR of 9.59%.

Ans: North America led the market in 2024 with a 39% revenue share, driven by hyperscale demand and advanced infrastructure.

Table of Contents:

1. Introduction

1.1 Market Definition

1.2 Scope (Inclusion and Exclusions)

1.3 Research Assumptions

2. Executive Summary

2.1 Market Overview

2.2 Regional Synopsis

2.3 Competitive Summary

3. Research Methodology

3.1 Top-Down Approach

3.2 Bottom-up Approach

3.3. Data Validation

3.4 Primary Interviews

4. Market Dynamics Impact Analysis

4.1 Market Driving Factors Analysis

4.1.1 Drivers

4.1.2 Restraints

4.1.3 Opportunities

4.1.4 Challenges

4.2 PESTLE Analysis

4.3 Porter’s Five Forces Model

5. Statistical Insights and Trends Reporting

5.1 Lifecycle & Efficiency Data

5.2 Failure Rate & Reliability Metrics

5.3 Space Utilization Statistics

5.4 Customization & Modularity Trends

5.5 Retrofit vs New Build Stats

6. Competitive Landscape

6.1 List of Major Companies, By Region

6.2 Market Share Analysis, By Region

6.3 Product Benchmarking

6.3.1 Product specifications and features

6.3.2 Pricing

6.4 Strategic Initiatives

6.4.1 Marketing and promotional activities

6.4.2 Distribution and Supply Chain Strategies

6.4.3 Expansion plans and new product launches

6.4.4 Strategic partnerships and collaborations

6.5 Technological Advancements

6.6 Market Positioning and Branding

7. Frontline Workers Training Market Segmentation, By Product Type

7.1 Chapter Overview

7.2 Air Splicing Busway (BMC)

7.2.1 Air Splicing Busway (BMC) Market Trends Analysis (2021-2032)

7.2.2 Air Splicing Busway (BMC) Market Size Estimates and Forecasts to 2032 (USD Billion)

7.3 Intensive Insulation Plug Busway (CMC)

7.3.1 Intensive Insulation Plug Busway (CMC) Market Trends Analysis (2021-2032)

7.3.2 Intensive Insulation Plug Busway (CMC) Market Size Estimates and Forecasts to 2032 (USD Billion)

7.4 High Strength Enclosed Busway (CFW) 

7.4.1 High Strength Enclosed Busway (CFW) Market Trends Analysis (2021-2032)

7.4.2 High Strength Enclosed Busway (CFW) Market Size Estimates and Forecasts to 2032 (USD Billion)

7.5
Power Distribution Units (PDUs)

7.5.1 Power Distribution Units (PDUs) Market Trends Analysis (2021-2032)

7.5.2 Power Distribution Units (PDUs) Market Size Estimates and Forecasts to 2032 (USD Billion)

7.6 Others

7.6.1 Others Market Trends Analysis (2021-2032)

7.6.2 Others Market Size Estimates and Forecasts to 2032 (USD Billion)

8. Frontline Workers Training Market Segmentation, By Type

8.1 Chapter Overview

8.2 3-Phase 4-Wire

8.2.1 3-Phase 4-Wire Market Trends Analysis (2021-2032)

8.2.2 3-Phase 4-Wire Market Size Estimates And Forecasts To 2032 (USD Billion)

8.3 3-Phase 5-Wire

       8.3.1 3-Phase 5-Wire Motor Market Trends Analysis (2021-2032)

8.3.2 3-Phase 5-Wire Motor Market Size Estimates And Forecasts To 2032 (USD Billion)

8.4 Others

8.4.1 Engine Control Module (ECM) Market Trends Analysis (2021-2032)

8.4.2 Engine Control Module (ECM) Market Size Estimates And Forecasts To 2032 (USD Billion)

9. Frontline Workers Training Market Segmentation, By End Use

9.1 Chapter Overview

9.2 Colocation Data Centers

9.2.1 Colocation Data Centers Market Trends Analysis (2021-2032)

9.2.2 Colocation Data Centers Market Size Estimates And Forecasts To 2032 (USD Billion)

9.3 Enterprise Data Centers

9.3.1 Enterprise Data Centers Market Trends Analysis (2021-2032)

9.3.2 Enterprise Data Centers Market Size Estimates And Forecasts To 2032 (USD Billion)

9.4 Cloud Data Centers

9.4.1 Cloud Data Centers Market Trends Analysis (2021-2032)

9.4.2 Cloud Data Centers Market Size Estimates And Forecasts To 2032 (USD Billion)

10. Frontline Workers Training Market Segmentation, By Implementation

10.1 Chapter Overview

10.2 Raised Floor

10.2.1 Raised Floor Market Trends Analysis (2021-2032)

10.2.2 Raised Floor Market Size Estimates And Forecasts To 2032 (USD Billion)

10.3 Ceiling Overhead

10.3.1 Ceiling Overhead Market Trends Analysis (2021-2032)

10.3.2 Ceiling Overhead Market Size Estimates And Forecasts To 2032 (USD Billion)

11. Frontline Workers Training Market Segmentation, By Vertical

11.1 Chapter Overview

11.2 BFSI

11.2.1 BFSI Market Trends Analysis (2021-2032)

11.2.2 BFSI Market Size Estimates And Forecasts To 2032 (USD Billion)

11.3 IT & Telecom

11.3.1 IT & Telecom Vehicles Market Trends Analysis (2021-2032)

11.3.2 IT & Telecom Market Size Estimates And Forecasts To 2032 (USD Billion)

11.4 Government & Defence

11.4.1 Government & Defence Market Trends Analysis (2021-2032)

11.4.2 Government & Defence Market Size Estimates And Forecasts To 2032 (USD Billion)

11.5 Healthcare

11.5.1 Healthcare Market Trends Analysis (2021-2032)

11.5.2 Healthcare Market Size Estimates And Forecasts To 2032 (USD Billion)

11.6 Retail & E-commerce

11.6.1 Retail & E-commerce Market Trends Analysis (2021-2032)

11.6.2 Retail & E-commerce Market Size Estimates And Forecasts To 2032 (USD Billion)

11.7 Energy & Utilities

11.7.1 Energy & Utilities Market Trends Analysis (2021-2032)

11.7.2 Energy & Utilities Market Size Estimates And Forecasts To 2032 (USD Billion)

11.8 Manufacturing

11.8.1 Manufacturing Market Trends Analysis (2021-2032)

11.8.2 Manufacturing Market Size Estimates And Forecasts To 2032 (USD Billion)

11.9 Others

11.9.1 Others Market Trends Analysis (2021-2032)

11.9.2 Others Market Size Estimates And Forecasts To 2032 (USD Billion)

12. Frontline Workers Training Market Estimates And Forecasts, By Current Ampere

12.1 Chapter Overview

12.2 Low

12.2.1 Low Market Trends Analysis (2021-2032)

12.2.2 Low Market Size Estimates And Forecasts To 2032 (USD Billion)

12.3 High

12.3.1 High Market Trends Analysis (2021-2032)

12.3.2 High Market Size Estimates And Forecasts To 2032 (USD Billion)      

13. Regional Analysis

13.1 Chapter Overview

13.2 North America

13.2.1 Trends Analysis

13.2.2 North America Frontline Workers Training Market Estimates And Forecasts, By Country (2021-2032) (USD Billion)

13.2.3 North America Frontline Workers Training Market Estimates And Forecasts, By Product Type (2021-2032) (USD Billion)

13.2.4 North America Frontline Workers Training Market Estimates And Forecasts, By Type (2021-2032) (USD Billion)

13.2.5 North America Frontline Workers Training Market Estimates And Forecasts, By End Use (2021-2032) (USD Billion)

13.2.6 North America Frontline Workers Training Market Estimates And Forecasts, By Implementation (2021-2032) (USD Billion)

13.2.7 North America Frontline Workers Training Market Estimates And Forecasts, By Vertical (2021-2032) (USD Billion)

13.2.8 North America Frontline Workers Training Market Estimates And Forecasts, By Current Ampere (2021-2032) (USD Billion)

13.2.9 USA

13.2.9.1 USA Frontline Workers Training Market Estimates And Forecasts, By Product Type (2021-2032) (USD Billion)

13.2.9.2 USA Frontline Workers Training Market Estimates And Forecasts, By Type (2021-2032) (USD Billion)

13.2.9.3 USA Frontline Workers Training Market Estimates And Forecasts, By End Use (2021-2032) (USD Billion)

13.2.9.4 USA Frontline Workers Training Market Estimates And Forecasts, By Implementation (2021-2032) (USD Billion)

13.2.9.5 USA Frontline Workers Training Market Estimates And Forecasts, By Vertical (2021-2032) (USD Billion)

13.2.9.6 USA Frontline Workers Training Market Estimates And Forecasts, By Current Ampere (2021-2032) (USD Billion)

13.2.10 Canada

13.2.10.1 Canada Frontline Workers Training Market Estimates And Forecasts, By Product Type (2021-2032) (USD Billion)

13.2.10.2 Canada Frontline Workers Training Market Estimates And Forecasts, By Type (2021-2032) (USD Billion)

13.2.10.3 Canada Frontline Workers Training Market Estimates And Forecasts, By End Use (2021-2032) (USD Billion)

13.2.10.4 Canada Frontline Workers Training Market Estimates And Forecasts, By Implementation (2021-2032) (USD Billion)

13.2.10.5 Canada Frontline Workers Training Market Estimates And Forecasts, By Vertical (2021-2032) (USD Billion)

13.2.10.6 Canada Frontline Workers Training Market Estimates And Forecasts, By Current Ampere (2021-2032) (USD Billion)

13.2.11 Mexico

13.2.11.1 Mexico Frontline Workers Training Market Estimates And Forecasts, By Product Type (2021-2032) (USD Billion)

13.2.11.2 Mexico Frontline Workers Training Market Estimates And Forecasts, By Type (2021-2032) (USD Billion)

13.2.11.3 Mexico Frontline Workers Training Market Estimates And Forecasts, By End Use (2021-2032) (USD Billion)

13.2.11.4 Mexico Frontline Workers Training Market Estimates And Forecasts, By Implementation (2021-2032) (USD Billion)

13.2.11.5 Mexico Frontline Workers Training Market Estimates And Forecasts, By Vertical (2021-2032) (USD Billion)

13.2.11.6 Mexico Frontline Workers Training Market Estimates And Forecasts, By Current Ampere (2021-2032) (USD Billion)

13.3 Europe

13.3.1 Trends Analysis

13.3.2 Europe Frontline Workers Training Market Estimates And Forecasts, By Country (2021-2032) (USD Billion)

13.3.3 Europe Frontline Workers Training Market Estimates And Forecasts, By Product Type (2021-2032) (USD Billion)

13.3.4 Europe Frontline Workers Training Market Estimates And Forecasts, By Type (2021-2032) (USD Billion)

13.3.5 Europe Frontline Workers Training Market Estimates And Forecasts, By End Use (2021-2032) (USD Billion)

13.3.6 Europe Frontline Workers Training Market Estimates And Forecasts, By Implementation (2021-2032) (USD Billion)

13.3.7 Europe Frontline Workers Training Market Estimates And Forecasts, By Vertical (2021-2032) (USD Billion)

13.3.8 Europe Frontline Workers Training Market Estimates And Forecasts, By Current Ampere (2021-2032) (USD Billion)

13.3.9 Poland

13.3.9.1 Poland Frontline Workers Training Market Estimates And Forecasts, By Product Type (2021-2032) (USD Billion)

13.3.9.2 Poland Frontline Workers Training Market Estimates And Forecasts, By Type (2021-2032) (USD Billion)

13.3.9.3 Poland Frontline Workers Training Market Estimates And Forecasts, By End Use (2021-2032) (USD Billion)

13.3.9.4 Poland Frontline Workers Training Market Estimates And Forecasts, By Implementation (2021-2032) (USD Billion)

13.3.9.5 Poland Frontline Workers Training Market Estimates And Forecasts, By Vertical (2021-2032) (USD Billion)

13.3.9.6 Poland Frontline Workers Training Market Estimates And Forecasts, By Current Ampere (2021-2032) (USD Billion)

13.3.10 Turkey

13.3.10.1 Turkey Frontline Workers Training Market Estimates And Forecasts, By Product Type (2021-2032) (USD Billion)

13.3.10.2 Turkey Frontline Workers Training Market Estimates And Forecasts, By Type (2021-2032) (USD Billion)

13.3.10.3 Turkey Frontline Workers Training Market Estimates And Forecasts, By End Use (2021-2032) (USD Billion)

13.3.10.4 Turkey Frontline Workers Training Market Estimates And Forecasts, By Implementation (2021-2032) (USD Billion)

13.3.10.5 Turkey Frontline Workers Training Market Estimates And Forecasts, By Vertical (2021-2032) (USD Billion)

13.3.10.6 Turkey Frontline Workers Training Market Estimates And Forecasts, By Current Ampere (2021-2032) (USD Billion)

13.3.2.9 Germany    

13.3.2.9.1 Germany Frontline Workers Training Market Estimates And Forecasts, By Product Type (2021-2032) (USD Billion)

13.3.2.9.2 Germany Frontline Workers Training Market Estimates And Forecasts, By Type (2021-2032) (USD Billion)

13.3.2.9.3 Germany Frontline Workers Training Market Estimates And Forecasts, By End Use (2021-2032) (USD Billion)

13.3.2.9.4 Germany Frontline Workers Training Market Estimates And Forecasts, By Implementation (2021-2032) (USD Billion)

13.3.2.9.5 Germany Frontline Workers Training Market Estimates And Forecasts, By Vertical (2021-2032) (USD Billion)

13.3.2.9.6 Germany Frontline Workers Training Market Estimates And Forecasts, By Current Ampere (2021-2032) (USD Billion)

13.3.10 France

13.3.10.1 France Frontline Workers Training Market Estimates And Forecasts, By Product Type (2021-2032) (USD Billion)

13.3.10.2 France Frontline Workers Training Market Estimates And Forecasts, By Type (2021-2032) (USD Billion)

13.3.10.3 France Frontline Workers Training Market Estimates And Forecasts, By End Use (2021-2032) (USD Billion)

13.3.10.4 France Frontline Workers Training Market Estimates And Forecasts, By Implementation (2021-2032) (USD Billion)

13.3.10.5 France Frontline Workers Training Market Estimates And Forecasts, By Vertical (2021-2032) (USD Billion)

13.3.10.6 France Frontline Workers Training Market Estimates And Forecasts, By Current Ampere (2021-2032) (USD Billion)

13.3.11 UK

13.3.11.1 UK Frontline Workers Training Market Estimates And Forecasts, By Product Type (2021-2032) (USD Billion)

13.3.11.2 UK Frontline Workers Training Market Estimates And Forecasts, By Type (2021-2032) (USD Billion)

13.3.11.3 UK Frontline Workers Training Market Estimates And Forecasts, By End Use (2021-2032) (USD Billion)

13.3.11.4 UK Frontline Workers Training Market Estimates And Forecasts, By Implementation (2021-2032) (USD Billion)

13.3.11.5 UK Frontline Workers Training Market Estimates And Forecasts, By Vertical (2021-2032) (USD Billion)

13.3.11.6 UK Frontline Workers Training Market Estimates And Forecasts, By Current Ampere (2021-2032) (USD Billion)

13.3.12 Italy

13.3.12.1 Italy Frontline Workers Training Market Estimates And Forecasts, By Product Type (2021-2032) (USD Billion)

13.3.12.2 Italy Frontline Workers Training Market Estimates And Forecasts, By Type (2021-2032) (USD Billion)

13.3.12.3 Italy Frontline Workers Training Market Estimates And Forecasts, By End Use (2021-2032) (USD Billion)

13.3.12.4 Italy Frontline Workers Training Market Estimates And Forecasts, By Implementation (2021-2032) (USD Billion)

13.3.12.5 Italy Frontline Workers Training Market Estimates And Forecasts, By Vertical (2021-2032) (USD Billion)

13.3.12.6 Italy Frontline Workers Training Market Estimates And Forecasts, By Current Ampere (2021-2032) (USD Billion)

13.3.13 Spain

13.3.13.1 Spain Frontline Workers Training Market Estimates And Forecasts, By Product Type (2021-2032) (USD Billion)

13.3.13.2 Spain Frontline Workers Training Market Estimates And Forecasts, By Type (2021-2032) (USD Billion)

13.3.13.3 Spain Frontline Workers Training Market Estimates And Forecasts, By End Use (2021-2032) (USD Billion)

13.3.13.4 Spain Frontline Workers Training Market Estimates And Forecasts, By Implementation (2021-2032) (USD Billion)

13.3.13.5 Spain Frontline Workers Training Market Estimates and Forecasts, By Vertical (2021-2032) (USD -13824)

13.3.13.6 Spain Frontline Workers Training Market Estimates And Forecasts, By Current Ampere (2021-2032) (USD Billion)

13.3.14 Rest Of Europe

13.3.14.1 Rest Of Europe Frontline Workers Training Market Estimates And Forecasts, By Product Type (2021-2032) (USD Billion)

13.3.14.2 Rest Of Europe Frontline Workers Training Market Estimates And Forecasts, By Type (2021-2032) (USD Billion)

13.3.14.3 Rest Of Europe Frontline Workers Training Market Estimates And Forecasts, By End Use (2021-2032) (USD Billion)

13.3.14.4 Rest Of Europe Frontline Workers Training Market Estimates And Forecasts, By Implementation (2021-2032) (USD Billion)

13.3.14.5 Rest Of Europe Frontline Workers Training Market Estimates And Forecasts, By Vertical (2021-2032) (USD Billion)

13.3.14.6 Rest Of Europe Frontline Workers Training Market Estimates And Forecasts, By Current Ampere (2021-2032) (USD Billion)

13.4 Asia Pacific

13.4.1 Trends Analysis

13.4.2 Asia Pacific Frontline Workers Training Market Estimates And Forecasts, By Country (2021-2032) (USD Billion)

13.4.3 Asia Pacific Frontline Workers Training Market Estimates And Forecasts, By Product Type (2021-2032) (USD Billion)

13.4.4 Asia Pacific Frontline Workers Training Market Estimates And Forecasts, By Type (2021-2032) (USD Billion)

13.4.5 Asia Pacific Frontline Workers Training Market Estimates And Forecasts, By End Use (2021-2032) (USD Billion)

13.4.6 Asia Pacific Frontline Workers Training Market Estimates And Forecasts, By Implementation (2021-2032) (USD Billion)

13.4.7 Asia Pacific Frontline Workers Training Market Estimates And Forecasts, By Vertical (2021-2032) (USD Billion)

13.4.8 Asia Pacific Frontline Workers Training Market Estimates And Forecasts, By Current Ampere (2021-2032) (USD Billion)

13.4.9 China

13.4.9.1 China Frontline Workers Training Market Estimates And Forecasts, By Product Type (2021-2032) (USD Billion)

13.4.9.2 China Frontline Workers Training Market Estimates And Forecasts, By Type (2021-2032) (USD Billion)

13.4.9.3 China Frontline Workers Training Market Estimates And Forecasts, By End Use (2021-2032) (USD Billion)

13.4.9.4 China Frontline Workers Training Market Estimates And Forecasts, By Implementation (2021-2032) (USD Billion)

13.4.9.5 China Frontline Workers Training Market Estimates And Forecasts, By Vertical (2021-2032) (USD Billion)

13.4.9.6 China Frontline Workers Training Market Estimates And Forecasts, By Current Ampere (2021-2032) (USD Billion)

13.4.10 India

13.4.10.1 India Frontline Workers Training Market Estimates And Forecasts, By Product Type (2021-2032) (USD Billion)

13.4.10.2 India Frontline Workers Training Market Estimates And Forecasts, By Type (2021-2032) (USD Billion)

13.4.10.3 India Frontline Workers Training Market Estimates And Forecasts, By End Use (2021-2032) (USD Billion)

13.4.10.4 India Frontline Workers Training Market Estimates And Forecasts, By Implementation (2021-2032) (USD Billion)

13.4.10.5 India Frontline Workers Training Market Estimates And Forecasts, By Vertical (2021-2032) (USD Billion)

13.4.10.6 India Frontline Workers Training Market Estimates And Forecasts, By Current Ampere (2021-2032) (USD Billion)

13.4.11 Japan

13.4.11.1 Japan Frontline Workers Training Market Estimates And Forecasts, By Product Type (2021-2032) (USD Billion)

13.4.11.2 Japan Frontline Workers Training Market Estimates And Forecasts, By Type (2021-2032) (USD Billion)

13.4.11.3 Japan Frontline Workers Training Market Estimates And Forecasts, By End Use (2021-2032) (USD Billion)

13.4.11.4 Japan Frontline Workers Training Market Estimates And Forecasts, By Implementation (2021-2032) (USD Billion)

13.4.11.5 Japan Frontline Workers Training Market Estimates And Forecasts, By Vertical (2021-2032) (USD Billion)

13.4.11.6 Japan Frontline Workers Training Market Estimates And Forecasts, By Current Ampere (2021-2032) (USD Billion)

13.4.12 South Korea

13.4.12.1 South Korea Frontline Workers Training Market Estimates And Forecasts, By Product Type (2021-2032) (USD Billion)

13.4.12.2 South Korea Frontline Workers Training Market Estimates And Forecasts, By Type (2021-2032) (USD Billion)

13.4.12.3 South Korea Frontline Workers Training Market Estimates And Forecasts, By End Use (2021-2032) (USD Billion)

13.4.12.4 South Korea Frontline Workers Training Market Estimates And Forecasts, By Implementation (2021-2032) (USD Billion)

13.4.12.5 South Korea Frontline Workers Training Market Estimates And Forecasts, By Vertical (2021-2032) (USD Billion)

13.4.12.6 South Korea Frontline Workers Training Market Estimates And Forecasts, By Current Ampere (2021-2032) (USD Billion)

13.4.13 Singapore

13.4.13.1 Singapore Frontline Workers Training Market Estimates And Forecasts, By Product Type (2021-2032) (USD Billion)

13.4.13.2 Singapore Frontline Workers Training Market Estimates And Forecasts, By Type (2021-2032) (USD Billion)

13.4.13.3 Singapore Frontline Workers Training Market Estimates And Forecasts, By End Use (2021-2032) (USD Billion)

13.4.13.4 Singapore Frontline Workers Training Market Estimates And Forecasts, By Implementation (2021-2032) (USD Billion)

13.4.13.5 Singapore Frontline Workers Training Market Estimates And Forecasts, By Vertical (2021-2032) (USD Billion)

13.4.13.6 Singapore Frontline Workers Training Market Estimates And Forecasts, By Current Ampere (2021-2032) (USD Billion)

13.4.14 Australia

13.4.14.1 Australia Frontline Workers Training Market Estimates And Forecasts, By Product Type (2021-2032) (USD Billion)

13.4.14.2 Australia Frontline Workers Training Market Estimates And Forecasts, By Type (2021-2032) (USD Billion)

13.4.14.3 Australia Frontline Workers Training Market Estimates And Forecasts, By End Use (2021-2032) (USD Billion)

13.4.14.4 Australia Frontline Workers Training Market Estimates And Forecasts, By Implementation (2021-2032) (USD Billion)

13.4.14.5 Australia Frontline Workers Training Market Estimates And Forecasts, By Vertical (2021-2032) (USD Billion)

13.4.14.6 Australia Frontline Workers Training Market Estimates And Forecasts, By Current Ampere (2021-2032) (USD Billion)

13.4.15 Rest Of Asia Pacific

13.4.15.1 Rest Of Asia Pacific Frontline Workers Training Market Estimates And Forecasts, By Product Type (2021-2032) (USD Billion)

13.4.15.2 Rest Of Asia Pacific Frontline Workers Training Market Estimates And Forecasts, By Type (2021-2032) (USD Billion)

13.4.15.3 Rest Of Asia Pacific Frontline Workers Training Market Estimates And Forecasts, By End Use (2021-2032) (USD Billion)

13.4.15.4 Rest Of Asia Pacific Frontline Workers Training Market Estimates And Forecasts, By Implementation (2021-2032) (USD Billion)

13.4.15.5 Rest Of Asia Pacific Frontline Workers Training Market Estimates And Forecasts, By Vertical (2021-2032) (USD Billion)

13.4.15.6 Rest Of Asia Pacific Frontline Workers Training Market Estimates And Forecasts, By Current Ampere (2021-2032) (USD Billion)

13.5 Middle East And Africa

13.5.1 Trends Analysis

13.5.2 Middle East And Africa Frontline Workers Training Market Estimates And Forecasts, By Country (2021-2032) (USD Billion)

13.5.3 Middle East And Africa Frontline Workers Training Market Estimates And Forecasts, By Product Type (2021-2032) (USD Billion)

13.5.4 Middle East And Africa Frontline Workers Training Market Estimates And Forecasts, By Type (2021-2032) (USD Billion)

13.5.5 Middle East And Africa Frontline Workers Training Market Estimates And Forecasts, By End Use (2021-2032) (USD Billion)

13.5.6 Middle East And Africa Frontline Workers Training Market Estimates And Forecasts, By Implementation (2021-2032) (USD Billion)

13.5.7 Middle East And Africa Frontline Workers Training Market Estimates And Forecasts, By Vertical (2021-2032) (USD Billion)

13.5.8 Middle East And Africa Frontline Workers Training Market Estimates And Forecasts, By Current Ampere (2021-2032) (USD Billion)

13.5.9 UAE

13.5.9.1 UAE Frontline Workers Training Market Estimates And Forecasts, By Product Type (2021-2032) (USD Billion)

13.5.9.2 UAE Frontline Workers Training Market Estimates And Forecasts, By Type (2021-2032) (USD Billion)

13.5.9.3 UAE Frontline Workers Training Market Estimates And Forecasts, By End Use (2021-2032) (USD Billion)

13.5.9.4 UAE Frontline Workers Training Market Estimates And Forecasts, By Implementation (2021-2032) (USD Billion)

13.5.9.5 UAE Frontline Workers Training Market Estimates And Forecasts, By Vertical (2021-2032) (USD Billion)

13.5.9.6 UAE Frontline Workers Training Market Estimates And Forecasts, By Current Ampere (2021-2032) (USD Billion)

13.5.10 Saudi Arabia

13.5.10.1 Saudi Arabia Frontline Workers Training Market Estimates And Forecasts, By Product Type (2021-2032) (USD Billion)

13.5.10.2 Saudi Arabia Frontline Workers Training Market Estimates And Forecasts, By Type (2021-2032) (USD Billion)

13.5.10.3 Saudi Arabia Frontline Workers Training Market Estimates And Forecasts, By End Use (2021-2032) (USD Billion)

13.5.10.4 Saudi Arabia Frontline Workers Training Market Estimates And Forecasts, By Implementation (2021-2032) (USD Billion)

13.5.10.5 Saudi Arabia Frontline Workers Training Market Estimates And Forecasts, By Vertical (2021-2032) (USD Billion)

13.5.10.6 Saudi Arabia Frontline Workers Training Market Estimates And Forecasts, By Current Ampere (2021-2032) (USD Billion)

13.5.11 Qatar

13.5.11.1 Qatar Frontline Workers Training Market Estimates And Forecasts, By Product Type (2021-2032) (USD Billion)

13.5.11.2 Qatar Frontline Workers Training Market Estimates And Forecasts, By Type (2021-2032) (USD Billion)

13.5.11.3 Qatar Frontline Workers Training Market Estimates And Forecasts, By End Use (2021-2032) (USD Billion)

13.5.11.4 Qatar Frontline Workers Training Market Estimates And Forecasts, By Implementation (2021-2032) (USD Billion)

13.5.11.5 Qatar Frontline Workers Training Market Estimates And Forecasts, By Vertical (2021-2032) (USD Billion)

13.5.11.6 Qatar Frontline Workers Training Market Estimates And Forecasts, By Current Ampere (2021-2032) (USD Billion)

13.5.11.6 Rest Of Middle East Frontline Workers Training Market Estimates And Forecasts, By Current Ampere (2021-2032) (USD Billion)

13.5.12 South Africa

13.5.12.1 South Africa Frontline Workers Training Market Estimates And Forecasts, By Product Type (2021-2032) (USD Billion)

13.5.12.2 South Africa Frontline Workers Training Market Estimates And Forecasts, By Type (2021-2032) (USD Billion)

13.5.12.3 South Africa Frontline Workers Training Market Estimates And Forecasts, By End Use (2021-2032) (USD Billion)

13.5.12.4 South Africa Frontline Workers Training Market Estimates And Forecasts, By Implementation (2021-2032) (USD Billion)

13.5.12.5 South Africa Frontline Workers Training Market Estimates And Forecasts, By Vertical (2021-2032) (USD Billion)

13.5.12.6 South Africa Frontline Workers Training Market Estimates And Forecasts, By Current Ampere (2021-2032) (USD Billion)

13.5.13 Nigeria

13.5.13.1 Nigeria Frontline Workers Training Market Estimates And Forecasts, By Product Type (2021-2032) (USD Billion)

13.5.13.2 Nigeria Frontline Workers Training Market Estimates And Forecasts, By Type (2021-2032) (USD Billion)

13.5.13.3 Nigeria Frontline Workers Training Market Estimates And Forecasts, By End Use (2021-2032) (USD Billion)

13.5.13.4 Nigeria Frontline Workers Training Market Estimates And Forecasts, By Implementation (2021-2032) (USD Billion)

13.5.13.5 Nigeria Frontline Workers Training Market Estimates And Forecasts, By Vertical (2021-2032) (USD Billion)

13.5.13.6 Nigeria Frontline Workers Training Market Estimates And Forecasts, By Current Ampere (2021-2032) (USD Billion)

13.5.14 Rest Of Africa

13.5.14.1 Rest Of Africa Frontline Workers Training Market Estimates And Forecasts, By Product Type (2021-2032) (USD Billion)

13.5.14.2 Rest Of Africa Frontline Workers Training Market Estimates And Forecasts, By Type (2021-2032) (USD Billion)

13.5.14.3 Rest Of Africa Frontline Workers Training Market Estimates And Forecasts, By End Use (2021-2032) (USD Billion)

13.5.14.4 Rest Of Africa Frontline Workers Training Market Estimates And Forecasts, By Implementation (2021-2032) (USD Billion)

13.5.14.5 Rest Of Africa Frontline Workers Training Market Estimates And Forecasts, By Vertical (2021-2032) (USD Billion)

13.5.14.6 Rest Of Africa Frontline Workers Training Market Estimates And Forecasts, By Current Ampere (2021-2032) (USD Billion)

13.6 Latin America

13.6.1 Trends Analysis

13.6.2 Latin America Frontline Workers Training Market Estimates And Forecasts, By Country (2021-2032) (USD Billion)

13.6.3 Latin America Frontline Workers Training Market Estimates And Forecasts, By Product Type (2021-2032) (USD Billion)

13.6.4 Latin America Frontline Workers Training Market Estimates And Forecasts, By Type (2021-2032) (USD Billion)

13.6.5 Latin America Frontline Workers Training Market Estimates And Forecasts, By End Use (2021-2032) (USD Billion)

13.6.6 Latin America Frontline Workers Training Market Estimates And Forecasts, By Implementation (2021-2032) (USD Billion)

13.6.7 Latin America Frontline Workers Training Market Estimates And Forecasts, By Vertical (2021-2032) (USD Billion)

13.6.8 Latin America Frontline Workers Training Market Estimates And Forecasts, By Current Ampere (2021-2032) (USD Billion)

13.6.9 Brazil

13.6.9.1 Brazil Frontline Workers Training Market Estimates And Forecasts, By Product Type (2021-2032) (USD Billion)

13.6.9.2 Brazil Frontline Workers Training Market Estimates And Forecasts, By Type (2021-2032) (USD Billion)

13.6.9.3 Brazil Frontline Workers Training Market Estimates And Forecasts, By End Use (2021-2032) (USD Billion)

13.6.9.4 Brazil Frontline Workers Training Market Estimates And Forecasts, By Implementation (2021-2032) (USD Billion)

13.6.9.5 Brazil Frontline Workers Training Market Estimates And Forecasts, By Vertical (2021-2032) (USD Billion)

13.6.9.6 Brazil Frontline Workers Training Market Estimates And Forecasts, By Current Ampere (2021-2032) (USD Billion)

13.6.10 Argentina

13.6.10.1 Argentina Frontline Workers Training Market Estimates And Forecasts, By Product Type (2021-2032) (USD Billion)

13.6.10.2 Argentina Frontline Workers Training Market Estimates And Forecasts, By Type (2021-2032) (USD Billion)

13.6.10.3 Argentina Frontline Workers Training Market Estimates And Forecasts, By End Use (2021-2032) (USD Billion)

13.6.10.4 Argentina Frontline Workers Training Market Estimates And Forecasts, By Implementation (2021-2032) (USD Billion)

13.6.10.5 Argentina Frontline Workers Training Market Estimates And Forecasts, By Vertical (2021-2032) (USD Billion)

13.6.10.6 Argentina Frontline Workers Training Market Estimates And Forecasts, By Current Ampere (2021-2032) (USD Billion)

13.6.12 Rest of Latin America

13.6.12.1 Rest of Latin America Frontline Workers Training Market Estimates And Forecasts, By Product Type (2021-2032) (USD Billion)

13.6.12.2 Rest of Latin America Frontline Workers Training Market Estimates And Forecasts, By Type (2021-2032) (USD Billion)

13.6.12.3 Rest of Latin America Frontline Workers Training Market Estimates And Forecasts, By End Use (2021-2032) (USD Billion)

13.6.12.4 Rest of Latin America Frontline Workers Training Market Estimates And Forecasts, By Implementation (2021-2032) (USD Billion)

13.6.12.5 Rest of Latin America Frontline Workers Training Market Estimates And Forecasts, By Vertical (2021-2032) (USD Billion)

13.6.12.6 Rest of Latin America Frontline Workers Training Market Estimates And Forecasts, By Current Ampere (2021-2032) (USD Billion)

14. Company Profiles

14.1 EAE Electric

14.1.1Company Overview

14.1.2 Financial

14.1.3 Products/ Services Offered

14.1.4 SWOT Analysis

14.2 Vass Electrical Industries

14.2.1 Company Overview

14.2.2 Financial

14.2.3 Products/ Services Offered

14.2.4 SWOT Analysis

14.3 Anord Mardix

14.3.1 Company Overview

14.3.2 Financial

14.3.3 Products/ Services Offered

14.3.4 SWOT Analysis

14.4 ABB

14.4.1 Company Overview

14.4.2 Financial

14.4.3 Products/ Services Offered

14.4.4 SWOT Analysis

14.5 Schneider Electric

14.5.1 Company Overview

14.5.2 Financial

14.5.3 Products/ Services Offered

14.5.4 SWOT Analysis

14.6 Eaton

             14.6.1 Company Overview

14.6.2 Financial

14.6.3 Products/ Services Offered

14.6.4 SWOT Analysis

14.7 Siemens

14.7.1 Company Overview

14.7.2 Financial

14.7.3 Products/ Services Offered

14.7.4 SWOT Analysis

14.8 Delta Power Solutions

14.8.1 Company Overview

14.8.2 Financial

14.8.3 Products/ Services Offered

14.8.4 SWOT Analysis

14.9 Wetown

14.9.1 Company Overview

14.9.2 Financial

14.9.3 Products/ Services Offered

14.9.4 SWOT Analysis

14.10 Power Plug Busduct Sdn. Bhd

14.10.1 Company Overview

14.10.2 Financial

14.10.3 Products/ Services Offered

14.10.4 SWOT Analysis

15. Use Cases and Best Practices

16. Conclusion

An accurate research report requires proper strategizing as well as implementation. There are multiple factors involved in the completion of good and accurate research report and selecting the best methodology to compete the research is the toughest part. Since the research reports we provide play a crucial role in any company’s decision-making process, therefore we at SNS Insider always believe that we should choose the best method which gives us results closer to reality. This allows us to reach at a stage wherein we can provide our clients best and accurate investment to output ratio.

Each report that we prepare takes a timeframe of 350-400 business hours for production. Starting from the selection of titles through a couple of in-depth brain storming session to the final QC process before uploading our titles on our website we dedicate around 350 working hours. The titles are selected based on their current market cap and the foreseen CAGR and growth.


The 5 steps process:

Step 1: Secondary Research:

Secondary Research or Desk Research is as the name suggests is a research process wherein, we collect data through the readily available information. In this process we use various paid and unpaid databases which our team has access to and gather data through the same. This includes examining of listed companies’ annual reports, Journals, SEC filling etc. Apart from this our team has access to various associations across the globe across different industries. Lastly, we have exchange relationships with various university as well as individual libraries.

Secondary Research

Step 2: Primary Research

When we talk about primary research, it is a type of study in which the researchers collect relevant data samples directly, rather than relying on previously collected data.  This type of research is focused on gaining content specific facts that can be sued to solve specific problems. Since the collected data is fresh and first hand therefore it makes the study more accurate and genuine.

We at SNS Insider have divided Primary Research into 2 parts.

Part 1 wherein we interview the KOLs of major players as well as the upcoming ones across various geographic regions. This allows us to have their view over the market scenario and acts as an important tool to come closer to the accurate market numbers. As many as 45 paid and unpaid primary interviews are taken from both the demand and supply side of the industry to make sure we land at an accurate judgement and analysis of the market.

This step involves the triangulation of data wherein our team analyses the interview transcripts, online survey responses and observation of on filed participants. The below mentioned chart should give a better understanding of the part 1 of the primary interview.

Primary Research

Part 2: In this part of primary research the data collected via secondary research and the part 1 of the primary research is validated with the interviews from individual consultants and subject matter experts.

Consultants are those set of people who have at least 12 years of experience and expertise within the industry whereas Subject Matter Experts are those with at least 15 years of experience behind their back within the same space. The data with the help of two main processes i.e., FGDs (Focused Group Discussions) and IDs (Individual Discussions). This gives us a 3rd party nonbiased primary view of the market scenario making it a more dependable one while collation of the data pointers.

Step 3: Data Bank Validation

Once all the information is collected via primary and secondary sources, we run that information for data validation. At our intelligence centre our research heads track a lot of information related to the market which includes the quarterly reports, the daily stock prices, and other relevant information. Our data bank server gets updated every fortnight and that is how the information which we collected using our primary and secondary information is revalidated in real time.

Data Bank Validation

Step 4: QA/QC Process

After all the data collection and validation our team does a final level of quality check and quality assurance to get rid of any unwanted or undesired mistakes. This might include but not limited to getting rid of the any typos, duplication of numbers or missing of any important information. The people involved in this process include technical content writers, research heads and graphics people. Once this process is completed the title gets uploader on our platform for our clients to read it.

Step 5: Final QC/QA Process:

This is the last process and comes when the client has ordered the study. In this process a final QA/QC is done before the study is emailed to the client. Since we believe in giving our clients a good experience of our research studies, therefore, to make sure that we do not lack at our end in any way humanly possible we do a final round of quality check and then dispatch the study to the client.

Key Segments: 

By Product Type

  • Air Splicing Busway (BMC)

  • Intensive Insulation Plug Busway (CMC)

  • High Strength Enclosed Busway (CFW)

  • Power Distribution Units (PDUs)

  • Others

By Type

  • 3-Phase 4-Wire

  • 3-Phase 5-Wire

  • Others

By Implementation

  • Raised Floor

  • Ceiling Overhead

By Current Ampere

  • Low

  • High

By Vertical

  • Banking

  • Financial Services and Insurance (BFSI)

  • IT & Telecom

  • Government & Defence

  • Healthcare

  • Retail & E-commerce

  • Research & Academia

  • Energy & Utilities

  • Manufacturing

  • Others

By End Use

  • Colocation Data Centers

  • Enterprise Data Centers

  • Cloud Data Centers


Request for Segment Customization as per your Business Requirement: Segment Customization Request

Regional Coverage: 

North America

  • US

  • Canada

  • Mexico

Europe

  • Germany

  • France

  • UK

  • Italy

  • Spain

  • Poland

  • Turkey

  • Rest of Europe

Asia Pacific

  • China

  • India

  • Japan

  • South Korea

  • Singapore

  • Australia

  • Rest of Asia Pacific

Middle East & Africa

  • UAE

  • Saudi Arabia

  • Qatar

  • South Africa

  • Rest of Middle East & Africa

Latin America

  • Brazil

  • Argentina

  • Rest of Latin America

Request for Country Level Research Report: Country Level Customization Request

Available Customization 

With the given market data, SNS Insider offers customization as per the company’s specific needs. The following customization options are available for the report: 

  • Detailed Volume Analysis 

  • Criss-Cross segment analysis (e.g. Product X Application) 

  • Competitive Product Benchmarking 

  • Geographic Analysis 

  • Additional countries in any of the regions 

  • Customized Data Representation 

  • Detailed analysis and profiling of additional market players

Explore Key Insights.


  • Analyzes market trends, forecasts, and regional dynamics
  • Covers core offerings, innovations, and industry use cases
  • Profiles major players, value chains, and strategic developments
  • Highlights innovation trends, regulatory impacts, and growth opportunities
Request an Analyst Call