SMART PORT MARKET KEY INSIGHTS:

To Get More Information on Smart Port Market - Request Sample Report
The Smart Port Market Size was valued at USD 2.88 Billion in 2023 and is expected to reach USD 19.63 Billion by 2032 and growing at a CAGR of 23.82% over the forecast period 2024-2032.
At the back of strategic policies, profound technological innovations in key regions such as Japan, China, USA, France, Germany, and India have facilitated tremendous growth in Smart Port Market. In Japan, Ministry of Land, Infrastructure, Transport, and Tourism encouraged the adoption of AI and IoT technologies in 2023 to enhance cargo management, predictive maintenance, and operational efficiencies. China again stepped at the top with smart infrastructure innovations, introducing AI-powered logistics systems that resulted in handling more cargo as well as better resource allocation, according to industry websites. A higher integration of 5G networks had also been undertaken during this period in Chinese ports, reinforcing the issue of effective real-time communication and remote monitoring.
In the USA, the improvement in smart port development is supported by the Infrastructure Investment and Jobs Act, whose funds will go toward modernization projects implemented sustainably with a digitalise vision. By 2024, the adoption of electric vehicles and automated cranes in the major ports had reduced emissions during operation. United Kingdom developed the infrastructures for cybersecurity and data-sharing for ports in the year 2023, encouraging different stakeholders to collaborate and undertaking secure data sharing practices. The English Channel is the world's most-used shipping lane. More than 500 vessels use it daily to get from the North Sea into the Atlantic and from the United Kingdom to continental Europe – and vice versa. More than 16 million people and 5 million trucks cross the roughly 170 ports and harbours of the Channel each year. Major ports include Portsmouth, Le Havre, Cherbourg and Brest.
India's Sagarmala project under the Ministry of Ports, Shipping, and Waterways by way of blockchain-based cargo tracking and data analytics by 2024 has goal of reducing logistics costs for EXIM and domestic trade. Gradual shifting of the global world towards sustainability and adoption of green technologies opens new doors to future opportunities as desired by international maritime organisations to cut down carbon footprint and manage and optimise port operation. The integrations of renewable sources of energy along with automation and data-centric port operations are likely to offer great growth opportunities as countries are looking to port ecosystems to become more environmentally friendly and efficient.
MARKET DYNAMICS
KEY DRIVERS:
- Sustainability demands induce the implementation of smart, eco-friendly port technologies.
The sustainability push is turning out to become the major driver for smart port technologies. Shipping is powered almost entirely by fossil fuels, with the industry accounting for 2–3% of global CO2 emissions. Added to this is the influence from governments and international regulatory bodies. For instance, International Maritime Organization (IMO) Member States adopted the 2023 IMO Strategy on Reduction of GHG Emissions from Ships, which sets even stiffer targets against harmful emissions. The revised IMO GHG Strategy, approved at Marine Environment Protection Committee (MEPC 80) records a strengthened common goal to reach net-zero GHG emissions from international shipping by or around, i.e., close to 2050; commit to the uptake of alternative zero and near-zero GHG fuels by 2030; and establishes indicative check-points for international shipping to achieve net-zero GHG emissions for 2030 (by at least 20%, aiming at 30%) and 2040 (by at least 70%, aiming at 80%).
This trend can already be seen, for example in actions by US and German ports installing electrified cranes and AI-controlled energy management systems that have optimized energy use, reducing electricity consumption up to 15%. The policies and public expectations going forward are likely to continue to drive such development into greener practice.
- Advancements in technology lead to efficient cost-effective automated ports.
Another demand-driving factor is the integration of advanced technology that will also enhance efficiency and reduce costs. It is common to see ports experience congestion, labour shortages, and inefficiency in operations. The solutions in the automation practice, including AI-based cargo tracking, have been demonstrated to reduce the need for manual labour and enhance overall productivity. Adopting the aforementioned technologies, Japanese ports recorded decreases in downtime up to 12%. Through the Sagarmala Project of the Indian government, implementation of real-time analytics, as well as blockchain for cargo tracking has improved transparency of supply chains and streamlined delays of around 10%. Advancements like these enable ports to achieve more efficiency as they answer the growing demands for speed, reliability, and many other services.
RESTRAIN:
- High initial investment and technology sophistication act as a restraint to the expansion of the smart port.
Smart port technologies are highly expensive and technologically intensive, which has been a severe constraint for many ports. The reengineering of traditional seaports into comprehensive smart platforms entails significant initial investment in all the latest infrastructural equipment, IoT sensors, data management systems, and cybersecurity solutions. Industry reports indicate that the costs can go up to tens or hundreds of millions of dollars, which could be too pricey for smaller or developing ports.
Besides the cost aspect, setting up such systems involves lots of integration complexities, with training staff and ensuring their proper functionality by interoperability, among other things being maintained on strict levels of cybersecurity standards. With the massive amount of data generated by smart devices, ports also need to focus on issues related to data sharing. If government subsidies are not adequate or there is no public-private partnership, the associated capital costs of such investments can act as a deterrent to widespread deployment and may slow down overall growth in the Smart Port Market.
KEY SEGMENTATION ANALYSIS
BY PORT TYPE
Seaports held the largest market share for 2023, at 72.24% of market share, mainly because they played a significant role in the global trading world, combining the applications of advanced technologies for complete automation and sustainability. International commerce centres like seaports have become more advanced and highly utilized in smart technologies like AI-driven cargo management and real-time monitoring, making them not only highly efficient but sustainable as well.
The Inland Ports are very crucial parts of regional as well as domestic logistics, which is also poised to grow at the highest CAGR of 24.12% in the given forecast period of 2024 and 2032. The leading factors supporting this segment are rapid growth of e-commerce, increased usage of intermodal, and greater demand for more effective handling solutions of cargo so that congestions emerging at traditional seaports can be addressed. A part of this is because of strategic inland port development around major transportation nodes and the growing deployment of IoT and automation solutions. This will boost their contribution to the smart port's share.
BY THROUGHPUT CAPACITY
Extremely Busy Ports accounted for the largest market share with close to 49.77% market share as of 2023. These ports are associated with greater volumes of cargo and tend to include smarter technologies with regard to predictive maintenance and automatic cargo handling systems to effectively address the higher throughput. Advancements like connectivity through 5G networks and AI-based scheduling tools have been added dollops in their armoury.
Meanwhile, Moderately Busy Ports (5–18 million TEU) are expected to grow with the fastest CAGR of 24.19% during the forecast period 2024–2032. Increasing investments in the modernization of mid-tier ports have substantially raised growth in this segment as it enables them to compete with larger ports and improve logistics networks. The major factor for adoption in the segment is the reduction in operational bottlenecks as implemented by smart systems and improvement in turnaround times.
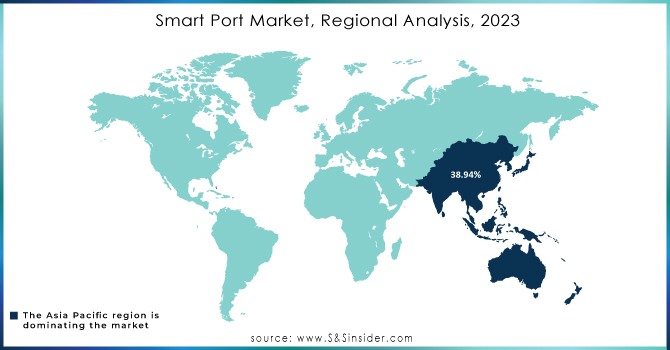
REGIONAL ANALYSIS
Asia Pacific held 38.94% of the market share as of 2023 due to massive investments in countries like China, Japan, and India for port modernization. Asia Pacific has hundreds of busy ports running from ancient times. Around 94,000 vessels pass through the Malacca Strait per year or use one of more than 40 ports. Altogether, the vessels account for some 30% of all traded goods around the world. The adoption of advanced technologies such as blockchain, AI, and IoT in major ports of these countries has significantly boosted the region's market position.
Asia Pacific is expected to grow with a strong CAGR of 24.28% during 2024 to 2032. Growth is largely backed up by rapid trade activities along with government initiatives pushing toward the utilization of digital and automated port operations. Its thrust towards sustainability and green technologies meshes with the ongoing global effort to make all maritime industries environmentally friendly and therefore supported the growth potential.
Do You Need any Customization Research on Smart Port Market - Inquire Now
KEY PLAYERS
Some of the major players in the Smart Port Market are
-
ABB (Automation Systems, Electric Solutions)
-
Siemens (Port Management Software, Electrical Infrastructure)
-
IBM (AI Solutions, Blockchain Port Platforms)
-
Huawei (5G Connectivity Solutions, Cloud Services)
-
General Electric (IoT Platforms, Smart Grid Solutions)
-
Schneider Electric (Energy Management Systems, Automation Tools)
-
Cisco Systems (Network Solutions, Cybersecurity Platforms)
-
Kongsberg Gruppen (Maritime Automation, Remote Operations)
-
Accenture (Digital Transformation Services, Data Analytics)
-
Wartsila (Port Optimization Software, Energy Systems)
-
Navis (Terminal Operating Systems, Predictive Analytics)
-
Trelleborg Marine Systems (Docking Solutions, Mooring Systems)
-
CyberLogitec (Terminal Management Software, Logistics Solutions)
-
Kalmar (Container Handling Equipment, Automated Crane Systems)
-
Cavotec (Automated Mooring Systems, Electric Charging Systems)
-
SAP SE (Supply Chain Software, Port Operations Management)
-
Royal HaskoningDHV (Port Design Services, Simulation Tools)
-
IndigoVision (Surveillance Systems, Port Security Solutions)
-
Microsoft (Cloud Platforms, AI-based Solutions)
-
Honeywell (Operational Management Systems, Safety Solutions)
MAJOR SUPPLIERS (Components, Technologies)
-
Intel (Semiconductors, Processors)
-
Qualcomm (Chipsets, Communication Hardware)
-
Bosch (Sensors, IoT Components)
-
TE Connectivity (Connectivity Solutions, Cables)
-
Mitsubishi Electric (Control Systems, Power Solutions)
-
Rockwell Automation (Automation Equipment, Controllers)
-
Analog Devices (Signal Processing Products, Sensors)
-
NXP Semiconductors (Microcontrollers, Security Solutions)
-
Infineon Technologies (Power Semiconductors, IoT Solutions)
-
Texas Instruments (Embedded Processors, Analog Components)
MAJOR CLIENTS
-
Port of Rotterdam
-
Port of Shanghai
-
Port of Singapore
-
Los Angeles Port Authority
-
Port of Hamburg
-
Port of Antwerp
-
Port of Long Beach
-
Port of Busan
-
Port of Tokyo
-
Jawaharlal Nehru Port Trust (JNPT)
-
Port of Felixstowe
-
Port of Valencia
-
Port of Hong Kong
-
Port of Ningbo-Zhoushan
-
Port of Oakland
-
Port of Sydney
-
Port of Barcelona
-
Port of Durban
-
Port of Gothenburg
-
Port of Santos
RECENT TRENDS
-
September 2024: China's Fujian Mawei Shipbuilding is building 10 platform supply vessels (PSVs) for Greek shipowner Capital Offshore, which will be equipped with energy storage systems that will assist in the reduction of emissions during dynamic positioning (DP) operations and provide a power boost when required. Kongsberg Maritime will deliver a comprehensive portfolio of propulsion, electrical and automation systems for the new fleet of 10 vessels, manufactured under a contract valued at Nkr800M (US$732M).
-
August 2024: Kongsberg Maritime passed a significant milestone in the cyber security of its products with the completion of testing to satisfy the requirements of IACS UR E27 based on IEC 62443, for example, with certification to DNV Cyber Security Profile 1. The tests involved a range of several of its digital products, including automation, navigation, and Dynamic Positioning systems.
| Report Attributes | Details |
|---|---|
| Market Size in 2023 | US$ 2.88 Billion |
| Market Size by 2032 | US$ 19.63 Billion |
| CAGR | CAGR of 23.82 % From 2024 to 2032 |
| Base Year | 2023 |
| Forecast Period | 2024-2032 |
| Historical Data | 2020-2022 |
| Report Scope & Coverage | Market Size, Segments Analysis, Competitive Landscape, Regional Analysis, DROC & SWOT Analysis, Forecast Outlook |
| Key Segments | • By Port Type (Seaport, Inland Port), • By Technology (Internet of Things (IoT), Blockchain, Process Automation, Artificial Intelligence (AI)), • By Element (Terminal Automation & Cargo Handling, Port Community Systems (PCS), Smart Safety & Security, Traffic Management Systems (TMS), Smart Port Infrastructure), • By Throughput Capacity (Extensively Busy Ports (Above 18 million TEU), Moderately Busy Ports (5–18 million TEU), Scarcely Busy Ports (Below 5 million TEU)) |
| Regional Analysis/Coverage | North America (US, Canada, Mexico), Europe (Eastern Europe [Poland, Romania, Hungary, Turkey, Rest of Eastern Europe] Western Europe] Germany, France, UK, Italy, Spain, Netherlands, Switzerland, Austria, Rest of Western Europe]), Asia Pacific (China, India, Japan, South Korea, Vietnam, Singapore, Australia, Rest of Asia Pacific), Middle East & Africa (Middle East [UAE, Egypt, Saudi Arabia, Qatar, Rest of Middle East], Africa [Nigeria, South Africa, Rest of Africa], Latin America (Brazil, Argentina, Colombia, Rest of Latin America) |
| Company Profiles | ABB, Siemens, IBM, Huawei, General Electric, Schneider Electric, Cisco Systems, Kongsberg Gruppen, Accenture, Wartsila, Navis, Trelleborg Marine Systems, CyberLogitec, Kalmar, Cavotec, SAP SE, Royal HaskoningDHV, IndigoVision, Microsoft, Honeywell. |
| Key Drivers | • Sustainability demands induce the implementation of smart, eco-friendly port technologies. • Advancements in technology lead to efficient cost-effective automated ports. |
| Restraints | • High initial investment and technology sophistication act as a restraint to the expansion of the smart port. |
Get in Touch
