image

Compounding Chemotherapy Market Size, Share, & Segmentation By Drug Type (Cytotoxic Drugs, Hormonal Agents, Immunomodulatory Agents, Targeted Therapies, and Supportive Care Drugs), Compounding Method (Aseptic Compounding and Non-aseptic Compounding), Cancer Type (Breast Cancer, Lung Cancer, Colorectal Cancer, Prostate Cancer, Leukemia, Lymphoma, and Other Specific Cancer Types), Route of Administration (Intravenous (IV), Oral, Subcutaneous (SC), Intramuscular (IM), and Intrathecal (IT)), Distribution Channel (Hospital Pharmacies, Retail Pharmacies, and Online Pharmacies), and Region | Global Forecast For 2025-2032

Date: July 2025 Report Code: SNS/HC/7816 Page 368

Compounding Chemotherapy Market Report Scope & Overview:

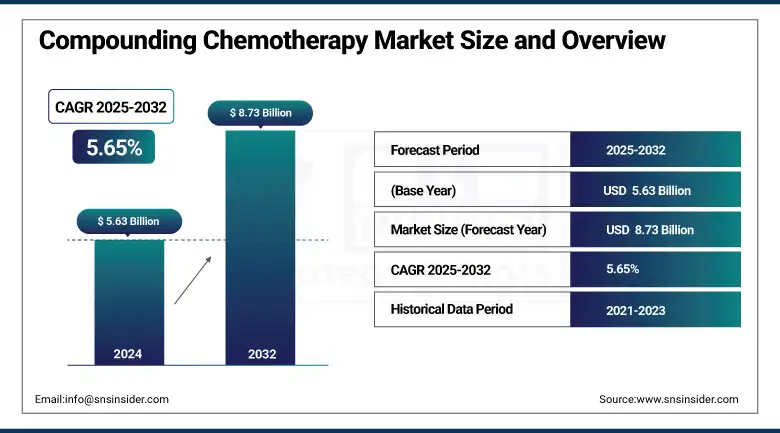
The compounding chemotherapy market size was valued at USD 5.63 billion in 2024 and is expected to reach USD 8.73 billion by 2032, growing at a CAGR of 5.65% over 2025-2032.

Rising prevalence of cancer and demand for a personalized treatment approach, accompanied by a rising need for sterile and safe drug formulations, are propelling the global compounding chemotherapy market. Dose modification requirements, particularly in pediatric and geriatric oncology, are further driving the requirement for compounded chemotherapy services. There is growing evidence that, as of the latest count, close to 60% of oncology treatments are now at levels of drug compounding where treatments need to be mixed or dosages adjusted to tailor regimens for patients.

For instance, Grifols diversified its sterile compounding holdings with investments in oncology infusion centers, and custom chemotherapy dosing solutions are increasingly a focus in the industry.

Moreover, the lack of commercially available chemotherapy drugs is causing a breakdown in the logistics of the supply chain, which is leading healthcare entities to make greater investments in clean rooms. Increasing spending by the government and private sector companies, and a rise in the number of oncology centers in developing countries, are, on the other hand, driving the compounding chemotherapy market growth. Rising USP standards and more FDA approvals are encouraging hospitals to utilize complex compounding technologies. Moreover, there is increased focus on the compounding chemotherapy market analysis with increased R&D spending that has surged over 20% in the last three years in the field of oncology, indicating the industry’s momentum of innovation, maintaining safety, and drug delivery models.

In 2024, Baxter International Inc. partnered with oncology centers in the U.S. to launch robotic IV compounding systems to improve safety and accuracy, marking a fundamental leap in the compounding chemotherapy market growth.

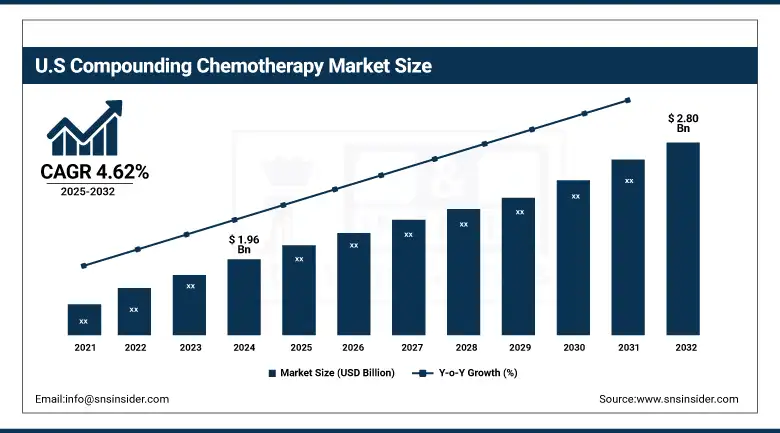
Table: Top Compounded Chemotherapy Drugs by Frequency (2024)

Drug Name

Primary Use

Frequency of Compounding (Approximate %)

Cyclophosphamide

Breast, Lymphoma

18%

Methotrexate

Leukemia, Breast

15%

5-Fluorouracil (5-FU)

Colorectal, Gastric Cancers

14%

Paclitaxel

Lung, Breast

12%

Dexamethasone

Supportive Care

10%

Market Dynamics:

Drivers:

  • Rising Cancer Burden, Customization Demand, and Regulatory Push Fuel Market Expansion

The growth of the compounding chemotherapy market is significantly attributed to the increase in global cancer prevalence that exceeds 20 million new incident cases annually (WHO, 2023), resulting in requirements for personalized treatment protocols. One-size-fits-all chemotherapy drugs of the past typically fall short in addressing the unique needs of patients, particularly in pediatric and geriatric populations, and are driving demand for compounding chemotherapy solutions.

Rising healthcare spending and government initiatives for improving oncology care are also contributing to the adoption. Additionally, hospitals are building in-house compounding units because of increased drug shortages. The U.S. FDA recorded 130+ shortages of oncology drugs in just the last five years. Furthermore, significant investments are being made in automated sterile compounding systems, which are enhanced in both technology and AI to prevent human error. Oncology R&D costs have escalated beyond USD 75 billion globally, improving the pipeline of novel chemotherapeutic agents that often must be compounded to induce their effects. Regulatory changes, including USP and USP, are also driving the market by requiring strict handling and compounding practices, forcing healthcare facilities to upgrade and stay compliant. This structural shift and advancements in technology will continue to bolster the compounding chemotherapy industry outlook over the years ahead.

Restraints:

  • Infrastructure Gaps, Skilled Labor Shortage, and High Setup Costs Limit Market Penetration

The compounding chemotherapy market, while showing growth potential, still has certain operational and economic limitations. The main hurdle is the absence of sophisticated aseptic compounding facilities, particularly in low- and middle-income countries, where such control of cleanrooms, isolators, and laminar airflow hoods is scarce. For a compliant sterile compounding room, the initial cost can be upwards of USD 1.5 million, and this includes equipment, software, and staff training, a huge financial burden for a smaller hospital or an independent oncology clinic. Additionally, the market is restricted due to a lack of trained compounding pharmacists and technicians in hazardous drug handling.

One in three or more healthcare facilities are struggling to find pharmacists with the skills needed to fill oncology compounding positions, according to the American Society of Health-System Pharmacists (ASHP). Furthermore, adherence to new regulations, such as USP, is economically costly and documentation-heavy, thereby disincentivizing implementation in low‐resource settings. Supply chain inconsistencies, particularly with high-quality API-sourcing (active pharmaceutical ingredients), add to production cycle pressures. Together, all of these factors put the brakes on the adoption curve, especially in the emerging markets, and they could temper the compounding chemotherapy market-share-growth even as global demand mounts.

Segmentation Analysis:

By Drug Type

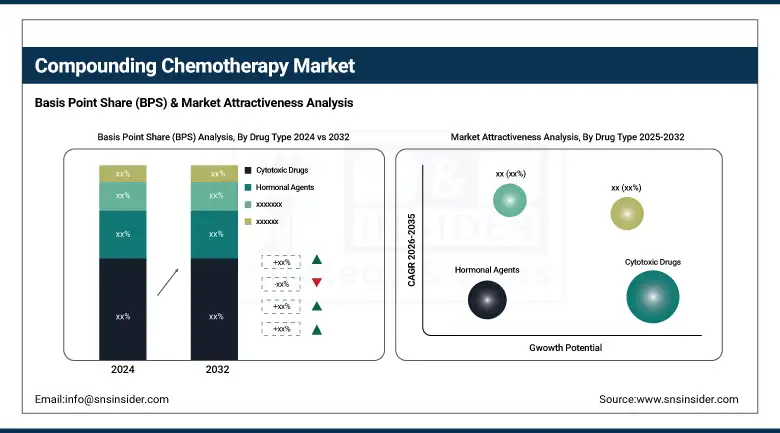
In 2024, cytotoxic agents were leading with a 42% compounding chemotherapy market share because of their long-standing history across several indications and established clinical efficacy. Such drugs are often compounded for dosage adaptation, especially in children. The rate of growth for targeted therapies is the most rapid, as the market continues to expand, as more personalized oncology treatments are approved, and precision dosing is required. Advancements in biomarker-driven therapies and companion diagnostics have led to an increase in personalized compounding and are thus the prime reasons contributing to the key market driver for this segment for the future compounding chemotherapy market.

By Compounding Method

Aseptic compounding held the largest share of the compounding chemotherapy market analysis in 2024. This is mainly due to the requirement of sterile products in intravenous chemotherapy and mandates governing the quality and storage of compounded drugs through USP and Pharmaceutical companies invest billions in clean rooms, isolators, and automation to comply, overcoming the risk of contamination. This is also the fastest-growing segment, driven by strict safety regulations, particularly with high-risk oncology drugs. Focus on minimization of medication errors, enhancement of drug safety continues to drive investments in aseptic compounding technologies.

By Cancer Type

Breast cancer was the leading segment in 2024 due to the high prevalence of breast cancer globally and an increase in the utilization of compounded hormonal and targeted therapy for each stage of the cancer. This is primarily based on customized treatment schedules and a regimen that is maintained long-term. At the same time, lung cancer, on the other hand, has dynamically become the fastest-growing segment, with the rising incidence of non-small cell lung cancer and the increasing use of targeted agents such as the EGFR and the ALK inhibitors, in need of tailored compounding to guarantee effective, patient-specific dosing.

By Route of Administration

The Intravenous segment was the largest in 2024, with 61% compounding chemotherapy market share, since the majority of cytotoxic and supportive care agents are administered intravenously to allow for immediate bioavailability and effectiveness. The hospital inpatient environment still depends predominantly on IV compounding for safety and sterility. The fastest-growing administration pathway is the oral route, due to the rising availability of oral CHM (chemotherapy drugs), better patient compliance, and greater demand for home care. Pharmacy-directed oral compounding 34 Pharmaceutical compounding allows dose variability, which can be important for pediatric and geriatric oncology patients.

By Distribution Channel

In 2024, hospital pharmacies led with a share of 54% in the compounding chemotherapy market due to more advanced sterile compounding capabilities and better-prepared, trained personnel to handle hazardous chemotherapy medications. Stronger regulations and increasing drug shortages are behind the drive for in-house compounding.

Online pharmacies are the fastest-growing segment, as they profit from surging online consultations between patients and doctors, home cancer treatments, and better logistics. These delivery systems may be particularly beneficial for oral and adjunctively compounded therapies made available directly to patients, thereby creating an increase in convenience and patient access.

Regional Analysis:

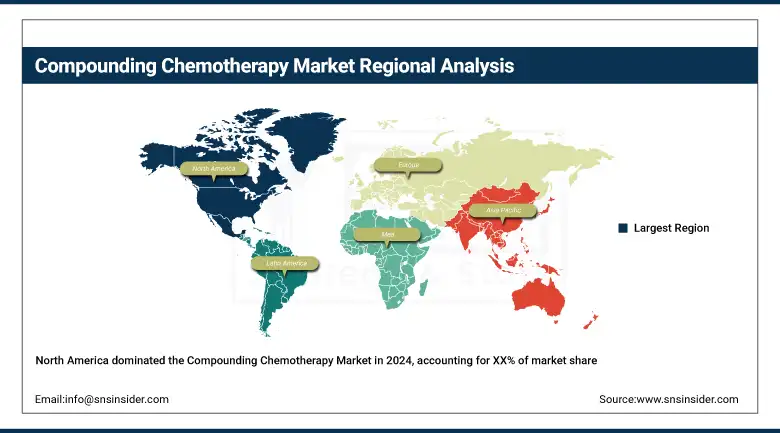
The compounding chemotherapy market was led by North America in 2024 due to well well-developed healthcare sector, high burden of cancer, and stringent regulatory compliances, such as USP. The market was dominated by the region, attributed to higher uptake of sterile compounding facilities and automation.

The U.S. compounding chemotherapy market size was valued at USD 1.96 billion in 2024 and is expected to reach USD 2.80 billion by 2032, growing at a CAGR of 4.62% over 2025-2032. The U.S. is a major country and a region driven by over 1.9 million new cases of cancer, as estimated already in 2023 (American Cancer Society), as well as the strong presence of oncology centers and compounding pharmacies. Rising investments in oncology R&D (over USD 20 billion per year) also add to market maturity. Healthcare facilities in Canada are increasingly adopting compounding automation for hospital pharmacies, whereas in Mexico, urban cancer treatment centers are proliferating. Mexico is the fastest-growing region in North America, benefiting from increased public health investment and growing access to compounding infrastructure in tier-1 hospitals.

Europe is a significant market in the compounding chemotherapy market share, as it is well supported by the government, has centralized healthcare systems, and has a more mature patient base for chronic cancer conditions. Germany tops the region in 2024, due to the established and concurrent established oncology landscape in the country, and the adoption of sterile compounding practices in large hospitals. There were more than 500,000 new cancer cases reported in 2023 in Germany, and the compounding regulations in Germany are very stringent for patient safety. The UK and France are other leading contributors, with the UK’s NHS leading on compounding robotics to enhance cancer care delivery. Poland is the fastest-growing market in the region because of the extensive modernization of hospital pharmacies and increased government allocation for oncology services. The rise in the number of physicians adopting compounding services in Eastern Europe (Turkey included) is anticipated to outpace that of Western countries due to growing private investments.

Asia Pacific is expected to be the fastest-growing market in the compounding chemotherapy market trends due to the increasing number of cancer patients, increasing access to healthcare, as well as the increasing trend of personalized treatments. China leads the regional market on account of the highest number of cancer cases globally, which was more than 4.5 million in 2023, and increasing investments in hospital pharmacy automation and oncology research. China’s National Health Commission is meanwhile pushing for higher standards of chemotherapy compounding in public hospitals. India is moving ahead fast with an increase in the demand for dose-specific cancer treatment, and with the government initiatives for cancer screening. Japan makes another major contribution with its mature population and high use of tailor-made chemotherapy. South Korea and Australia are adopting robotic IV compounding solutions, fostering regional compounding chemotherapies market growth.

Table: Regulatory Compliance Timeline – Key Guidelines by Region

Region

Guideline Implemented

Year of Enforcement

Primary Focus

U.S.

USP <800>

2023

Hazardous Drug Handling

Europe

EU GMP Annex 1

2023

Sterile Manufacturing Standards

Asia-Pacific

China GMP Amendment

2024

Oncology Drug Compounding

Latin America

ANVISA Update (Brazil)

2023

Chemotherapy Compounding Safety

Key Players:

Prominent compounding chemotherapy companies operating in the market include Fresenius Kabi AG, Baxter International Inc., Fagron NV, B. Braun Melsungen AG, Medisca Inc., Advanced Pharma Inc., McGuff Compounding Pharmacy Services Inc., Central Admixture Pharmacy Services Inc. (CAPS), PharMEDium Services LLC (AmerisourceBergen), and Dougherty's Holdings Inc.

Recent Developments:

  • In May 2025, Baxter International Inc. posted a 5% year-over-year increase in global sales (totaling USD 2.63 billion) and raised its full-year EPS forecast. The performance reflects robust demand for its Medical Products & Therapies, including compounding syringes and infusion systems.

  • In August 2024, Fresenius Kabi was honored with the Premier Inc. Trailblazer Award for innovative and resilient U.S. supply chain management. This recognition highlights its strengthened capacity in sterile injectables and oncology drug delivery.

Compounding Chemotherapy Market Report Scope:

Report Attributes Details
Market Size in 2024 USD 5.63 billion    
Market Size by 2032 USD 8.73 billion            
CAGR CAGR of 5.65% From 2025 to 2032
Base Year 2024
Forecast Period 2025-2032
Historical Data 2021-2023
Report Scope & Coverage Market Size, Segments Analysis, Competitive Landscape, Regional Analysis, DROC & SWOT Analysis, Forecast Outlook
Key Segments • By Drug Type (Cytotoxic Drugs, Hormonal Agents, Immunomodulatory Agents, Targeted Therapies, and Supportive Care Drugs)
• By Compounding Method (Aseptic Compounding, Non-aseptic Compounding)
• By Cancer Type (Breast Cancer, Lung Cancer, Colorectal Cancer, Prostate Cancer, Leukemia, Lymphoma, and Other Specific Cancer Types)
• By Route of Administration (Intravenous (IV), Oral, Subcutaneous (SC), Intramuscular (IM), and Intrathecal (IT))
• By Distribution Channel (Hospital Pharmacies, Retail Pharmacies, and Online Pharmacies)
Regional Analysis/Coverage North America (US, Canada, Mexico), Europe (Germany, France, UK, Italy, Spain, Poland, Turkey, Rest of Europe), Asia Pacific (China, India, Japan, South Korea, Singapore, Australia, Rest of Asia Pacific), Middle East & Africa (UAE, Saudi Arabia, Qatar, South Africa, Rest of Middle East & Africa), Latin America (Brazil, Argentina, Rest of Latin America)
Company Profiles Fresenius Kabi AG, Baxter International Inc., Fagron NV, B. Braun Melsungen AG, Medisca Inc., Advanced Pharma Inc., McGuff Compounding Pharmacy Services Inc., Central Admixture Pharmacy Services Inc. (CAPS), PharMEDium Services LLC (AmerisourceBergen), and Dougherty's Holdings Inc.

Frequently Asked Questions

Ans: Key growth drivers include the rise in cancer treatment demand, increasing drug shortages, and the push for safer, sterile chemotherapy mixing standards, especially for high-risk injectable oncology drugs.

Ans: Key pharmaceutical compounding trends include the use of robotic systems for sterile compounding, the adoption of AI in workflow optimization, and increasing demand for home-based chemotherapy care.

Ans: The compounding chemotherapy market analysis shows strong growth potential driven by technological upgrades, regulatory alignment (e.g., USP <800>), and expanding oncology-focused compounding services worldwide.

Ans: Major compounding chemotherapy companies include Baxter International, Fresenius Kabi, Fagron NV, Medisca, and CAPS, all focusing on enhancing safe and compliant oncology compounding operations.

Ans: Strict guidelines like USP <800> have increased the demand for sterile infrastructure and automated compounding systems to safely manage injectable oncology drugs and hazardous agents.

Table of Contents:

1. Introduction

1.1 Market Definition

1.2 Scope (Inclusion and Exclusions)

1.3 Research Assumptions

2. Executive Summary

2.1 Market Overview

2.2 Regional Synopsis

2.3 Competitive Summary

3. Research Methodology

3.1 Top-Down Approach

3.2 Bottom-up Approach

3.3. Data Validation

3.4 Primary Interviews

4. Market Dynamics Impact Analysis

4.1 Market Driving Factors Analysis

4.1.1 Drivers

4.1.2 Restraints

4.2 PESTLE Analysis

4.3 Porter’s Five Forces Model

5. Statistical Insights and Trends Reporting

5.1 Cancer Incidence and Prevalence, by Type and Region (2024)

5.2 Chemotherapy Prescription Trends, by Cancer Type and Region (2024)

5.3 Regulatory Inspection and Compliance Trends (2021–2024)

5.4 Subcutaneous (SC) Drug Spending by Payer Type (Government, Commercial, Private, Out-of-Pocket), by Region (2024)

6. Competitive Landscape

6.1 List of Major Companies, By Region

6.2 Market Share Analysis, By Region

6.3 Product Benchmarking

6.3.1 Product specifications and features

6.3.2 Pricing

6.4 Strategic Initiatives

6.4.1 Marketing and promotional activities

6.4.2 Distribution and supply chain strategies

6.4.3 Expansion plans and new product launches

6.4.4 Strategic partnerships and collaborations

6.5 Technological Advancements

6.6 Market Positioning and Branding

7. Compounding Chemotherapy Market Segmentation, By Drug Type

7.1 Chapter Overview

7.2 Cytotoxic Drugs

7.2.1 Cytotoxic Drugs Market Trends Analysis (2021-2032)

7.2.2 Cytotoxic Drugs Market Size Estimates and Forecasts to 2032 (USD Billion)

7.3 Hormonal Agents

7.3.1 Hormonal Agents Market Trends Analysis (2021-2032)

7.3.2 Hormonal Agents Market Size Estimates and Forecasts to 2032 (USD Billion)

7.4 Immunomodulatory Agents

7.4.1 Immunomodulatory Agents Market Trends Analysis (2021-2032)

7.4.2 Immunomodulatory Agents Market Size Estimates and Forecasts to 2032 (USD Billion)

7.5 Targeted Therapies

7.5.1 Targeted Therapies Market Trends Analysis (2021-2032)

7.5.2 Targeted Therapies Market Size Estimates and Forecasts to 2032 (USD Billion)

7.6 Supportive Care Drugs

7.6.1 Supportive Care Drugs Market Trends Analysis (2021-2032)

7.6.2 Supportive Care Drugs Market Size Estimates and Forecasts to 2032 (USD Billion)

8. Compounding Chemotherapy Market Segmentation, By Compounding Method

8.1 Chapter Overview

8.2 Aseptic Compounding

8.2.1 Aseptic Compounding Market Trends Analysis (2021-2032)

8.2.2 Aseptic Compounding Market Size Estimates And Forecasts To 2032 (USD Billion)

8.3 Non-aseptic Compounding

8.3.1 Non-aseptic Compounding Market Trends Analysis (2021-2032)

8.3.2 Non-aseptic Compounding Market Size Estimates And Forecasts To 2032 (USD Billion)

9. Compounding Chemotherapy Market Segmentation, By Cancer Type

    1. Chapter Overview

  9.2 Breast Cancer

9.2.1 Breast Cancer Market Trends Analysis (2021-2032)

9.2.2 Breast Cancer Market Size Estimates And Forecasts To 2032 (USD Billion)

9.3 Lung Cancer

 9.3.1 Lung Cancer Market Trends Analysis (2021-2032)

9.3.2 Lung Cancer Market Size Estimates And Forecasts To 2032 (USD Billion)

9.4 Colorectal Cancer

9.4.1 Colorectal Cancer Market Trends Analysis (2021-2032)

9.4.2 Colorectal Cancer Market Size Estimates And Forecasts To 2032 (USD Billion)

9.5 Prostate Cancer

9.5.1 Prostate Cancer Market Trends Analysis (2021-2032)

9.5.2 Prostate Cancer Market Size Estimates And Forecasts To 2032 (USD Billion)

9.6 Leukemia

9.6.1 Leukemia Market Trends Analysis (2021-2032)

9.6.2 Leukemia Market Size Estimates And Forecasts To 2032 (USD Billion)

9.7 Lymphoma

9.7.1 Lymphoma Market Trends Analysis (2021-2032)

9.7.2 Lymphoma Market Size Estimates And Forecasts To 2032 (USD Billion)

9.8 Other Specific Cancer Types

9.8.1 Other Specific Cancer Types Market Trends Analysis (2021-2032)

9.8.2 Other Specific Cancer Types Market Size Estimates And Forecasts To 2032 (USD Billion)

10. Compounding Chemotherapy Market By Route of Administration

10.1 Chapter Overview

10.2 Intravenous (IV)

10.2.1 Intravenous (IV) Market Trends Analysis (2021-2032)

10.2.2 Intravenous (IV) Market Size Estimates And Forecasts To 2032 (USD Billion)

10.3 Oral

10.3.1 Oral Market Trends Analysis (2021-2032)

10.3.2 Oral Market Size Estimates And Forecasts To 2032 (USD Billion)

10.4 Subcutaneous (SC)

10.4.1 Subcutaneous (SC) Market Trends Analysis (2021-2032)

10.4.2 Subcutaneous (SC) Market Size Estimates And Forecasts To 2032 (USD Billion)

10.5 Intramuscular (IM)

10.5.1 Intramuscular (IM) Market Trends Analysis (2021-2032)

10.5.2 Intramuscular (IM) Market Size Estimates And Forecasts To 2032 (USD Billion)

10.6 Intrathecal (IT)

10.6.1 Intrathecal (IT) Market Trends Analysis (2021-2032)

10.6.2 Intrathecal (IT) Market Size Estimates And Forecasts To 2032 (USD Billion)

11. Automotive Ambient Lighting Market, By Distribution Channel

11.1 Chapter Overview

11.2 Hospital Pharmacies

11.2.1 Hospital Pharmacies Market Trends Analysis (2021-2032)

11.2.2 Hospital Pharmacies Market Size Estimates And Forecasts To 2032 (USD Billion)

11.3 Retail Pharmacies

11.3.1 Retail Pharmacies Market Trends Analysis (2021-2032)

11.3.2 Retail Pharmacies Market Size Estimates And Forecasts To 2032 (USD Billion)

11.4 Online Pharmacies

11.4.1 Online Pharmacies Market Trends Analysis (2021-2032)

11.4.2 Online Pharmacies Market Size Estimates And Forecasts To 2032 (USD Billion)

12. Regional Analysis

12.1 Chapter Overview

12.2 North America

12.2.1 Trends Analysis

12.2.2 North America Compounding Chemotherapy Market Estimates And Forecasts, By Country (2021-2032) (USD Billion)

12.2.3 North America Compounding Chemotherapy Market Estimates And Forecasts, By Drug Type (2021-2032) (USD Billion)

12.2.4 North America Compounding Chemotherapy Market Estimates And Forecasts, By Compounding Method (2021-2032) (USD Billion)

12.2.5 North America Compounding Chemotherapy Market Estimates And Forecasts, By Cancer Type (2021-2032) (USD Billion)

12.2.6 North America Compounding Chemotherapy Market Estimates And Forecasts, By Route of Administration (2021-2032) (USD Billion)

12.2.7 North America Compounding Chemotherapy Market Estimates And Forecasts, By Distribution Channel (2021-2032) (USD Billion)

12.2.8 USA

12.2.8.1 USA Compounding Chemotherapy Market Estimates And Forecasts, By Drug Type (2021-2032) (USD Billion)

12.2.8.2 USA Compounding Chemotherapy Market Estimates And Forecasts, By Compounding Method (2021-2032) (USD Billion)

12.2.8.3 USA Compounding Chemotherapy Market Estimates And Forecasts, By Cancer Type (2021-2032) (USD Billion)

12.2.8.4 USA Compounding Chemotherapy Market Estimates And Forecasts, By Route of Administration (2021-2032) (USD Billion)

12.2.8.5 USA Compounding Chemotherapy Market Estimates And Forecasts, By Distribution Channel (2021-2032) (USD Billion)

12.2.9 Canada

12.2.9.1 Canada Compounding Chemotherapy Market Estimates And Forecasts, By Drug Type (2021-2032) (USD Billion)

12.2.9.2 Canada Compounding Chemotherapy Market Estimates And Forecasts, By Compounding Method (2021-2032) (USD Billion)

12.2.9.3 Canada Compounding Chemotherapy Market Estimates And Forecasts, By Cancer Type (2021-2032) (USD Billion)

12.2.9.4 Canada Compounding Chemotherapy Market Estimates And Forecasts, By Route of Administration (2021-2032) (USD Billion)

12.2.9.5 Canada Compounding Chemotherapy Market Estimates And Forecasts, By Distribution Channel (2021-2032) (USD Billion)

12.2.10 Mexico

12.2.10.1 Mexico Compounding Chemotherapy Market Estimates And Forecasts, By Drug Type (2021-2032) (USD Billion)

12.2.10.2 Mexico Compounding Chemotherapy Market Estimates And Forecasts, By Compounding Method (2021-2032) (USD Billion)

12.2.10.3 Mexico Compounding Chemotherapy Market Estimates And Forecasts, By Cancer Type (2021-2032) (USD Billion)

12.2.10.4 Mexico Compounding Chemotherapy Market Estimates And Forecasts, By Route of Administration (2021-2032) (USD Billion)

12.2.10.5 Mexico Compounding Chemotherapy Market Estimates And Forecasts, By Distribution Channel (2021-2032) (USD Billion)

12.3 Europe

12.3.1 Trends Analysis

12.3.2 Europe Compounding Chemotherapy Market Estimates And Forecasts, By Country (2021-2032) (USD Billion)

12.3.3 Europe Compounding Chemotherapy Market Estimates And Forecasts, By Drug Type (2021-2032) (USD Billion)

12.3.4 Europe Compounding Chemotherapy Market Estimates And Forecasts, By Compounding Method (2021-2032) (USD Billion)

12.3.5 Europe Compounding Chemotherapy Market Estimates And Forecasts, By Cancer Type (2021-2032) (USD Billion)

12.3.6 Europe Compounding Chemotherapy Market Estimates And Forecasts, By Route of Administration (2021-2032) (USD Billion)

12.3.7 Europe Compounding Chemotherapy Market Estimates And Forecasts, By Distribution Channel (2021-2032) (USD Billion)

12.3.8 Poland

12.3.8.1 Poland Compounding Chemotherapy Market Estimates And Forecasts, By Drug Type (2021-2032) (USD Billion)

12.3.8.2 Poland Compounding Chemotherapy Market Estimates And Forecasts, By Compounding Method (2021-2032) (USD Billion)

12.3.8.3 Poland Compounding Chemotherapy Market Estimates And Forecasts, By Cancer Type (2021-2032) (USD Billion)

12.3.8.4 Poland Compounding Chemotherapy Market Estimates And Forecasts, By Route of Administration (2021-2032) (USD Billion)

12.3.8.5 Poland Compounding Chemotherapy Market Estimates And Forecasts, By Distribution Channel (2021-2032) (USD Billion)

12.3.9 Turkey

12.3.9.1 Turkey Compounding Chemotherapy Market Estimates And Forecasts, By Drug Type (2021-2032) (USD Billion)

12.3.9.2 Turkey Compounding Chemotherapy Market Estimates And Forecasts, By Compounding Method (2021-2032) (USD Billion)

12.3.9.3 Turkey Compounding Chemotherapy Market Estimates And Forecasts, By Cancer Type (2021-2032) (USD Billion)

12.3.9.4 Turkey Compounding Chemotherapy Market Estimates And Forecasts, By Route of Administration (2021-2032) (USD Billion)

12.3.9.5 Turkey Compounding Chemotherapy Market Estimates And Forecasts, By Distribution Channel (2021-2032) (USD Billion)

12.3.10 Germany

12.3.10.1 Germany Compounding Chemotherapy Market Estimates And Forecasts, By Drug Type (2021-2032) (USD Billion)

12.3.10.2 Germany Compounding Chemotherapy Market Estimates And Forecasts, By Compounding Method (2021-2032) (USD Billion)

12.3.10.3 Germany Compounding Chemotherapy Market Estimates And Forecasts, By Cancer Type (2021-2032) (USD Billion)

12.3.10.4 Germany Compounding Chemotherapy Market Estimates And Forecasts, By Route of Administration (2021-2032) (USD Billion)

12.3.10.5 Germany Compounding Chemotherapy Market Estimates And Forecasts, By Distribution Channel (2021-2032) (USD Billion)

12.3.11 France

12.3.11.1 France Compounding Chemotherapy Market Estimates And Forecasts, By Drug Type (2021-2032) (USD Billion)

12.3.11.2 France Compounding Chemotherapy Market Estimates And Forecasts, By Compounding Method (2021-2032) (USD Billion)

12.3.11.3 France Compounding Chemotherapy Market Estimates And Forecasts, By Cancer Type (2021-2032) (USD Billion)

12.3.11.4 France Compounding Chemotherapy Market Estimates And Forecasts, By Route of Administration (2021-2032) (USD Billion)

12.3.11.5 France Compounding Chemotherapy Market Estimates And Forecasts, By Distribution Channel (2021-2032) (USD Billion)

12.3.12 UK

12.3.12.1 UK Compounding Chemotherapy Market Estimates And Forecasts, By Drug Type (2021-2032) (USD Billion)

12.3.12.2 UK Compounding Chemotherapy Market Estimates And Forecasts, By Compounding Method (2021-2032) (USD Billion)

12.3.12.3 UK Compounding Chemotherapy Market Estimates And Forecasts, By Cancer Type (2021-2032) (USD Billion)

12.3.12.4 UK Compounding Chemotherapy Market Estimates And Forecasts, By Route of Administration (2021-2032) (USD Billion)

12.3.12.5 UK Compounding Chemotherapy Market Estimates And Forecasts, By Distribution Channel (2021-2032) (USD Billion)

12.3.13 Italy

12.3.13.1 Italy Compounding Chemotherapy Market Estimates And Forecasts, By Drug Type (2021-2032) (USD Billion)

12.3.13.2 Italy Compounding Chemotherapy Market Estimates And Forecasts, By Compounding Method (2021-2032) (USD Billion)

12.3.13.3 Italy Compounding Chemotherapy Market Estimates And Forecasts, By Cancer Type (2021-2032) (USD Billion)

12.3.13.4 Italy Compounding Chemotherapy Market Estimates And Forecasts, By Route of Administration (2021-2032) (USD Billion)

12.3.13.5 Italy Compounding Chemotherapy Market Estimates And Forecasts, By Distribution Channel (2021-2032) (USD Billion)

12.3.14 Spain

12.3.14.1 Spain Compounding Chemotherapy Market Estimates And Forecasts, By Drug Type (2021-2032) (USD Billion)

12.3.14.2 Spain Compounding Chemotherapy Market Estimates And Forecasts, By Compounding Method (2021-2032) (USD Billion)

12.3.14.3 Spain Compounding Chemotherapy Market Estimates And Forecasts, By Cancer Type (2021-2032) (USD Billion)

12.3.14.4 Spain Compounding Chemotherapy Market Estimates And Forecasts, By Route of Administration (2021-2032) (USD Billion)

12.3.14.5 Spain Compounding Chemotherapy Market Estimates And Forecasts, By Distribution Channel (2021-2032) (USD Billion)

12.3.15 Rest Of Europe

12.3.15.1 Rest Of Western Europe Compounding Chemotherapy Market Estimates And Forecasts, By Drug Type (2021-2032) (USD Billion)

12.3.15.2 Rest Of Western Europe Compounding Chemotherapy Market Estimates And Forecasts, By Compounding Method (2021-2032) (USD Billion)

12.3.15.3 Rest Of Western Europe Compounding Chemotherapy Market Estimates And Forecasts, By Cancer Type (2021-2032) (USD Billion)

12.3.15.4 Rest Of Western Europe Compounding Chemotherapy Market Estimates And Forecasts, By Route of Administration (2021-2032) (USD Billion)

12.3.15.5 Rest Of Western Europe Compounding Chemotherapy Market Estimates And Forecasts, By Distribution Channel (2021-2032) (USD Billion)

12.4 Asia Pacific

12.4.1 Trends Analysis

12.4.2 Asia Pacific Compounding Chemotherapy Market Estimates And Forecasts, By Country (2021-2032) (USD Billion)

12.4.3 Asia Pacific Compounding Chemotherapy Market Estimates And Forecasts, By Drug Type (2021-2032) (USD Billion)

12.4.4 Asia Pacific Compounding Chemotherapy Market Estimates And Forecasts, By Compounding Method (2021-2032) (USD Billion)

12.4.5 Asia Pacific Compounding Chemotherapy Market Estimates And Forecasts, By Cancer Type (2021-2032) (USD Billion)

12.4.6 Asia Pacific Compounding Chemotherapy Market Estimates And Forecasts, By Route of Administration (2021-2032) (USD Billion)

12.4.7 Asia Pacific Compounding Chemotherapy Market Estimates And Forecasts, By Distribution Channel (2021-2032) (USD Billion)

12.4.8 China

12.4.8.1 China Compounding Chemotherapy Market Estimates And Forecasts, By Drug Type (2021-2032) (USD Billion)

12.4.8.2 China Compounding Chemotherapy Market Estimates And Forecasts, By Compounding Method (2021-2032) (USD Billion)

12.4.8.3 China Compounding Chemotherapy Market Estimates And Forecasts, By Cancer Type (2021-2032) (USD Billion)

12.4.8.4 China Compounding Chemotherapy Market Estimates And Forecasts, By Route of Administration (2021-2032) (USD Billion)

12.4.8.5 China Compounding Chemotherapy Market Estimates And Forecasts, By Distribution Channel (2021-2032) (USD Billion)

12.4.9 India

12.4.9.1 India Compounding Chemotherapy Market Estimates And Forecasts, By Drug Type (2021-2032) (USD Billion)

12.4.9.2 India Compounding Chemotherapy Market Estimates And Forecasts, By Compounding Method (2021-2032) (USD Billion)

12.4.9.3 India Compounding Chemotherapy Market Estimates And Forecasts, By Cancer Type (2021-2032) (USD Billion)

12.4.9.4 India Compounding Chemotherapy Market Estimates And Forecasts, By Route of Administration (2021-2032) (USD Billion)

12.4.9.5 India Compounding Chemotherapy Market Estimates And Forecasts, By Distribution Channel (2021-2032) (USD Billion)

12.4.10 Japan

12.4.10.1 Japan Compounding Chemotherapy Market Estimates And Forecasts, By Drug Type (2021-2032) (USD Billion)

12.4.10.2 Japan Compounding Chemotherapy Market Estimates And Forecasts, By Compounding Method (2021-2032) (USD Billion)

12.4.10.3 Japan Compounding Chemotherapy Market Estimates And Forecasts, By Cancer Type (2021-2032) (USD Billion)

12.4.10.4 Japan Compounding Chemotherapy Market Estimates And Forecasts, By Route of Administration (2021-2032) (USD Billion)

12.4.10.5 Japan Compounding Chemotherapy Market Estimates And Forecasts, By Distribution Channel (2021-2032) (USD Billion)

12.4.11 South Korea

12.4.11.1 South Korea Compounding Chemotherapy Market Estimates And Forecasts, By Drug Type (2021-2032) (USD Billion)

12.4.11.2 South Korea Compounding Chemotherapy Market Estimates And Forecasts, By Compounding Method (2021-2032) (USD Billion)

12.4.11.3 South Korea Compounding Chemotherapy Market Estimates And Forecasts, By Cancer Type (2021-2032) (USD Billion)

12.4.11.4 South Korea Compounding Chemotherapy Market Estimates And Forecasts, By Route of Administration (2021-2032) (USD Billion)

12.4.11.5 South Korea Compounding Chemotherapy Market Estimates And Forecasts, By Distribution Channel (2021-2032) (USD Billion)

12.4.12 Singapore

12.4.12.1 Singapore Compounding Chemotherapy Market Estimates And Forecasts, By Drug Type (2021-2032) (USD Billion)

12.4.12.2 Singapore Compounding Chemotherapy Market Estimates And Forecasts, By Compounding Method (2021-2032) (USD Billion)

12.4.12.3 Singapore Compounding Chemotherapy Market Estimates And Forecasts, By Cancer Type (2021-2032) (USD Billion)

12.4.12.4 Singapore Compounding Chemotherapy Market Estimates And Forecasts, By Route of Administration (2021-2032) (USD Billion)

12.4.12.5 Singapore Compounding Chemotherapy Market Estimates And Forecasts, By Distribution Channel (2021-2032) (USD Billion)

12.4.13 Australia

12.4.13.1 Australia Compounding Chemotherapy Market Estimates And Forecasts, By Drug Type (2021-2032) (USD Billion)

12.4.13.2 Australia Compounding Chemotherapy Market Estimates And Forecasts, By Compounding Method (2021-2032) (USD Billion)

12.4.13.3 Australia Compounding Chemotherapy Market Estimates And Forecasts, By Cancer Type (2021-2032) (USD Billion)

12.4.13.4 Australia Compounding Chemotherapy Market Estimates And Forecasts, By Route of Administration (2021-2032) (USD Billion)

12.4.13.5 Australia Compounding Chemotherapy Market Estimates And Forecasts, By Distribution Channel (2021-2032) (USD Billion)

12.4.14 Rest Of Asia Pacific

12.4.14.1 Rest Of Asia Pacific Compounding Chemotherapy Market Estimates And Forecasts, By Drug Type (2021-2032) (USD Billion)

12.4.14.2 Rest Of Asia Pacific Compounding Chemotherapy Market Estimates And Forecasts, By Compounding Method (2021-2032) (USD Billion)

12.4.14.3 Rest Of Asia Pacific Compounding Chemotherapy Market Estimates And Forecasts, By Cancer Type (2021-2032) (USD Billion)

12.4.14.4 Rest Of Asia Pacific Compounding Chemotherapy Market Estimates And Forecasts, By Route of Administration (2021-2032) (USD Billion)

12.4.14.5 Rest Of Asia Pacific Compounding Chemotherapy Market Estimates And Forecasts, By Distribution Channel (2021-2032) (USD Billion)

12.5 Middle East And Africa

12.5.1 Trends Analysis

12.5.2 Middle East And Africa Compounding Chemotherapy Market Estimates And Forecasts, By Country (2021-2032) (USD Billion)

12.5.3 Middle East And Africa Compounding Chemotherapy Market Estimates And Forecasts, By Drug Type (2021-2032) (USD Billion)

12.5.4 Middle East And Africa Compounding Chemotherapy Market Estimates And Forecasts, By Compounding Method (2021-2032) (USD Billion)

12.5.5 Middle East And Africa Compounding Chemotherapy Market Estimates And Forecasts, By Cancer Type (2021-2032) (USD Billion)

12.5.6 Middle East And Africa Compounding Chemotherapy Market Estimates And Forecasts, By Route of Administration (2021-2032) (USD Billion)

12.5.7 Middle East And Africa Compounding Chemotherapy Market Estimates And Forecasts, By Distribution Channel (2021-2032) (USD Billion)

12.5.8 UAE

12.5.8.1 UAE Compounding Chemotherapy Market Estimates And Forecasts, By Drug Type (2021-2032) (USD Billion)

12.5.8.2 UAE Compounding Chemotherapy Market Estimates And Forecasts, By Compounding Method (2021-2032) (USD Billion)

12.5.8.3 UAE Compounding Chemotherapy Market Estimates And Forecasts, By Cancer Type (2021-2032) (USD Billion)

12.5.8.4 UAE Compounding Chemotherapy Market Estimates And Forecasts, By Route of Administration (2021-2032) (USD Billion)

12.5.8.5 UAE Compounding Chemotherapy Market Estimates And Forecasts, By Distribution Channel (2021-2032) (USD Billion)

12.5.9 Saudi Arabia

12.5.9.1 Saudi Arabia Compounding Chemotherapy Market Estimates And Forecasts, By Drug Type (2021-2032) (USD Billion)

12.5.9.2 Saudi Arabia Compounding Chemotherapy Market Estimates And Forecasts, By Compounding Method (2021-2032) (USD Billion)

12.5.9.3 Saudi Arabia Compounding Chemotherapy Market Estimates And Forecasts, By Cancer Type (2021-2032) (USD Billion)

12.5.9.4 Saudi Arabia Compounding Chemotherapy Market Estimates And Forecasts, By Route of Administration (2021-2032) (USD Billion)

12.5.9.5 Saudi Arabia Compounding Chemotherapy Market Estimates And Forecasts, By Distribution Channel (2021-2032) (USD Billion)

12.5.10 Qatar

12.5.10.1 Qatar Compounding Chemotherapy Market Estimates And Forecasts, By Drug Type (2021-2032) (USD Billion)

12.5.10.2 Qatar Compounding Chemotherapy Market Estimates And Forecasts, By Compounding Method (2021-2032) (USD Billion)

12.5.10.3 Qatar Compounding Chemotherapy Market Estimates And Forecasts, By Cancer Type (2021-2032) (USD Billion)

12.5.10.4 Qatar Compounding Chemotherapy Market Estimates And Forecasts, By Route of Administration (2021-2032) (USD Billion)

12.5.10.5 Qatar Compounding Chemotherapy Market Estimates And Forecasts, By Distribution Channel (2021-2032) (USD Billion)

12.5.11 South Africa

12.5.11.1 South Africa Compounding Chemotherapy Market Estimates And Forecasts, By Drug Type (2021-2032) (USD Billion)

12.5.11.2 South Africa Compounding Chemotherapy Market Estimates And Forecasts, By Compounding Method (2021-2032) (USD Billion)

12.5.11.3 South Africa Compounding Chemotherapy Market Estimates And Forecasts, By Cancer Type (2021-2032) (USD Billion)

12.5.11.4 South Africa Compounding Chemotherapy Market Estimates And Forecasts, By Route of Administration (2021-2032) (USD Billion)

12.5.11.5 South Africa Compounding Chemotherapy Market Estimates And Forecasts, By Distribution Channel (2021-2032) (USD Billion)

12.5.12 Rest Of Africa

12.5.12.1 Rest Of Africa Compounding Chemotherapy Market Estimates And Forecasts, By Drug Type (2021-2032) (USD Billion)

12.5.12.2 Rest Of Africa Compounding Chemotherapy Market Estimates And Forecasts, By Compounding Method (2021-2032) (USD Billion)

12.5.12.3 Rest Of Africa Compounding Chemotherapy Market Estimates And Forecasts, By Cancer Type (2021-2032) (USD Billion)

12.5.12.4 Rest Of Africa Compounding Chemotherapy Market Estimates And Forecasts, By Route of Administration (2021-2032) (USD Billion)

12.5.12.5 Rest Of Africa Compounding Chemotherapy Market Estimates And Forecasts, By Distribution Channel (2021-2032) (USD Billion)

12.6 Latin America

12.6.1 Trends Analysis

12.6.2 Latin America Compounding Chemotherapy Market Estimates And Forecasts, By Country (2021-2032) (USD Billion)

12.6.3 Latin America Compounding Chemotherapy Market Estimates And Forecasts, By Drug Type (2021-2032) (USD Billion)

12.6.4 Latin America Compounding Chemotherapy Market Estimates And Forecasts, By Compounding Method (2021-2032) (USD Billion)

12.6.5 Latin America Compounding Chemotherapy Market Estimates And Forecasts, By Cancer Type (2021-2032) (USD Billion)

12.6.6 Latin America Compounding Chemotherapy Market Estimates And Forecasts, By Route of Administration  (2021-2032) (USD Billion)

12.6.7 Latin America Compounding Chemotherapy Market Estimates And Forecasts, By Distribution Channel (2021-2032) (USD Billion)

12.6.8 Brazil

12.6.8.1 Brazil Compounding Chemotherapy Market Estimates And Forecasts, By Drug Type (2021-2032) (USD Billion)

12.6.8.2 Brazil Compounding Chemotherapy Market Estimates And Forecasts, By Compounding Method (2021-2032) (USD Billion)

12.6.8.3 Brazil Compounding Chemotherapy Market Estimates And Forecasts, By Cancer Type (2021-2032) (USD Billion)

12.6.8.4 Brazil Compounding Chemotherapy Market Estimates And Forecasts, By Route of Administration (2021-2032) (USD Billion)

12.6.8.5 Brazil Compounding Chemotherapy Market Estimates And Forecasts, By Distribution Channel (2021-2032) (USD Billion)

12.6.9 Argentina

12.6.9.1 Argentina Compounding Chemotherapy Market Estimates And Forecasts, By Drug Type (2021-2032) (USD Billion)

12.6.9.2 Argentina Compounding Chemotherapy Market Estimates And Forecasts, By Compounding Method (2021-2032) (USD Billion)

12.6.9.3 Argentina Compounding Chemotherapy Market Estimates And Forecasts, By Cancer Type (2021-2032) (USD Billion)

12.6.9.4 Argentina Compounding Chemotherapy Market Estimates And Forecasts, By Route of Administration (2021-2032) (USD Billion)

12.6.9.5 Argentina Compounding Chemotherapy Market Estimates And Forecasts, By Distribution Channel (2021-2032) (USD Billion)

12.6.10 Rest Of Latin America

12.6.10.1 Rest Of Latin America Compounding Chemotherapy Market Estimates And Forecasts, By Drug Type (2021-2032) (USD Billion)

12.6.10.2 Rest Of Latin America Compounding Chemotherapy Market Estimates And Forecasts, By Compounding Method (2021-2032) (USD Billion)

12.6.10.3 Rest Of Latin America Compounding Chemotherapy Market Estimates And Forecasts, By Cancer Type (2021-2032) (USD Billion)

12.6.10.4 Rest Of Latin America Compounding Chemotherapy Market Estimates And Forecasts, By Route of Administration (2021-2032) (USD Billion)

12.6.10.5 Rest Of Latin America Compounding Chemotherapy Market Estimates And Forecasts, By Distribution Channel (2021-2032) (USD Billion)

13. Company Profiles

     13.1 Fresenius Kabi AG

13.1.1 Company Overview

13.1.2 Financial

13.1.3 Products/ Services Offered

13.1.4 SWOT Analysis

    13.2 Baxter International Inc.

13.2.1 Company Overview

13.2.2 Financial

13.2.3 Products/ Services Offered

13.2.4 SWOT Analysis

   13.3 Fagron NV

13.3.1 Company Overview

13.3.2 Financial

13.3.3 Products/ Services Offered

13.3.4 SWOT Analysis

  13.4 B. Braun Melsungen AG

13.4.1 Company Overview

13.4.2 Financial

13.4.3 Products/ Services Offered

13.4.4 SWOT Analysis

  13.5 Medisca Inc.

13.5.1 Company Overview

13.5.2 Financial

13.5.3 Products/ Services Offered

13.5.4 SWOT Analysis

  13.6 Advanced Pharma Inc.

13.6.1 Company Overview

13.6.2 Financial

13.6.3 Products/ Services Offered

13.6.4 SWOT Analysis

 13.7 McGuff Compounding Pharmacy Services Inc.

13.7.1 Company Overview

13.7.2 Financial

13.7.3 Products/ Services Offered

13.7.4 SWOT Analysis

 13.8 Central Admixture Pharmacy Services Inc. (CAPS)

13.8.1 Company Overview

13.8.2 Financial

13.8.3 Products/ Services Offered

13.8.4 SWOT Analysis

 13.9 PharMEDium Services LLC (AmerisourceBergen)

13.9.1 Company Overview

13.9.2 Financial

13.9.3 Products/ Services Offered

13.9.4 SWOT Analysis

 13.10 Dougherty's Holdings Inc.

13.10.1 Company Overview

13.10.2 Financial

13.10.3 Products/ Services Offered

13.10.4 SWOT Analysis

14. Use Cases and Best Practices

15. Conclusion

An accurate research report requires proper strategizing as well as implementation. There are multiple factors involved in the completion of good and accurate research report and selecting the best methodology to compete the research is the toughest part. Since the research reports we provide play a crucial role in any company’s decision-making process, therefore we at SNS Insider always believe that we should choose the best method which gives us results closer to reality. This allows us to reach at a stage wherein we can provide our clients best and accurate investment to output ratio.

Each report that we prepare takes a timeframe of 350-400 business hours for production. Starting from the selection of titles through a couple of in-depth brain storming session to the final QC process before uploading our titles on our website we dedicate around 350 working hours. The titles are selected based on their current market cap and the foreseen CAGR and growth.


The 5 steps process:

Step 1: Secondary Research:

Secondary Research or Desk Research is as the name suggests is a research process wherein, we collect data through the readily available information. In this process we use various paid and unpaid databases which our team has access to and gather data through the same. This includes examining of listed companies’ annual reports, Journals, SEC filling etc. Apart from this our team has access to various associations across the globe across different industries. Lastly, we have exchange relationships with various university as well as individual libraries.

Secondary Research

Step 2: Primary Research

When we talk about primary research, it is a type of study in which the researchers collect relevant data samples directly, rather than relying on previously collected data.  This type of research is focused on gaining content specific facts that can be sued to solve specific problems. Since the collected data is fresh and first hand therefore it makes the study more accurate and genuine.

We at SNS Insider have divided Primary Research into 2 parts.

Part 1 wherein we interview the KOLs of major players as well as the upcoming ones across various geographic regions. This allows us to have their view over the market scenario and acts as an important tool to come closer to the accurate market numbers. As many as 45 paid and unpaid primary interviews are taken from both the demand and supply side of the industry to make sure we land at an accurate judgement and analysis of the market.

This step involves the triangulation of data wherein our team analyses the interview transcripts, online survey responses and observation of on filed participants. The below mentioned chart should give a better understanding of the part 1 of the primary interview.

Primary Research

Part 2: In this part of primary research the data collected via secondary research and the part 1 of the primary research is validated with the interviews from individual consultants and subject matter experts.

Consultants are those set of people who have at least 12 years of experience and expertise within the industry whereas Subject Matter Experts are those with at least 15 years of experience behind their back within the same space. The data with the help of two main processes i.e., FGDs (Focused Group Discussions) and IDs (Individual Discussions). This gives us a 3rd party nonbiased primary view of the market scenario making it a more dependable one while collation of the data pointers.

Step 3: Data Bank Validation

Once all the information is collected via primary and secondary sources, we run that information for data validation. At our intelligence centre our research heads track a lot of information related to the market which includes the quarterly reports, the daily stock prices, and other relevant information. Our data bank server gets updated every fortnight and that is how the information which we collected using our primary and secondary information is revalidated in real time.

Data Bank Validation

Step 4: QA/QC Process

After all the data collection and validation our team does a final level of quality check and quality assurance to get rid of any unwanted or undesired mistakes. This might include but not limited to getting rid of the any typos, duplication of numbers or missing of any important information. The people involved in this process include technical content writers, research heads and graphics people. Once this process is completed the title gets uploader on our platform for our clients to read it.

Step 5: Final QC/QA Process:

This is the last process and comes when the client has ordered the study. In this process a final QA/QC is done before the study is emailed to the client. Since we believe in giving our clients a good experience of our research studies, therefore, to make sure that we do not lack at our end in any way humanly possible we do a final round of quality check and then dispatch the study to the client.

Key Segments

By Drug Type

  • Cytotoxic Drugs

  • Hormonal Agents

  • Immunomodulatory Agents

  • Targeted Therapies

  • Supportive Care Drugs

By Compounding Method

  • Aseptic Compounding

  • Non-aseptic Compounding

By Cancer Type

  • Breast Cancer

  • Lung Cancer

  • Colorectal Cancer

  • Prostate Cancer

  • Leukemia

  • Lymphoma

  • Other specific cancer types

By Route of Administration

  • Intravenous (IV)

  • Oral

  • Subcutaneous (SC)

  • Intramuscular (IM)

  • Intrathecal (IT)

By Distribution Channel

  • Hospital Pharmacies

  • Retail Pharmacies

  • Online Pharmacies

Request for Segment Customization as per your Business Requirement: Segment Customization Request

Regional Coverage: 

North America

  • US

  • Canada

  • Mexico

Europe

  • Germany

  • France

  • UK

  • Italy

  • Spain

  • Poland

  • Turkey

  • Rest of Europe

Asia Pacific

  • China

  • India

  • Japan

  • South Korea

  • Singapore

  • Australia

  • Rest of Asia Pacific

Middle East & Africa

  • UAE

  • Saudi Arabia

  • Qatar

  • South Africa

  • Rest of Middle East & Africa

Latin America

  • Brazil

  • Argentina

  • Rest of Latin America

Request for Country Level Research Report: Country Level Customization Request

Available Customization 

With the given market data, SNS Insider offers customization as per the company’s specific needs. The following customization options are available for the report: 

  • Detailed Volume Analysis 

  • Criss-Cross segment analysis (e.g., Product X Application) 

  • Competitive Product Benchmarking 

  • Geographic Analysis 

  • Additional countries in any of the regions 

  • Customized Data Representation 

  • Detailed analysis and profiling of additional market players

Explore Key Insights.


  • Analyzes market trends, forecasts, and regional dynamics
  • Covers core offerings, innovations, and industry use cases
  • Profiles major players, value chains, and strategic developments
  • Highlights innovation trends, regulatory impacts, and growth opportunities
Request an Analyst Call