image

Diabetic Food Market Report Scope & Overview:

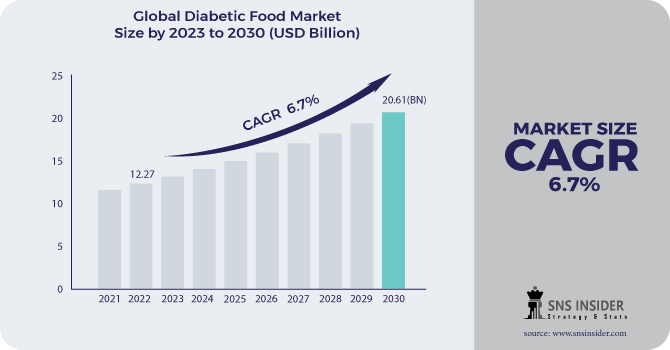
Diabetic Food Market Size was valued at USD 12.27 billion in 2022 and is expected to reach USD 20.61 billion by 2030, and grow at a CAGR of 6.7% over the forecast period 2023-2030.

Over the past few years, the market for foods for diabetics has seen substantial growth. Global demand for diabetic dietary products is mostly driven by rising diabetes prevalence. In addition, as a preventative measure to avoid diabetes, health-conscious consumers are expressing interest in low-calorie food products.

Diabetic Food Market

Due to the increased health consciousness around the world, consumers in several regions, including North America, Europe, Asia Pacific, and the Rest of the World , are demonstrating interest in diabetic food products. The market for diabetic food products is being positively impacted by both the growing number of health complications brought on by blood glucose increases and the aging of the population. Over the course of the projected period, it is anticipated that the aforementioned reasons would spur market expansion for diabetic foods worldwide.

Market Dynamics:

Driving Factors:

  • The rising diabetic population.

The market for diabetic foods has been driven by demand from the growing diabetic population, which has resulted in developments like low-sugar and whole-grain products. The industry has grown to incorporate a variety of diabetic-friendly products as consumers become more health-conscious. Consumers should exercise caution and knowledge when it comes to nutritional claims, though. This pattern reflects a wider shift toward more individualized food choices and healthier eating practices.

  • Manufacturers have continually used innovation to create foods that are both aesthetically pleasing and suitable for people with diabetes.     

Restraining Factors:

  • The price of the products is quite excessive in the diabetic market.

The market expansion for diabetic foods may be hampered by their comparatively high cost. It creates difficulties for affordability, restricts consumer access to the market, and could make customers reluctant as a result of perceived unfair price. This restriction may encourage people to select more reasonably priced normal foods, which may have an effect on how they manage their health. Manufacturers can solve this by looking into low-cost production techniques and working with healthcare professionals to improve accessibility and inform consumers about the importance of these specialty items.

  • Managing the many rules and regulations that govern nutritional labeling, specific diabetes-related claims, and health claims in general.

Opportunities:

  • Expanding familiarity with the Diabetic Food items and the rising utilization of sugar substitutes.

The market for diabetic foods is experiencing substantial growth due to rising sugar substitute use and increased consumer knowledge of diabetic dietary options. The market for diabetic-friendly goods is growing as more consumers become familiar with these specialty foods. Additionally, the growing popularity of sugar alternatives presents a special opportunity for the creation of low-sugar and sugar-free choices that will meet the demands of people who are controlling their diabetes. This tendency fits well with the general movement towards healthy eating practices and the need for substitutes that effectively control blood sugar levels.

  • Increasing the customer base by looking into neglected markets with rising diabetes rates.

Challenges:

  • Low awareness in general public is a major hurdle.

The general public's lack of awareness of diabetic food is one of the market's major obstacles. The significance and advantages of specialist diabetic food products may not be fully understood by many people, including those who have diabetes. This lack of knowledge may prevent potential customers from appreciating the benefit of these goods in managing their illness and making healthier eating decisions, which could limit the market's potential for growth.

  • Reducing distribution barriers to make diabetic-friendly products available to customers in a variety of locations, including rural ones.

Impact of Covid-19:

The COVID-19 pandemic is influencing Diabetic food through monetary and social framework shocks, food framework disturbances, and holes in fundamental wellbeing and nourishment administrations inclusion. In low-and centre pay nations, food frameworks should adjust and reinforce food and nourishment security following COVID-19.

IMPACT OF RUSSIAN UKRAINE WAR:

The impact of the Russia-Ukraine war on the market for diabetic food includes supply chain disruptions, probable trade restrictions, and economic uncertainty, which results in scarcity and higher prices. The management of diabetes may be hampered by conflicting healthcare priorities, price instability, and a shift away from research priorities, while access to and innovation in diabetic dietary products may be hampered.

During the first half of 2023, Nestlé, the company behind confectionery and NesCafe drink prices increased by 9%. During the second quarter, beverages average selling prices increased 10%. The cost of diabetic food increased 5.7% during the first half of the year.

Disruptions in the supply chain resulted in a shortage of ingredients or higher prices. Economic instability is altering consumer spending patterns, which results in a decline in the market for specialized foods. The cost of imported goods is increasing due to currency fluctuations. Consumer preferences is changing in favour of necessities, which is impacting demand for diabetes products. Access to certain foods restricted by import and export regulations. Supply availability may be impacted by the strain on the healthcare system.

IMPACT OF ONGOING RECESSION

The diabetic food market is experiencing a mixed response to the recent recession. Although consumers are gravitating toward more affordable solutions, the increased health consciousness is also driving up demand for high-end diabetic goods. Market trends change when customer tastes change to reflect the present state of the economy.

During the ongoing recession, the price of confectionery increased by 7.7%, and there will likely be further increases. Prices for 11 different snack kinds increased by 12.2 % on average at Confectionery. The Consumer Price Index shows that during the first half of 2023, food inflation increased by 5.7%.

Key Market Segmentation:

By Product type:

  • Confectionery

  • Snacks

  • Bakery Products

  • Dairy Products

  • Others

By Distribution Channel type:

  • Supermarkets & Hypermarkets

  • Specialty Stores

  • Online

  • Others

Diabetic Food Market

REGIONAL ANALYSIS

Due to the rising prevalence of diabetes and obesity in North American nations, particularly the US, North America presently holds the largest market share in the global diabetic food market and is predicted to continue to do so during the projection period. The prediabetes or diabetes affects more than 100 million persons in the United States. aging population growth of North America, as well as a predicted rise in the region's population adopting a healthy lifestyle to support the market expansion for diabetic meals.

The market for diabetic food is anticipated to expand at the fastest rate in Asia Pacific during the forecast period. It is anticipated that the growing populations of diabetics with high cholesterol, chronic renal disease, and obesity in nations like China and India will have a favourable impact on regional demand. Due to a high demand for these products, the dairy and confectionery industry is expected to grow rapidly in the Asia Pacific, supporting the expansion of the local diabetic food market.

REGIONAL COVERAGE:

North America

  • US

  • Canada

  • Mexico

Europe

  • Eastern Europe

    • Poland

    • Romania

    • Hungary

    • Turkey

    • Rest of Eastern Europe

  • Western Europe

    • Germany

    • France

    • UK

    • Italy

    • Spain

    • Netherlands

    • Switzerland

    • Austria

    • Rest of Western Europe

Asia Pacific

  • China

  • India

  • Japan

  • South Korea

  • Vietnam

  • Singapore

  • Australia

  • Rest of Asia Pacific

Middle East & Africa

  • Middle East

    • UAE

    • Egypt

    • Saudi Arabia

    • Qatar

    • Rest of Middle East

  • Africa

    • Nigeria

    • South Africa

    • Rest of Africa

Latin America

  • Brazil

  • Argentina

  • Colombia

  • Rest of Latin America  

Key Players:

Nestlé, Unilever, The Kellogg Company, Conagra Brands, Inc., Fifty 50 Foods, Inc., Mars Inc., Tyson Foods, Sushma Gram Udyog, The Hershey Company, Hain Celestial Group.

Conagra Brands, Inc-Company Financial Analysis

Company Landscape Analysis

RECENT DEVELOPMENT

  • In February 2022, Kate Farms, a manufacturer of glucose, will support 1.2 organic, plant-based Nutrition Shakes launched in North America for diabetes.

  • Nestlé, a manufacturer of food and beverages, introduced its first pre-diabetes program in Malaysia in December 2021. The program includes Nestle GlucoSmart, a unique food supplement that can be added to meals as part of a balanced diet to help maintain normal blood glucose levels after a meal.

  • New GLUCODOWN "enhanced water" drink mixes that were introduced by Glucose Health, Inc. in December 2021 are now sold on Amazon in the North American market.

  • To help people with diabetes and prediabetes manage their blood sugar, the Splenda sweetener brand introduced Splenda Diabetes Care Shakes in June 2020.   

Diabetic Food Market Report Scope:
Report Attributes Details
Market Size in 2022 US$ 12.27 Billion
Market Size by 2030 US$ 20.61 Billion
CAGR CAGR 6.7% From 2023 to 2030
Base Year 2022
Forecast Period 2023-2030
Historical Data 2019-2021
Report Scope & Coverage Market Size, Segments Analysis, Competitive  Landscape, Regional Analysis, DROC & SWOT Analysis, Forecast Outlook
Key Segments • by Product (Confectionery, Snacks)
• by Distribution Channel (Supermarkets & Hypermarkets, Online)
Regional Analysis/Coverage North America (US, Canada, Mexico), Europe (Eastern Europe [Poland, Romania, Hungary, Turkey, Rest of Eastern Europe] Western Europe] Germany, France, UK, Italy, Spain, Netherlands, Switzerland, Austria, Rest of Western Europe]), Asia Pacific (China, India, Japan, South Korea, Vietnam, Singapore, Australia, Rest of Asia Pacific), Middle East & Africa (Middle East [UAE, Egypt, Saudi Arabia, Qatar, Rest of Middle East], Africa [Nigeria, South Africa, Rest of Africa], Latin America (Brazil, Argentina, Colombia Rest of Latin America)
Company Profiles Nestlé, Unilever, The Kellogg Company, Conagra Brands, Inc., Fifty 50 Foods, Inc., Mars Inc., Tyson Foods, Sushma Gram Udyog, The Hershey Company, Hain Celestial Group
Key Drivers • The rising diabetic population.
• Manufacturers have continually used innovation to create foods that are both aesthetically pleasing and suitable for people with diabetes.
Market Opportunities • Expanding familiarity with the Diabetic Food items and the rising utilization of sugar substitutes.
• Increasing the customer base by looking into neglected markets with rising diabetes rates.

Frequently Asked Questions

Diabetic Food items are dietary items that incorporate diminished starch and sugar contents that assist in controlling the ascent of the blood glucose.

US$ 20.61 Billion is the expected market size in 2030.

Major players in market are Nestlé, Unilever, The Kellogg Company, Conagra Brands, Inc., Fifty 50 Foods, Inc., Mars Inc., Tyson Foods, Sushma Gram Udyog, The Hershey Company, and others in final report.

The forecast period of Diabetic Food market is 2022-2030.

The somewhat excessive cost of the Diabetic Food items.

TABLE OF CONTENT

1. Introduction
1.1 Market Definition
1.2 Scope
1.3 Research Assumptions

2. Research Methodology

3. Market Dynamics
3.1 Drivers
3.2 Restraints
3.3 Opportunities
3.4 Challenges

4. Impact Analysis
4.1 Impact of the Russia-Ukraine War
4.2 Impact of Ongoing Recession
4.2.1 Introduction
4.2.2 Impact on major economies
4.2.2.1 US
4.2.2.2 Canada
4.2.2.3 Germany
4.2.2.4 France
4.2.2.5 United Kingdom
4.2.2.6 China
4.2.2.7 Japan
4.2.2.8 South Korea
4.2.2.9 Rest of the World

5. Value Chain Analysis

6. Porter’s 5 forces model

7. PEST Analysis

8. Diabetic Food Market Segmentation, By Type
8.1 Confectionery
8.2 Snacks
8.3 Bakery Products
8.4 Dairy Products
8.5 Others

9. Diabetic Food Market Segmentation, By Distribution Channel type
9.1 Supermarkets & Hypermarkets
9.2 Specialty Stores
9.3 Online
9.4 Others

10. Regional Analysis
10.1 Introduction
10.2 North America
10.2.1 North America Diabetic Food Market by Country
10.2.2 North America Diabetic Food Market By Type
10.2.3 North America Diabetic Food Market By Distribution Channel type
10.2.4 USA
10.2.4.1 USA Diabetic Food Market By Type
10.2.4.2 USA Diabetic Food Market By Distribution Channel type
10.2.5 Canada
10.2.5.1 Canada Diabetic Food Market By Type
10.2.5.2 Canada Diabetic Food Market By Distribution Channel type
10.2.6 Mexico
10.2.6.1 Mexico Diabetic Food Market By Type
10.2.6.2 Mexico Diabetic Food Market By Distribution Channel type
10.3 Europe
10.3.1 Eastern Europe
10.3.1.1 Eastern Europe Diabetic Food Market by Country
10.3.1.2 Eastern Europe Diabetic Food Market By Type
10.3.1.3 Eastern Europe Diabetic Food Market By Distribution Channel type
10.3.1.4 Poland
10.3.1.4.1 Poland Diabetic Food Market By Type
10.3.1.4.2 Poland Diabetic Food Market By Distribution Channel type
10.3.1.5 Romania
10.3.1.5.1 Romania Diabetic Food Market By Type
10.3.1.5.2 Romania Diabetic Food Market By Distribution Channel type
10.3.1.6 Hungary
10.3.1.6.1 Hungary Diabetic Food Market By Type
10.3.1.6.2 Hungary Diabetic Food Market By Distribution Channel type
10.3.1.7 Turkey
10.3.1.7.1 Turkey Diabetic Food Market By Type
10.3.1.7.2 Turkey Diabetic Food Market By Distribution Channel type
10.3.1.8 Rest of Eastern Europe
10.3.1.8.1 Rest of Eastern Europe Diabetic Food Market By Type
10.3.1.8.2 Rest of Eastern Europe Diabetic Food Market By Distribution Channel type
10.3.2 Western Europe
10.3.2.1 Western Europe Diabetic Food Market by Country
10.3.2.2 Western Europe Diabetic Food Market By Type
10.3.2.3 Western Europe Diabetic Food Market By Distribution Channel type
10.3.2.4 Germany
10.3.2.4.1 Germany Diabetic Food Market By Type
10.3.2.4.2 Germany Diabetic Food Market By Distribution Channel type
10.3.2.5 France
10.3.2.5.1 France Diabetic Food Market By Type
10.3.2.5.2 France Diabetic Food Market By Distribution Channel type
10.3.2.6 UK
10.3.2.6.1 UK Diabetic Food Market By Type
10.3.2.6.2 UK Diabetic Food Market By Distribution Channel type
10.3.2.7 Italy
10.3.2.7.1 Italy Diabetic Food Market By Type
10.3.2.7.2 Italy Diabetic Food Market By Distribution Channel type
10.3.2.8 Spain
10.3.2.8.1 Spain Diabetic Food Market By Type
10.3.2.8.2 Spain Diabetic Food Market By Distribution Channel type
10.3.2.9 Netherlands
10.3.2.9.1 Netherlands Diabetic Food Market By Type
10.3.2.9.2 Netherlands Diabetic Food Market By Distribution Channel type
10.3.2.10 Switzerland
10.3.2.10.1 Switzerland Diabetic Food Market By Type
10.3.2.10.2 Switzerland Diabetic Food Market By Distribution Channel type
10.3.2.11 Austria
10.3.2.11.1 Austria Diabetic Food Market  By Type
10.3.2.11.2 Austria Diabetic Food Market By Distribution Channel type
10.3.2.12 Rest of Western Europe
10.3.2.12.1 Rest of Western Europe Diabetic Food Market By Type
10.3.2.12.2 Rest of Western Europe Diabetic Food Market By Distribution Channel type
10.4 Asia-Pacific
10.4.1 Asia Pacific Diabetic Food Market by Country
10.4.2 Asia Pacific Diabetic Food Market By Type
10.4.3 Asia Pacific Diabetic Food Market By Distribution Channel type
10.4.4 China
10.4.4.1 China Diabetic Food Market By Type
10.4.4.2 China Diabetic Food Market By Distribution Channel type
10.4.5 India
10.4.5.1 India Diabetic Food Market By Type
10.4.5.2 India Diabetic Food Market By Distribution Channel type
10.4.6 Japan
10.4.6.1 Japan Diabetic Food Market By Type
10.4.6.2 Japan Diabetic Food Market By Distribution Channel type
10.4.7 South Korea
10.4.7.1 South Korea Diabetic Food Market By Type
10.4.7.2 South Korea Diabetic Food Market By Distribution Channel type
10.4.8 Vietnam
10.4.8.1 Vietnam Diabetic Food Market By Type
10.4.8.2 Vietnam Diabetic Food Market By Distribution Channel type
10.4.9 Singapore
10.4.9.1 Singapore Diabetic Food Market By Type
10.4.9.2 Singapore Diabetic Food Market By Distribution Channel type
10.4.10 Australia
10.4.10.1 Australia Diabetic Food Market By Type
10.4.10.2 Australia Diabetic Food Market By Distribution Channel type
10.4.11 Rest of Asia-Pacific
10.4.11.1 Rest of Asia-Pacific Diabetic Food Market By Type
10.4.11.2 Rest of Asia-Pacific APAC Diabetic Food Market By Distribution Channel type
10.5 Middle East & Africa
10.5.1 Middle East
10.5.1.1 Middle East Diabetic Food Market by Country
10.5.1.2 Middle East Diabetic Food Market By Type
10.5.1.3 Middle East Diabetic Food Market By Distribution Channel type
10.5.1.4 UAE
10.5.1.4.1 UAE Diabetic Food Market By Type
10.5.1.4.2 UAE Diabetic Food Market By Distribution Channel type
10.5.1.5 Egypt
10.5.1.5.1 Egypt Diabetic Food Market By Type
10.5.1.5.2 Egypt Diabetic Food Market By Distribution Channel type
10.5.1.6 Saudi Arabia
10.5.1.6.1 Saudi Arabia Diabetic Food Market By Type
10.5.1.6.2 Saudi Arabia Diabetic Food Market By Distribution Channel type
10.5.1.7 Qatar
10.5.1.7.1 Qatar Diabetic Food Market  By Type
10.5.1.7.2 Qatar Diabetic Food Market By Distribution Channel type
10.5.1.8 Rest of Middle East
10.5.1.8.1 Rest of Middle East Diabetic Food Market By Type
10.5.1.8.2 Rest of Middle East Diabetic Food Market By Distribution Channel type
10.5.2 Africa
10.5.2.1 Africa Diabetic Food Market by Country
10.5.2.2 Africa Diabetic Food Market By Type
10.5.2.3 Africa Diabetic Food Market By Distribution Channel type
10.5.2.4 Nigeria
10.5.2.4.1 Nigeria Diabetic Food Market By Type
10.5.2.4.2 Nigeria Diabetic Food Market By Distribution Channel type
10.5.2.5 South Africa
10.5.2.5.1 South Africa Diabetic Food Market By Type
10.5.2.5.2 South Africa Diabetic Food Market By Distribution Channel type
10.5.2.6 Rest of Africa
10.5.2.6.1 Rest of Africa Diabetic Food Market By Type
10.5.2.6.2 Rest of Africa Diabetic Food Market By Distribution Channel type
10.6 Latin America
10.6.1 Latin America Diabetic Food Market by Country
10.6.2 Latin America Diabetic Food Market By Type
10.6.3 Latin America Diabetic Food Market By Distribution Channel type
10.6.4 Brazil
10.6.4.1 Brazil Diabetic Food Market By Type
10.6.4.2 Brazil Diabetic Food Market By Distribution Channel type
10.6.5 Argentina
10.6.5.1 Argentina Diabetic Food Market By Type
10.6.5.2 Argentina Diabetic Food Market By Distribution Channel type
10.6.6 Colombia
10.6.6.1 Colombia Diabetic Food Market By Type
10.6.6.2 Colombia Diabetic Food Market By Distribution Channel type
10.6.7 Rest of Latin America
10.6.7.1 Rest of Latin America Diabetic Food Market By Type
10.6.7.2 Rest of Latin America Diabetic Food Market By Distribution Channel type

11 Company Profile
11.1 Nestlé
11.1.1 Company Overview
11.1.2 Financials
11.1.3 Product/Services Offered
11.1.4 SWOT Analysis
11.1.5 The SNS View
11.2 Unilever
11.2.1 Company Overview
11.2.2 Financials
11.2.3 Product/Services Offered
11.2.4 SWOT Analysis
11.2.5 The SNS View
11.3 The Kellogg Company
11.3.1 Company Overview
11.3.2 Financials
11.3.3 Product/Services Offered
11.3.4 SWOT Analysis
11.3.5 The SNS View
11.4 Conagra Brands, Inc.
11.4 Company Overview
11.4.2 Financials
11.4.3 Product/Services Offered
11.4.4 SWOT Analysis
11.4.5 The SNS View
11.5 Fifty 50 Foods, Inc.
11.5.1 Company Overview
11.5.2 Financials
11.5.3 Product/Services Offered
11.5.4 SWOT Analysis
11.5.5 The SNS View
11.6 Mars Inc. 
11.6.1 Company Overview
11.6.2 Financials
11.6.3 Product/Services Offered
11.6.4 SWOT Analysis
11.6.5 The SNS View
11.7 Tyson Foods
11.7.1 Company Overview
11.7.2 Financials
11.7.3 Product/Services Offered
11.7.4 SWOT Analysis
11.7.5 The SNS View
11.8  Sushma Gram Udyog
11.8.1 Company Overview
11.8.2 Financials
11.8.3 Product/Services Offered
11.8.4 SWOT Analysis
11.8.5 The SNS View
11.9 The Hershey Company
11.9.1 Company Overview
11.9.2 Financials
11.9.3 Product/ Services Offered
11.9.4 SWOT Analysis
11.9.5 The SNS View
11.10 Hain Celestial Group
11.10.1 Company Overview
11.10.2 Financials
11.10.3 Product/Services Offered
11.10.4 SWOT Analysis
11.10.5 The SNS View

12. Competitive Landscape
12.1 Competitive Benchmarking
12.2 Market Share Analysis
12.3 Recent Developments
12.3.1 Industry News
12.3.2 Company News
12.3.3 Mergers & Acquisitions

13. USE Cases and Best Practices

14. Conclusion

An accurate research report requires proper strategizing as well as implementation. There are multiple factors involved in the completion of good and accurate research report and selecting the best methodology to compete the research is the toughest part. Since the research reports we provide play a crucial role in any company’s decision-making process, therefore we at SNS Insider always believe that we should choose the best method which gives us results closer to reality. This allows us to reach at a stage wherein we can provide our clients best and accurate investment to output ratio.

Each report that we prepare takes a timeframe of 350-400 business hours for production. Starting from the selection of titles through a couple of in-depth brain storming session to the final QC process before uploading our titles on our website we dedicate around 350 working hours. The titles are selected based on their current market cap and the foreseen CAGR and growth.


The 5 steps process:

Step 1: Secondary Research:

Secondary Research or Desk Research is as the name suggests is a research process wherein, we collect data through the readily available information. In this process we use various paid and unpaid databases which our team has access to and gather data through the same. This includes examining of listed companies’ annual reports, Journals, SEC filling etc. Apart from this our team has access to various associations across the globe across different industries. Lastly, we have exchange relationships with various university as well as individual libraries.

Secondary Research

Step 2: Primary Research

When we talk about primary research, it is a type of study in which the researchers collect relevant data samples directly, rather than relying on previously collected data.  This type of research is focused on gaining content specific facts that can be sued to solve specific problems. Since the collected data is fresh and first hand therefore it makes the study more accurate and genuine.

We at SNS Insider have divided Primary Research into 2 parts.

Part 1 wherein we interview the KOLs of major players as well as the upcoming ones across various geographic regions. This allows us to have their view over the market scenario and acts as an important tool to come closer to the accurate market numbers. As many as 45 paid and unpaid primary interviews are taken from both the demand and supply side of the industry to make sure we land at an accurate judgement and analysis of the market.

This step involves the triangulation of data wherein our team analyses the interview transcripts, online survey responses and observation of on filed participants. The below mentioned chart should give a better understanding of the part 1 of the primary interview.

Primary Research

Part 2: In this part of primary research the data collected via secondary research and the part 1 of the primary research is validated with the interviews from individual consultants and subject matter experts.

Consultants are those set of people who have at least 12 years of experience and expertise within the industry whereas Subject Matter Experts are those with at least 15 years of experience behind their back within the same space. The data with the help of two main processes i.e., FGDs (Focused Group Discussions) and IDs (Individual Discussions). This gives us a 3rd party nonbiased primary view of the market scenario making it a more dependable one while collation of the data pointers.

Step 3: Data Bank Validation

Once all the information is collected via primary and secondary sources, we run that information for data validation. At our intelligence centre our research heads track a lot of information related to the market which includes the quarterly reports, the daily stock prices, and other relevant information. Our data bank server gets updated every fortnight and that is how the information which we collected using our primary and secondary information is revalidated in real time.

Data Bank Validation

Step 4: QA/QC Process

After all the data collection and validation our team does a final level of quality check and quality assurance to get rid of any unwanted or undesired mistakes. This might include but not limited to getting rid of the any typos, duplication of numbers or missing of any important information. The people involved in this process include technical content writers, research heads and graphics people. Once this process is completed the title gets uploader on our platform for our clients to read it.

Step 5: Final QC/QA Process:

This is the last process and comes when the client has ordered the study. In this process a final QA/QC is done before the study is emailed to the client. Since we believe in giving our clients a good experience of our research studies, therefore, to make sure that we do not lack at our end in any way humanly possible we do a final round of quality check and then dispatch the study to the client.

Start a Conversation

Hi! Click one of our member below to chat on Phone