Differential Pressure Level Gauge Market Report Scope & Overview:
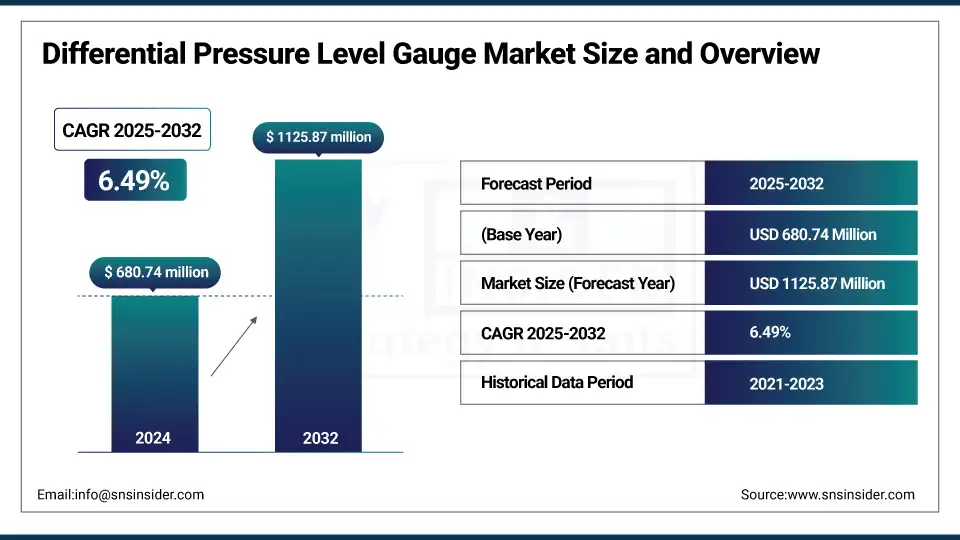
The Differential Pressure Level Gauge Market size was valued at USD 680.74 million in 2024 and is expected to reach USD 1125.87 million by 2032, growing at a CAGR of 6.49% over the forecast period of 2025-2032.
The Differential Pressure Level Gauge Market plays a critical role in industrial process control and fluid measurement applications, as it enables precise monitoring of liquid levels in pressurized tanks and vessels. Such gauges work on the principle of differential pressure, which is used to accurately measure liquid levels and are widely used in the oil & gas, chemicals, pharmaceuticals, water treatment, and power generation industries.
To Get more information On Differential Pressure Level Gauge Market - Request Free Sample Report
Differential pressure level gauge market growth is driven by the growing demand for efficient and accurate level monitoring in complex industrial processes, where safety and operational efficiency are of utmost importance. With the invention of digital pressure sensing technologies and the merger of pressure transmitter market solutions, these gauges now with additional functions, such as remote monitoring, real-time data analysis, and automated process control. Electronic displays, wireless communication, and smart diagnostics are making modern gauges easy to use, and this will accelerate the adoption of these systems in both industries.
Differential pressure-based instruments are in use at more than 68% of industrial facilities (research) in level measurement since these instruments are highly reliable and require very little maintenance. Furthermore, increasing emphasis on process automation and predictive maintenance is fueling substantial differential pressure level gauges market trends since industrial sectors are now increasingly adopting smarter, more robust, and cost-effective solutions for level measurement applications.
In June 2025, Differential pressure level transmitters are increasingly used in oil depots to monitor tank inventories by converting pressure readings into tonnage for precise measurements. Models, such as 1151 and 3051 offer high accuracy and are preferred for their easy installation, low maintenance, and reliable performance. This method ensures more accurate inventory tracking compared to traditional flowmeters.
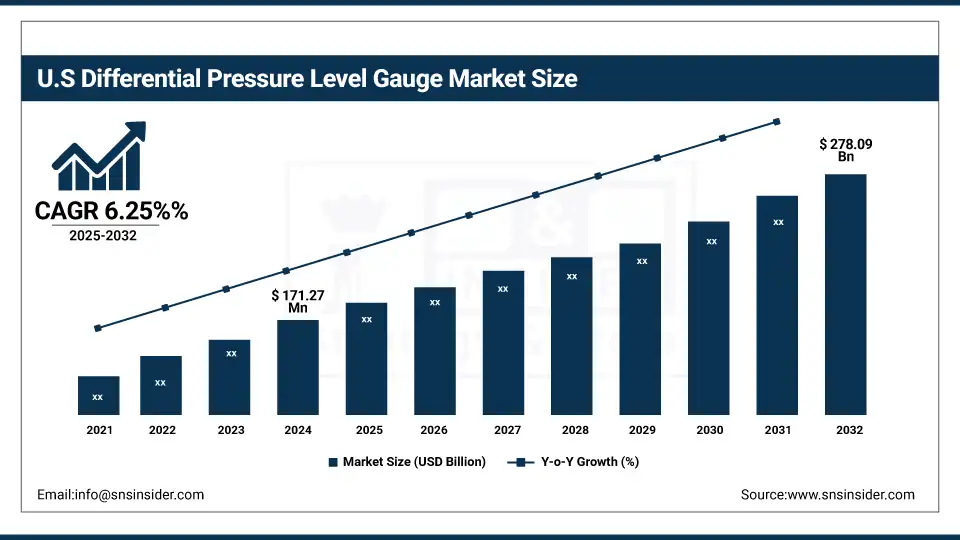
The U.S. leads the North America Differential Pressure Level Gauge Market, valued at USD 171.27 million in 2024 and expected to reach USD 278.09 million by 2032, growing at a 6.25% CAGR. This expansion is extended by increased industrial automation, a solid rise in oil & gas and chemical industries, and legacy system upgrades. Moreover, growing emphasis on operational efficiency and regulatory compliance further propels the market growth.
Differential Pressure Level Gauge Market Dynamics:
Drivers:
-
Industrial Growth Accelerates Demand for Differential Pressure Level Gauges Across Key Sectors
Rapid industrial expansion is a major driver in the differential pressure level gauge market, primarily due to the increasing need for accurate monitoring and control across various industries, further boosting growth in the Differential Pressure Sensor Industry. Differential pressure gauges are equally crucial in the oil & gas sector as they help to monitor fluid levels in storage tanks, pipelines, and separators that reduces chances of a leakage thus ensuring safe operations. Similar to chemical and petrochemical industries these gauges serve to maintain precise pressure conditions during sensitive chemical processes. Pharmaceutical industry widely uses this instrument not only for cleanroom monitoring but also for high purity product manufacturing.
Indoor airflow optimization, energy efficiency, and indoor air quality maintenance are some of the use cases of differential pressure gauges in HVAC systems. These gauges are also feasible for the water and wastewater treatment industry that utilizes them to supervise the filtration systems, reveal obstructions, and flow irregularities. More than 70% of oil & gas and chemical facilities have embedded differential pressure gauges (DPGs) in the heart of their processes to monitor accuracy, safety, and regulatory compliance, according to research.
In June 2025, the U.S. energy firms including Williams Cos, Boardwalk Pipeline, and EQT announced plans to expand natural gas pipelines in Appalachia to meet rising demand. The projects are driven by increasing LNG exports, data center energy needs, and supportive regulatory changes. The U.S. gas production reached 103.2 bcfd, with consumption at 90.5 bcfd in 2024. Revived pipeline projects aim to ease supply bottlenecks in the Northeast region.
Restraints:
-
Legacy System Incompatibility and Complex Upgrades Hinder the Adoption of Advanced Differential Pressure Level Gauges
Integrating differential pressure level gauges into existing systems, particularly older or legacy infrastructures, poses significant challenges. But many industrial plants run with old control systems and equipment that are not compatible with newer, digital, or IoT-ready measures. New systems usually come with upgraded hardware, rewiring, interface changes, and more. In addition, the existing staff might not have the technical capabilities to have advanced gauges in operation or even maintain it, leading to specialized training programs that can take time, time that is normally in short supply and extremely precious to the operations.
This can also lead to difficulties in calibration processes, as new gauges might need to be recalibrated often because of inaccuracy when interfacing with legacy systems. According to the research, 58% of industrial facilities experience problems when upgrading instruments due to system fit and integration issues. Even 46% of the manufacturers state that during such a transition, more downtime occurs, which hampers overall productivity. This causes reluctance among industries, however, small and medium enterprises tend to refrain from complete implementation of advanced differential pressure level gauges because of their price versus long-term benefits.
Differential Pressure Level Gauge Market Segmentation Analysis:
By Product
Mechanical Differential-pressure Gauges segment dominated the market and accounted for 52% of the differential pressure level gauge market share. Due to their low cost, simplicity and very good performance in harsh environments these gauges are widely used in a variety of industries. Mechanical gauges are favored by industries due to their ruggedness, low maintenance, and ability to operate independently without external power sources, making them the best choice for legacy systems, and remote command locations. They are also ideal for mission-critical processes in the oil & gas, chemical, and water treatment sectors, or wherever continuous monitoring is required. Even with the advent of digital, their established technology base and long-standing user familiarity have only continued to provide them with a strong foothold in the market.
Magnetic Differential-pressure Gauges are witnessing the fastest growth in the product segment, driven by their superior performance and adaptability to modern industrial needs. Due to their offer for greater accuracy, improved safety features, and low leakage risks, these gauges are gaining acceptance in applications where precision measurements and high safety standards are critical. The increasing inclination toward automation, digital monitoring, and integration with IoT systems is further propelling the demand for magnetic gauges. The ability to deliver remote readings, advances in materials, and designs are making them highly attractive for industries, such as pharmaceuticals, food & beverage, and advanced manufacturing, contributing to rapid adoption and market expansion.
By Application
Liquid Level Measurement leads the application segment, accounting for a commanding 48% market share in 2024. The market maintains its dominance due to the global need for precise and dependable liquid level measurement in diverse industries, including oil & gas, chemical processing, water treatment, and food & beverage. Even in the high-pressure conditions of tanks and vessels, high accuracy can be measured for liquid columns, so differential pressure gauges are most favored for these applications. Especially in applications requiring continual monitoring to avoid overfilling, leakage, or interruption of operation. This segment continues to be dominated due to its reliability in both hazardous and non-hazardous environments.
Flow Measurement is emerging as the fastest-growing application within the Differential Pressure Level Gauge market. With industries under constant pressure to optimize process flow, reduce energy consumption, and remain compliant with regulations, efficient flow control has become an even higher priority. Industries, such as pharmaceuticals, power generation, and food processing require precise and instantaneous flow data, which is why differential pressure gauges are optimal. High operational efficiency level and requirement for process optimization are responsible for its growth, as it measures the flow of both gases and liquids across complex pipelines and systems. This integration with digital monitoring systems and automation platforms further accelerates their adoption in flow measurement applications.
By End-use Industry
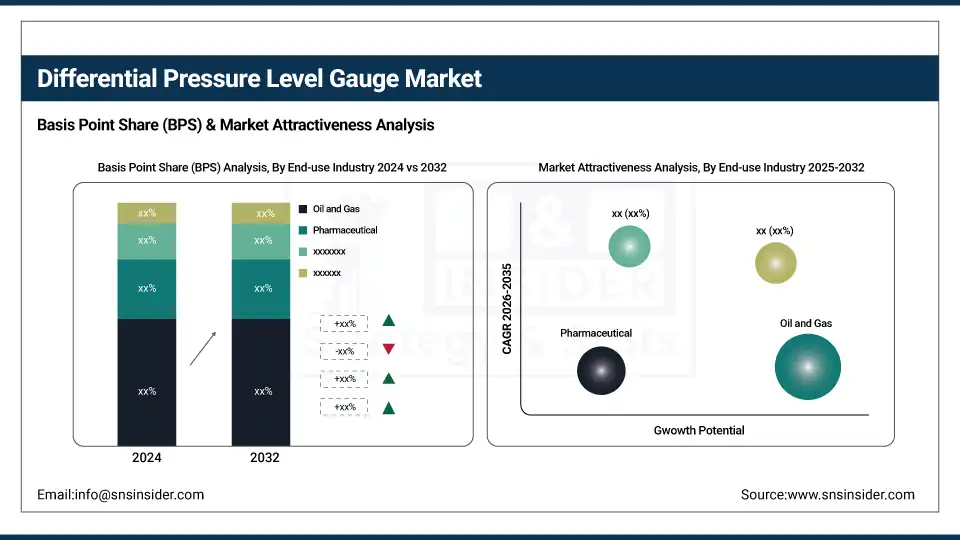
The Oil and Gas sector dominates the end-use industry segment with a 32% market share in 2024. Differential pressure level gauges play a vital role in this sector for measuring liquid levels, controlling flow, and monitoring pressure drops occurring in pipelines and storage facilities. Their strength, durability, and capability to work in extreme pressure and temperature make them well-suited for oil and gas applications and for tough environments. These gauges ensure reliable measurements so that no accidents occur while monitoring regulatory compliance. Their unique utility in upstream, midstream, and downstream operations makes them undeniable market leaders in this sector.
The Power Generation industry is experiencing the fastest growth in adopting Differential Pressure Level Gauges. The increasing need for safety and efficiency processes in conventional and renewable power plants further drives the segment’s growth. Differential pressure gauges are important in the monitoring of boilers, coolant systems, fuel flow measurement, and other applications where accurate and stable measurements of pressure and flow can help with the stability and efficiency of the system. The modernization of industry and the use of technology, which, in this case, incorporates digital monitoring and automation, is further propelling the need for durable, accurate, and reactive pressure gauges over digital systems, hence the rapid increase of the pressure gauge market in this industry.
Differential Pressure Level Gauge Market Regional Outlook:
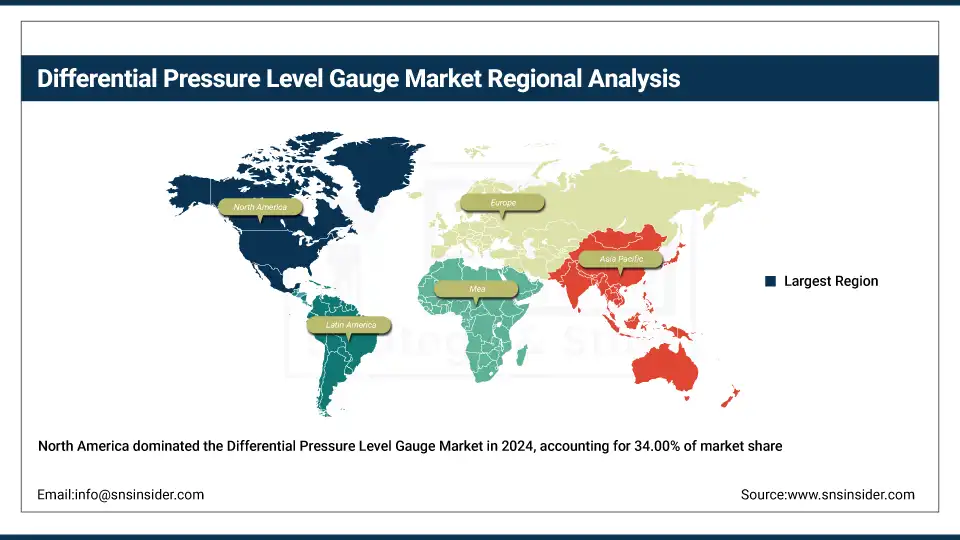
North America emerged as the dominating region in the differential pressure level gauge market, capturing a 34.00% market share in 2024. The market is driven by the dominance of major industries, such as oil & gas, chemicals, water treatment, and power generation, that use differential pressure level gauges for process monitoring and control. In addition, the regional industrial infrastructure along with rigorous regulatory standards for accurate measurement systems, acts as a catalyst for positive growth of the market. Growth in technology, such as digital and smart differential pressure gauges, would ultimately boost the market. North America also continues to dominate the market due to the presence of key manufacturers and high investment in industrial automation.
Get Customized Report as per Your Business Requirement - Enquiry Now
Europe holds a significant share in the differential pressure level gauge market, primarily driven by its well-developed industrial base and increasing focus on process optimization and energy efficiency. All these factors enabled the adoption of advanced measurement technologies in the region, which they gain from the strong manufacturing segment, particularly in the U.K., Germany, and France. Differential pressure level gauges are being used extensively to measure levels of liquids and flow processes in chemical, pharmaceutical, and food & beverage industries across Europe. In addition, strict European Union regulations related to process safety and emissions management stimulate the need for precisely measuring instruments. Market growth is also supported by the regional shift towards industrial automation and the rising proliferation of IoT-enabled devices.
Asia Pacific is the fastest-growing region in the differential pressure level gauge market, driven by rapid industrialization, urbanization, and infrastructure development across countries, such as China, India, Japan, and South Korea. The growing oil & gas, chemicals, power generation, and water treatment sectors are significantly boosting the demand for efficient and reliable level measurement devices. Moreover, the rising investments in process industries and manufacturing, coupled with increasing awareness about process optimization and automation, are propelling market growth. Government initiatives promoting industrial growth, along with expanding exports of industrial goods, further amplify the demand for differential pressure level gauges in this region. The increasing adoption of digital technologies also accelerates market expansion.
China dominates the Differential Pressure Level Gauge Market due to its strong industrial base and rapid adoption of process automation. High demand from industries like oil & gas, chemicals, and power generation drives market growth. Additionally, significant investments in infrastructure and the presence of local manufacturers offering affordable solutions strengthen China’s leading position in the region.
Key Players in the Differential Pressure Level Gauge Market are:
Differential Pressure Level Gauge Companies are Emerson Electric Co., ABB Ltd., Honeywell International Inc., Siemens AG, Yokogawa Electric Corporation, Schneider Electric SE, Endress+Hauser Group, AMETEK, Inc., Fuji Electric Co., Ltd., and WIKA Alexander Wiegand SE & Co. KG.
Recent Developments:
- In March 2025, Emerson launched its Dust Collector Monitoring and Control Solution with real-time monitoring and automated control using Rosemount differential-pressure and ASCO P152 sensors. It reduces air usage, extends filter life, and saves up to USD 18,000 per filter annually, while easily integrating with existing systems.
- In November 2024, ABB launched its new P-Series pressure transmitter portfolio at the China International Import Expo (CIIE). The lineup includes P‑100, P‑300, and P‑500 models offering high accuracy (up to 0.02%), advanced digital features including Bluetooth and Ethernet-APL, and rugged designs with Diaflex and H-Shield technologies.
| Report Attributes | Details |
|---|---|
| Market Size in 2024 | USD 680.74 Million |
| Market Size by 2032 | USD 1127.87 Million |
| CAGR | CAGR of 6.49% From 2025 to 2032 |
| Base Year | 2024 |
| Forecast Period | 2025-2032 |
| Historical Data | 2021-2023 |
| Report Scope & Coverage | Market Size, Segments Analysis, Competitive Landscape, Regional Analysis, DROC & SWOT Analysis, Forecast Outlook |
| Key Segments | • By Product (Mechanical Differential-pressure Gauges, Electronic Differential-pressure Gauges, Magnetic Differential-pressure Gauges) • By Application (Liquid Level Measurement, Flow Measurement, Gas Level Measurement) • By End-use Industry (Oil and Gas, Chemical and Petrochemical, Water and Wastewater Treatment, Pharmaceutical, Food and Beverage, Power Generation) |
| Regional Analysis/Coverage | North America (US, Canada, Mexico), Europe (Germany, France, UK, Italy, Spain, Poland, Turkey, Rest of Europe), Asia Pacific (China, India, Japan, South Korea, Singapore, Australia, Rest of Asia Pacific), Middle East & Africa (UAE, Saudi Arabia, Qatar, South Africa, Rest of Middle East & Africa), Latin America (Brazil, Argentina, Rest of Latin America) |
| Company Profiles | Emerson Electric Co., ABB Ltd., Honeywell International Inc., Siemens AG, Yokogawa Electric Corporation, Schneider Electric SE, Endress+Hauser Group, AMETEK, Inc., Fuji Electric Co., Ltd., WIKA Alexander Wiegand SE & Co. KG. |
Frequently Asked Questions
The North America region dominated the Differential Pressure Level Gauge market in 2024.
The “Mechanical Differential-pressure Gauges” segment dominated the Differential Pressure Level Gauge market.
Industrial Growth Accelerates Demand for Differential Pressure Level Gauges Across Key Sectors
The Differential Pressure Level Gauge market was USD 680.74 million in 2024 and is expected to reach USD 1125.87 million by 2032.
The Differential Pressure Level Gauge market is expected to grow at a CAGR of 6.49% from 2025-2032.
Get in Touch
