Electric Vehicle Fluids Market Report Scope & Overview:
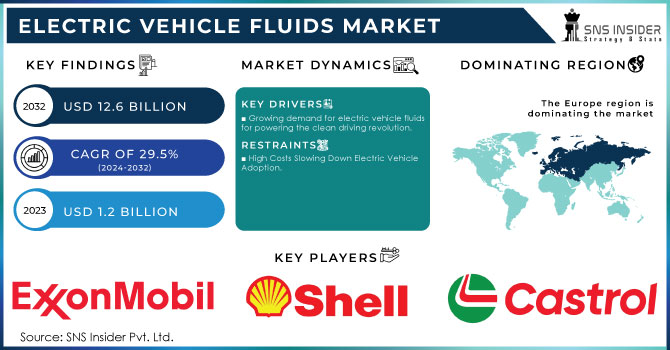
The Electric Vehicle Fluids Market Size was valued at USD 1.55 Billion in 2023 and is expected to reach USD 12.29 Billion by 2032 and grow at a CAGR of 29.5% over the forecast period 2024-2032.
The electric vehicle (EV) is growing the highest in the electric vehicle fluids market. Traditional engine oils and lubricants can wreak havoc on these delicate components, causing corrosion and performance issues. Enter electric vehicle fluids, a specialized breed designed specifically for EVs. EV greases lubricate moving parts within the motor and drivetrain, reducing noise, vibration, and harshness (NVH) for a quieter and more comfortable ride. The skyrocketing production and sales of EVs fuel this increasing demand for EV fluids. The World Economic Forum reports nearly 4.5 million new battery electric vehicles (BEVs) and plug-in hybrids (PHEVs) were sold globally in the first half of 2023 alone. China, a major EV player, further exemplifies this trend. Their New Energy Vehicles (NEVs) production saw a staggering 96.9% year-on-year increase in December 2022. As the EV market continues to accelerate, the demand for these specialized fluids is expected to follow suit, driving significant growth in the electric vehicle fluids market.
Get E-PDF Sample Report on Electric Vehicle Fluids Market - Request Sample Report
Moreover, the new generation of fluids is known for superior thermal stability, which means that batteries do not overheat, and their operational life is extended, thereby preserving the vehicle’s performance. Shell E-Fluids were introduced in 2021 and are also particularly relevant to the question of battery cooling and higher efficiency. Both innovations demonstrate the industry’s shift to fluids that contribute not only to controlling battery temperature but also to the overall performance and sustainability of the vehicle, which corresponds to an increasing demand for high-mobility electric vehicles. Electric vehicles need a range of fluids that can withstand electrical and thermal loads, cool the system efficiently, be long-lasting, and ensure performance. Thus, the TotalEnergies Quartz EV Fluid series introduced in 2022 includes e-transmission fluids and greases that are of a new generation developed particularly for EVs. Such properties as improved dielectrics and better thermal management solutions allow reducing energy losses and efficient cooling of the system.
Electric Vehicle Fluids Market Growth Drivers:
-
Growing demand for electric vehicle fluids for powering the clean driving revolution.
Environmental concerns are revving up the electric vehicle (EV) market. Stricter emission standards are pushing car companies to ditch gas guzzlers and embrace cleaner technologies. Hybrids and full EVs are no longer oddities, but the future of transportation. This growth translates to a surge in demand for EV fluids, the lifeblood of these vehicles. Just like fluids in traditional cars, EV fluids play a critical role. They keep the electric motor cool, which is crucial for efficiency. A cool motor translates to a longer range and a reduced environmental footprint. California's zero-emission vehicle (ZEV) program exemplifies this push for clean transportation. By keeping the motor from overheating, these fluids extend the lifespan of the entire EV, adding another layer of sustainability. In 2023, ExxonMobil launched its Mobil EV Therm™ series, designed to ensure efficient thermal management while supporting the sustainability goals of EV manufacturers. These innovations play a vital role in managing motor temperatures and extending the overall lifespan of electric vehicles, contributing to the larger global effort toward zero-emission
Electric Vehicle Fluids Market Restraints:
-
High Costs Slowing Down Electric Vehicle Adoption.
The high cost of entry is a major hurdle for electric vehicles (EVs) competing with traditional gas-powered cars. Unlike their familiar counterparts, EVs currently carry a hefty price tag. This can be a significant barrier for potential buyers, slowing down widespread adoption. The established gasoline vehicles and EVs haven't reached production volumes that benefit from economies of scale. As production ramps up, from say 10,000 to 500,000 units annually, manufacturing costs typically decrease. This trend could eventually bring down the sticker price of EVs. Plug-in hybrid electric vehicles present an even steeper initial cost climb. They combine a battery pack with both a conventional gasoline engine and an electric motor. While PHEVs offer the flexibility of switching between electric and gasoline power, this complexity adds to the production cost. PHEVs do offer some potential savings through a "downsized" gasoline engine, which can partially offset the battery cost.
Electric Vehicle Fluids Market Opportunities:
-
Stringent by the government for Building the Electric Vehicle Charging Network of the Future.
The fight against climate change has put a target on the back of gas-powered vehicles, with their carbon emissions a major concern. The governments are joining forces with private companies to build a network of EV charging stations, paving the way for a sustainable transportation future. This collaborative effort has seen the construction of over 200,000 charging stations across the globe in recent years. As electric vehicles gain traction, readily available and affordable public charging options will be crucial. Governments are playing a key role in fueling this infrastructure build-out through various support measures. This includes direct investment in installing public charging stations, making them more accessible to EV owners. Additionally, they offer incentives for individuals to set up charging points at home, promoting a convenient charging ecosystem. Looking ahead, some regions are taking even bolder steps.
Electric Vehicle Fluids Market Segment Analysis
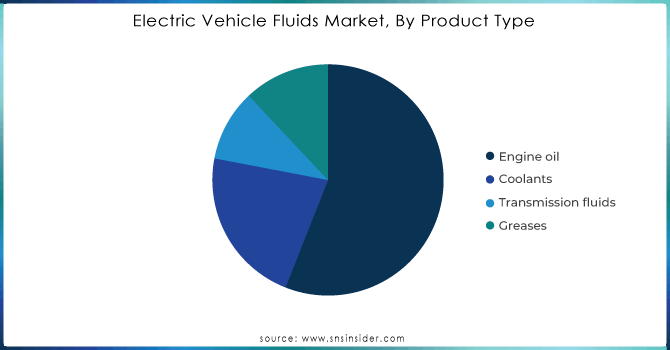
By Product Type
Engine oil held the largest market share around 56% in 2023. This is because engine oil is essential for the efficiency and longevity of electric drivetrains. Although electric vehicles do not contain traditional internal combustion engines, they are equipped with electric motors, bearings, etc. These parts require specially formulated engine oils to both lubricate and dissipate heat. Engine oils for EVs are more thermally stable, lubricate better to reduce friction, and increase efficiency to provide longer range and better performance. The rising production of EVs has also shifted the market toward engine oils, as hybrid vehicles are still equipped with an internal combustion element also requiring such specifications.
Get Customized Report as Per Your Business Requirement - Request For Customized Report
By Vehicle Type
On-highway electric vehicles held the largest market share around 68% in 2023. On-highway electric vehicles lead the market in the electric vehicle (EV) fluids sector due to the rapid adoption of electric cars, buses, and commercial vehicles for personal and public transportation. The global push for sustainable transportation, stricter emission regulations, and government incentives have accelerated the production and sales of on-highway EVs, particularly in regions like North America, Europe, and Asia-Pacific. These vehicles operate in urban and long-distance settings, requiring specialized fluids, such as coolants, transmission fluids, and greases, to maintain optimal performance, efficiency, and thermal management over extended use. Additionally, the rise in EV infrastructure, such as charging stations and advanced battery technologies, supports the mass adoption of on-highway EVs. In contrast, off-highway electric vehicles, such as those used in agriculture and construction, represent a smaller but growing niche, driven mainly by industrial applications. The larger consumer base and frequent use of on-highway EVs make them the dominant segment in the market.
By Propulsion Type
The hybrid electric vehicles sub-segment is currently dominate the electric vehicle (EV) market in 2023 by Propulsion, and battery electric vehicles (BEVs) are poised for a surge. Unlike hybrids, BEVs ditch the gas engine entirely, eliminating the need for fuel and regular maintenance. They do require some EV fluids, but less than hybrids. As BEV production ramps up and surpasses hybrid production, the overall demand for EV fluids is expected to rise during the forecast period. This is driven by the sheer volume of BEVs on the road. Advancements in battery technology are bringing down battery prices, making BEVs more affordable, and accelerating their adoption. So, while BEVs use less fluid per vehicle, the growth in their numbers will likely outpace the decline in fluid use per car.
By Fill Type
First fill dominates the electric vehicle fluids market due to its crucial role during the initial manufacturing and assembly of electric vehicles. This filling type refers to the fluids added when a new EV is produced, such as engine oils, coolants, and transmission fluids, which are essential for the vehicle’s optimal performance from the moment it leaves the factory. The high production rate of new EVs, driven by increasing consumer demand and government mandates for cleaner vehicles, has significantly boosted the demand for first-fill fluids. Automakers focus on ensuring that the EVs are equipped with high-performance fluids right from the start to enhance efficiency, thermal management, and component longevity.
Electric Vehicle Fluids Market Regional Analysis:
North America Electric Vehicle Fluids Market Insights
The North American EV fluids market is witnessing steady growth, supported by increasing EV adoption in the U.S. and Canada. Strong government incentives, expanding charging networks, and growing environmental awareness are key growth drivers. Leading automakers and fluid manufacturers are collaborating to develop high-performance EV fluids suitable for North American vehicle models. The region focuses on enhancing battery efficiency and vehicle longevity, which, in turn, drives demand for advanced EV fluids across passenger and commercial EV segments.
U.S. Electric Vehicle Fluids Market
The U.S. electric vehicle (EV) fluids market is witnessing significant growth as EV adoption accelerates across passenger, commercial, and fleet segments. Government incentives, tax credits, and expanding EV charging infrastructure are key drivers supporting market expansion. Leading automakers, including Tesla, Ford, and General Motors, are producing a growing range of electric and hybrid vehicles, increasing demand for high-performance EV fluids. Collaborations between fluid manufacturers and automotive companies focus on optimizing battery efficiency, thermal management, and overall vehicle longevity.
Asia-Pacific Electric Vehicle Fluids Market
The APAC region is poised to become the fastest-growing EV fluids market by 2031, fueled by rising EV adoption in China, Japan, and South Korea. China, being the largest EV market globally, drives significant demand for specialized fluids, accounting for a major share of global EV sales. Leading automakers like BYD, NIO, and Geely are investing in electric mobility and partnering with fluid manufacturers to improve vehicle performance. Expanding EV infrastructure, government incentives, and increasing consumer adoption contribute to rapid growth, making APAC a critical hub for future EV fluids demand.
Latin America & MEA Electric Vehicle Fluids Market
Latin America and the Middle East & Africa (MEA) are emerging markets for EV fluids, with growth driven by government policies promoting electric mobility and environmental sustainability. Countries like Brazil, Mexico, UAE, and South Africa are gradually investing in EV infrastructure, increasing the need for specialized fluids. Market growth is supported by collaborations between local automakers and international fluid manufacturers to develop region-specific solutions. Rising awareness of eco-friendly transportation and incentives for EV adoption are expected to drive steady demand for EV fluids across these regions in the coming years.
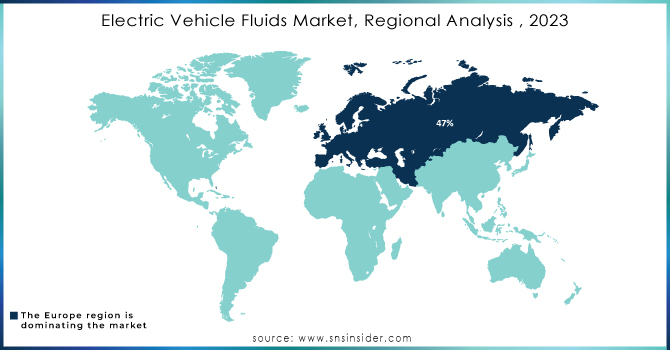
Europe Electric Vehicle Fluids Market
Europe region has dominated the electric vehicle (EV) fluids market in 2024, holding a commanding 47% share by value. This dominance can be attributed to two key factors: a prevalence of high-priced hybrid vehicles and expensive engine oil used in them. Hybrids, unlike battery EVs, require more EV fluids, further contributing to Europe's market lead. The Asia Pacific (APAC) region is expected to steal the spotlight by 2031, emerging as the fastest-growing market. This growth is fueled by the anticipated surge in EV demand across the region. As the number of EVs on the road increases, so too will the need for servicing and consequently, EV fluids. Countries like China, Japan, and South Korea are leading in EV production and infrastructure, with China emerging as the largest EV market globally. In 2022, China accounted for nearly 60% of global EV sales, fueling the demand for specialized EV fluids. Key players in the region, such as BYD, NIO, and Geely, are heavily investing in electric mobility and collaborating with fluid manufacturers to optimize their vehicles’ performance.
Key Players:
-
ExxonMobil (Mobil EV Therm™, Mobil EV Drive™)
-
Shell (Shell E-Transmission Fluid, Shell E-Fluids)
-
TotalEnergies SE (Quartz EV Fluid, Total Rubia EV Fluid)
-
Castrol (Castrol ON EV Thermal Fluid, Castrol ON EV Transmission Fluid)
-
FUCHS Petrolub (FUCHS RENOLIN E-Fluids, FUCHS TITAN EV Gear Fluid)
-
Valvoline (Valvoline EV Coolant, Valvoline EV Transmission Fluid)
-
Petronas Lubricants (PETRONAS Iona Transmission Fluid, PETRONAS Iona Coolant)
-
Afton Chemical (HiTEC® E-Transmission Fluid, HiTEC® EV Lubricants)
-
Motul (Motul Inugel EV Coolant, Motul Gear EV Transmission Fluid)
-
Panolin (Panolin E-Fluid, Panolin E-Coolant)
-
BP (British Petroleum) (BP E-Lubricant, BP EV Coolant)
-
Chevron Corporation (Chevron EV Fluid, Chevron E-Coolant)
-
Red Line Oil (Red Line EV Gear Oil, Red Line EV Transmission Fluid)
-
Klüber Lubrication (Klüberoil 4 UH1-15, Klübersynth GH 6-220)
-
Idemitsu Kosan (Idemitsu EV Coolant, Idemitsu EV Transmission Fluid)
-
Millers Oils (Millers EV Gear Fluid, Millers EV Coolant)
-
Repsol S.A. (Spain)
-
ENEOS Corporation
-
Saudi Arabian Oil Co.
RECENT DEVELOPMENTS
Shell, Royal Dutch Shell, founded in 1907 and headquartered in The Hague, Netherlands, is a global energy and petrochemicals company. It operates in oil, gas, and renewable energy sectors, focusing on sustainable solutions and large-scale energy infrastructure projects worldwide.
-
In May 2024: Shell is selling its Singapore Energy and Chemicals Park to CAPGC, a joint venture between Chandra Asri Capital and Glencore Asian Holdings. This deal transfers full ownership of the park, including all physical assets and commercial contracts, from Shell to CAPGC.
ExxonMobil, founded in 1999 and headquartered in Irving, Texas, USA, is a leading multinational oil and gas corporation. It engages in exploration, production, refining, and chemical manufacturing, while investing in emerging energy technologies such as lithium and low-carbon solutions.
-
In November 2023: Exxon Mobil (XOM) company has begun work on its first North American lithium production facility in southwest Arkansas, a region known for its lithium reserves. Their lithium offering will be branded as Mobil™ Lithium, leveraging their long history of collaboration with the automotive industry.
| Report Attributes | Details |
|---|---|
| Market Size in 2024 | USD 1.55 Billion |
| Market Size by 2032 | USD 12.29 Billion |
| CAGR | CAGR of 29.5% From 2025 to 2032 |
| Base Year | 2024 |
| Forecast Period | 2025-2032 |
| Historical Data | 2021-2023 |
| Report Scope & Coverage | Market Size, Segments Analysis, Competitive Landscape, Regional Analysis, DROC & SWOT Analysis, Forecast Outlook |
| Key Segments | • By Product Type (Engine oil, Coolants, Transmission fluids, Greases) • By Vehicle Type (On-highway Electric Vehicles, Off-highway Electric Vehicles) • By Propulsion Type (Battery electric vehicles, Hybrid electric vehicles) • By Fill Type (First fill, Service fill) |
| Regional Analysis/Coverage |
North America (US, Canada), Europe (Germany, France, UK, Italy, Spain, Poland, Russsia, Rest of Europe), Asia Pacific (China, India, Japan, South Korea, Australia, ASEAN Countries, Rest of Asia Pacific), Middle East & Africa (UAE, Saudi Arabia, Qatar, Egypt, South Africa, Rest of Middle East & Africa), Latin America (Brazil, Argentina, Mexico, Colombia Rest of Latin America) |
| Company Profiles | Royal Dutch Shell plc (Netherlands), PTT (Thailand), Exxon Mobil Corporation (US), Valvoline Inc. (US), BP plc. (UK), TotalEnergies SE (France), Repsol S.A. (Spain), FUCHS Petrolub AG (Germany), Petronas (Malaysia), ENEOS Corporation (Japan), Saudi Arabian Oil Co., Royal Dutch Shell plc (Netherlands) |
Frequently Asked Questions
Ans: Europe is expected to hold the largest market share in the global Electric Vehicle Fluids Market during the forecast period.
Ans: Battery electric vehicles (BEVs) has less fluid per vehicle compared to hybrids, the sheer number of BEVs on the road is expected to outweigh this decline in fluid usage per car.
Ans: Rising electric vehicle (EV) adoption and the need for specialized fluids to keep them running smoothly.
Ans: Electric Vehicle Fluids Market size was USD 1.55 billion in 2024 and is expected to Reach USD 12.29 billion by 2032.
Ans: The Electric Vehicle Fluids Market is expected to grow at a CAGR of 29.5%.
Get in Touch
