image

Wire & Cable Compounds Market Report Scope & Overview:
Wire & Cable Compounds Market ,Revenue Analysis

Get More Information on Wire & Cable Compounds Market - Request Sample Report

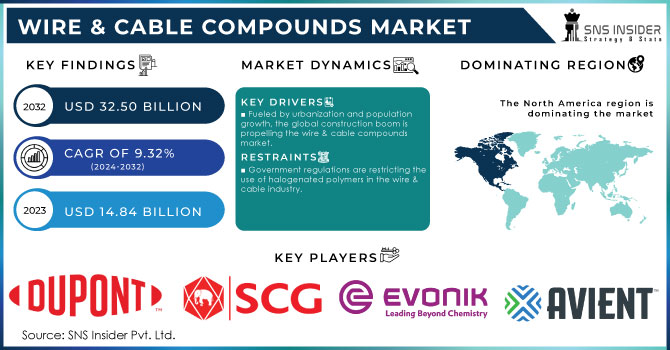
The Wire & Cable Compounds Market Size was valued at USD 14.84 billion in 2023, and is expected to reach USD 32.50 billion by 2032 and grow at a CAGR of 9.32% over the forecast period 2024-2032.

The rising demand for wire and cable compounds is largely driven by their critical role in the power sector. Extensive use in power transmission applications makes them a vital cog in the infrastructure machine. Wire and cable compounds provide superior insulation, preventing electrical current leakage and ensuring safe, efficient power transmission. They act as a protective sheath, shielding cables from physical damage, harsh chemicals, and corrosion. This translates to longer cable lifespans and more reliable power. These compounds boast impressive mechanical strength, elasticity, and abrasion resistance. This allows cables to withstand the demands of installation and operation in challenging environments. This winning combination has fueled the widespread adoption of wire and cable compounds in the power sector. 

In 2021, the IIJA was signed by the U.S. government, which designates USD 65 billion for power infrastructure projects such as grid modernization and the extension of transmission lines. This investment will probably increase the demand for wire and cable compounds that guarantee the dependability and effectiveness of the power transmission system.

Furthermore, the global transition towards renewable energy sources, such as solar and wind, drives significant demand for specialized wire and cable compounds. These renewable energy projects often operate in harsh and challenging environments, where standard cables may not suffice. For instance, solar panels are exposed to intense sunlight, extreme temperatures, and UV radiation, while wind turbines are subjected to constant mechanical stress, fluctuating temperatures, and exposure to moisture and salt in offshore installations

The rising adoption of electric vehicles is driving demand for specialized wire and cable compounds that can handle high voltage and ensure safety and efficiency in EVs.

MARKET DYNAMICS

Drivers

Fueled by urbanization and population growth, the global construction boom is propelling the wire & cable compounds market.

Growing construction, driven by rapid urbanization and population growth, is a boon for the wire & cable compounds market. As cities sprawl and populations surge, the need for new infrastructure, homes, and commercial spaces explodes. This translates to a massive demand for wires, cables, and the compounds that make them reliable and cost-effective. While COVID-19 caused a temporary setback, the construction industry is expected to pick up steam, propelling the wire & cable compounds market forward, particularly in Asia Pacific where the use of these compounds in construction is growing rapidly.

China's continued focus on urbanization is resulting in the building of new cities and the growth of already established ones. The government's goal of relocating 250 million people to new urban areas by 2025 has led to significant investments in construction, with the NDRC estimating infrastructure expenditure to exceed USD1000 Billion per year.

Restrain

Government regulations are restricting the use of halogenated polymers in the wire & cable industry.

The widespread use of halogenated polymers in wire & cable compounds is facing a growing challenge: government regulations. A prime example is the European Union's Construction Products Regulation. This legislation acts as a watchdog, ensuring the reliability and safety of building materials sold within the European Economic Area (EEA). The CPR achieves this by setting strict standards and uniform testing methods for various construction materials, including wire & cable compounds. These tests go beyond basic functionality and delve deep into fire safety performance. These stringent regulations have significantly impacted the demand for halogenated compounds in the EU's wire & cable industry. Halogenated materials often perform poorly in some of these fire safety tests. Consequently, the EU construction sector has been directed to prioritize non-halogenated wires and cables. This shift has led to a stagnation in the market for halogenated polymers within the European region.

Market segmentation

By Type

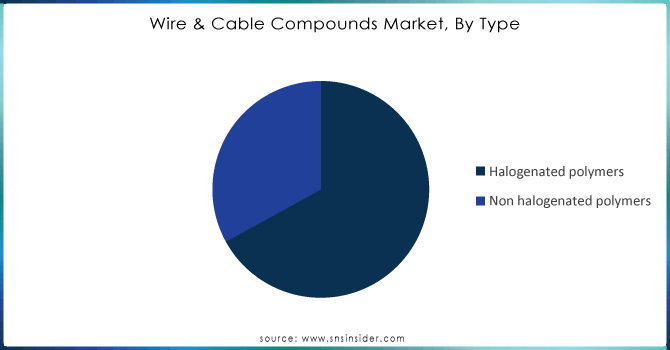
The halogenated polymers, by type segment, are leading the wire and cable compound market and held a share of around 63.45% in 2023. the ever-reliable PVC. PVC's reign isn't solely based on tradition it's a true industry workhorse. This versatile material finds applications across various sectors like footwear, plastics, and packaging, but in the wire & cable world, its dominance is undeniable. PVC holds the prestigious title of the world's third-highest-produced synthetic plastic polymer, trailing only polyethylene and polypropylene. Projections suggest PVC will continue to be king, claiming the lion's share of the wire & cable compounds market. However, PVC isn't without its partner. Chlorinated polyethylene (CPE) enters the scene, offering a helping hand. This unique material is essentially polyethylene with a twist it boasts a chlorine content of around 30-40%. This twist allows CPE to act as a modifier for PVC, fine-tuning its properties for specific applications within the wire & cable industry.
Wire--Cable-Compounds-Market-By-Type

Get Customized Report as per your Business Requirement - Request For Customized Report

By End-Use Industry

In the power segment held the largest market share around 38.63% in 2023. The power industry is a critical infrastructure sector that requires a vast and reliable network for electricity generation, transmission, and distribution. With the global push for energy security, grid modernization, and the integration of renewable energy sources, the power sector has seen significant investments in upgrading and expanding its infrastructure. Wire and cable compounds play a vital role in this sector by providing the necessary insulation, durability, and safety features required for high-voltage power transmission.

Moreover, as countries worldwide focus on reducing energy losses and enhancing grid efficiency, the demand for advanced wire and cable compounds has surged. These materials are essential for ensuring the long-term reliability and safety of power systems, especially as the industry shifts towards more sustainable energy sources such as solar and wind.

REGIONAL ANALYSIS

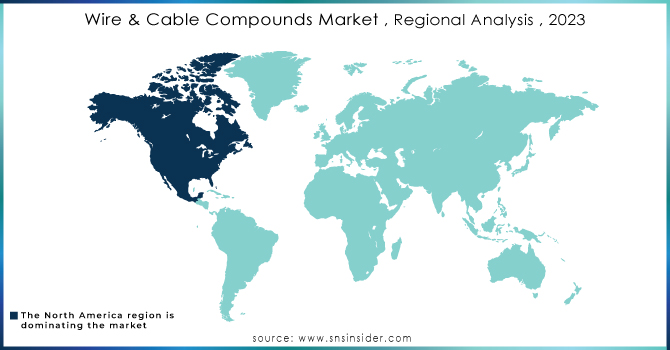
North America region dominates in the wire & cable compounds market, holding the largest market share in 2023. This dominance can be attributed to the well-developed industrial base, and the market for wire & cable compounds thrives alongside domestic industrial growth. Specific sectors within North America are experiencing particularly explosive growth. The communication industry is a prime example. Fueled by continuous technological advancements and significant investments in communication infrastructure, this sector is driving a surge in demand for wire & cable compounds. Governments are actively investing in renewable energy solutions like solar and wind power plants. This focus on clean energy translates to a growing need for wires and cables, and consequently, an increased demand for the compounds used in their production. As these clean energy initiatives gain momentum, the market for wire & cable compounds in the power sector is poised to follow suit.
Wire--Cable-Compounds-Market--Regional-Analysis--2023

Key Players

Some of the major players in the Wire & Cable Compounds Market are DuPont de Nemours, Inc. (US), Siam Cement Public Company Limited (Thailand), Evonik Industries AG (Germany), Avient Corporation (US), Exxon Mobil Corporation (US), Trelleborg AB (Sweden), Mitsubishi Chemical Corporation (Japan), Solvay S.A. (Belgium), Borouge (UAE), Eastman Chemical Company (US), Hanwha Solutions Corporation (South Korea), Trelleborg, and other players.

RECENT DEVELOPMENTS

  • In May 2024: DuPont announced plans to split into three independent publicly traded companies. This move separates its Electronics and Water businesses, allowing them more focus and agility, while New DuPont will remain a diversified industrial leader. All three companies are expected to boast strong financials and promising growth prospects.

  • In June 2024: TEGO® Guard 9000, a revolutionary technology for exterior wall paints, has bagged the prestigious Ringier Technology Innovation Award in the Coating Industry category. This award, established in 2006, recognizes groundbreaking advancements in the coatings industry, and TEGO® Guard 9000's impressive quick-set property clearly impressed the judges.

Wire & Cable Compounds Market Report Scope:

Report Attributes Details
Market Size in 2023 US$ 14.84 Billion
Market Size by 2032 US$ 32.50 Billion
CAGR CAGR of 9.32% From 2024 to 2032
Base Year 2023
Forecast Period 2024-2032
Historical Data 2020-2022
Report Scope & Coverage Market Size, Segments Analysis, Competitive  Landscape, Regional Analysis, DROC & SWOT Analysis, Forecast Outlook
Key Segments • By Type (Halogenated Polymers, Non- Halogenated Polymers)
• By end-use industry (Construction Wind Energy, Power, Communication, Automotive, Others)
Regional Analysis/Coverage North America (USA, Canada, Mexico), Europe
(Germany, UK, France, Italy, Spain, Netherlands,
Rest of Europe), Asia-Pacific (Japan, South Korea,
China, India, Australia, Rest of Asia-Pacific), The
Middle East & Africa (Israel, UAE, South Africa,
Rest of Middle East & Africa), Latin America (Brazil, Argentina, Rest of Latin America)
Company Profiles Hanwha Solutions Corporation (South Korea), DuPont de Nemours Inc. (US), Evonik Industries AG (Germany), Siam Cement Public Company Limited (Thailand), Borouge (UAE) Avient Corporation (US), Eastman Chemical Company (US), Solvay S.A. (Belgium), Mitsubishi Chemical Corporation (Japan), Trelleborg AB (Sweden), Exxon Mobil Corporation (US)
DRIVERS • Fueled by urbanization and population growth, the global construction boom is propelling the wire& cable       comapunds market. 
 
Restraints • Government rules are restricting the use of halogenated polymers in the wire & cable industry. 

Frequently Asked Questions

Ans: Manufacturers, Consultant, aftermarket players, association, Research institute, private and universities libraries, suppliers and distributors of the product.

Ans: Hanwha Solutions Corporation (South Korea), DuPont de Nemours Inc. (US), Evonik Industries AG (Germany), Siam Cement Public Company Limited (Thailand), Borouge (UAE) Avient Corporation (US), Eastman Chemical Company (US), Solvay S.A. (Belgium), Mitsubishi Chemical Corporation (Japan), Trelleborg AB (Sweden) and Exxon Mobil Corporation (US).

Ans: Electric cars are becoming more popular and Rising Demand from Emerging Markets are the opportunity for Wire & Cable Compounds Market.

Ans: The construction industry is growing the most in all areas, Government and private spending on developing renewable energy sources has gone up and More people want cars that are lighter and use less gas are the drivers for antimicrobial plastics market.

Ans: The Wire & Cable Compounds Market is expected to grow at a CAGR of 9.32%.

Table of Content

1. Introduction

1.1 Market Definition

1.2 Scope (Inclusion and Exclusions)

1.3 Research Assumptions

2. Executive Summary

2.1 Market Overview

2.2 Regional Synopsis

2.3 Competitive Summary

3. Research Methodology

3.1 Top-Down Approach

3.2 Bottom-up Approach

3.3. Data Validation

3.4 Primary Interviews

4. Market Dynamics Impact Analysis

4.1 Market Driving Factors Analysis

4.1.2 Drivers

4.1.2 Restraints

4.1.3 Opportunities

4.1.4 Challenges

4.2 PESTLE Analysis

4.3 Porter’s Five Forces Model

5. Statistical Insights and Trends Reporting

5.1 Production Capacity and Utilization, by Country, by Type, 2023

5.2 Feedstock Prices, by Country, by Type, 2023

5.3   Regulatory Impact, by l Country, by Type, 2023.

5.4 Environmental Metrics: Emissions Data, Waste Management Practices, and     Sustainability Initiatives, by Region

5.5 Innovation and R&D, by Type, 2023

6. Competitive Landscape

6.1 List of Major Companies, By Region

6.2 Market Share Analysis, By Region

6.3 Product Benchmarking

6.3.1 Product specifications and features

6.3.2 Pricing

6.4 Strategic Initiatives

6.4.1 Marketing and promotional activities

6.4.2 Distribution and supply chain strategies

6.4.3 Expansion plans and new Type launches

6.4.4 Strategic partnerships and collaborations

6.5 Technological Advancements

6.6 Market Positioning and Branding

7. Wire & Cable Compounds Market Segmentation, by Type

7.1 Chapter Overview

7.2 Halogenated Polymers

7.2.1 Halogenated Polymers Market Trends Analysis (2020-2032)

7.2.2 Halogenated Polymers Market Size Estimates and Forecasts to 2032 (USD Billion)

7.3 Non-Halogenated Polymers

7.3.1 Non-Halogenated Polymers Market Trends Analysis (2020-2032)

7.3.2 Non-Halogenated Polymers Market Size Estimates and Forecasts to 2032 (USD Billion)

8. Wire & Cable Compounds Market Segmentation, by End-Use Industry

8.1 Chapter Overview

8.2 Construction

8.2.1 Construction Market Trends Analysis (2020-2032)

8.2.2 Construction Market Size Estimates and Forecasts to 2032 (USD Billion)

8.3 Wind Energy

8.3.1 Wind Energy Market Trends Analysis (2020-2032)

8.3.2 Wind Energy Market Size Estimates and Forecasts to 2032 (USD Billion)

8.4 Power

8.4.1 Power Market Trends Analysis (2020-2032)

8.4.2 Power Market Size Estimates and Forecasts to 2032 (USD Billion)

8.5 Communication

8.5.1 Communication Market Trends Analysis (2020-2032)

8.5.2 Communication Market Size Estimates and Forecasts to 2032 (USD Billion)

8.6 Automotive

8.6.1 Automotive Market Trends Analysis (2020-2032)

8.6.2 Automotive Market Size Estimates and Forecasts to 2032 (USD Billion)

8.7 Others

8.7.1 Others Market Trends Analysis (2020-2032)

8.7.2 Others Market Size Estimates and Forecasts to 2032 (USD Billion)

9. Regional Analysis

9.1 Chapter Overview

9.2 North America

9.2.1 Trends Analysis

9.2.2 North America Wire & Cable Compounds Market Estimates and Forecasts, by Country (2020-2032) (USD Billion)

9.2.3 North America Wire & Cable Compounds Market Estimates and Forecasts, by Type (2020-2032) (USD Billion) 

9.2.4 North America Wire & Cable Compounds Market Estimates and Forecasts, by End-Use Industry (2020-2032) (USD Billion)

9.2.5 USA

9.2.5.1 USA Wire & Cable Compounds Market Estimates and Forecasts, by Type (2020-2032) (USD Billion)

9.2.5.2 USA Wire & Cable Compounds Market Estimates and Forecasts, by End-Use Industry (2020-2032) (USD Billion)

9.2.6 Canada

9.2.6.1 Canada Wire & Cable Compounds Market Estimates and Forecasts, by Type (2020-2032) (USD Billion)

9.2.6.2 Canada Wire & Cable Compounds Market Estimates and Forecasts, by End-Use Industry (2020-2032) (USD Billion)

9.2.7 Mexico

9.2.7.1 Mexico Wire & Cable Compounds Market Estimates and Forecasts, by Type (2020-2032) (USD Billion)

9.2.7.2 Mexico Wire & Cable Compounds Market Estimates and Forecasts, by End-Use Industry (2020-2032) (USD Billion)

9.3 Europe

9.3.1 Eastern Europe

9.3.1.1 Trends Analysis

9.3.1.2 Eastern Europe Wire & Cable Compounds Market Estimates and Forecasts, by Country (2020-2032) (USD Billion)

9.3.1.3 Eastern Europe Wire & Cable Compounds Market Estimates and Forecasts, by Type (2020-2032) (USD Billion) 

9.3.1.4 Eastern Europe Wire & Cable Compounds Market Estimates and Forecasts, by End-Use Industry (2020-2032) (USD Billion)

9.3.1.5 Poland

9.3.1.5.1 Poland Wire & Cable Compounds Market Estimates and Forecasts, by Type (2020-2032) (USD Billion)

9.3.1.5.2 Poland Wire & Cable Compounds Market Estimates and Forecasts, by End-Use Industry (2020-2032) (USD Billion)

9.3.1.6 Romania

9.3.1.6.1 Romania Wire & Cable Compounds Market Estimates and Forecasts, by Type (2020-2032) (USD Billion)

9.3.1.6.2 Romania Wire & Cable Compounds Market Estimates and Forecasts, by End-Use Industry (2020-2032) (USD Billion)

9.3.1.7 Hungary

9.3.1.7.1 Hungary Wire & Cable Compounds Market Estimates and Forecasts, by Type (2020-2032) (USD Billion)

9.3.1.7.2 Hungary Wire & Cable Compounds Market Estimates and Forecasts, by End-Use Industry (2020-2032) (USD Billion)

9.3.1.8 Turkey

9.3.1.8.1 Turkey Wire & Cable Compounds Market Estimates and Forecasts, by Type (2020-2032) (USD Billion)

9.3.1.8.2 Turkey Wire & Cable Compounds Market Estimates and Forecasts, by End-Use Industry (2020-2032) (USD Billion)

9.3.1.9 Rest of Eastern Europe

9.3.1.9.1 Rest of Eastern Europe Wire & Cable Compounds Market Estimates and Forecasts, by Type (2020-2032) (USD Billion)

9.3.1.9.2 Rest of Eastern Europe Wire & Cable Compounds Market Estimates and Forecasts, by End-Use Industry (2020-2032) (USD Billion)

9.3.2 Western Europe

9.3.2.1 Trends Analysis

9.3.2.2 Western Europe Wire & Cable Compounds Market Estimates and Forecasts, by Country (2020-2032) (USD Billion)

9.3.2.3 Western Europe Wire & Cable Compounds Market Estimates and Forecasts, by Type (2020-2032) (USD Billion) 

9.3.2.4 Western Europe Wire & Cable Compounds Market Estimates and Forecasts, by End-Use Industry (2020-2032) (USD Billion)

9.3.2.5 Germany

9.3.2.5.1 Germany Wire & Cable Compounds Market Estimates and Forecasts, by Type (2020-2032) (USD Billion)

9.3.2.5.2 Germany Wire & Cable Compounds Market Estimates and Forecasts, by End-Use Industry (2020-2032) (USD Billion)

9.3.2.6 France

9.3.2.6.1 France Wire & Cable Compounds Market Estimates and Forecasts, by Type (2020-2032) (USD Billion)

9.3.2.6.2 France Wire & Cable Compounds Market Estimates and Forecasts, by End-Use Industry (2020-2032) (USD Billion)

9.3.2.7 UK

9.3.2.7.1 UK Wire & Cable Compounds Market Estimates and Forecasts, by Type (2020-2032) (USD Billion)

9.3.2.7.2 UK Wire & Cable Compounds Market Estimates and Forecasts, by End-Use Industry (2020-2032) (USD Billion)

9.3.2.8 Italy

9.3.2.8.1 Italy Wire & Cable Compounds Market Estimates and Forecasts, by Type (2020-2032) (USD Billion)

9.3.2.8.2 Italy Wire & Cable Compounds Market Estimates and Forecasts, by End-Use Industry (2020-2032) (USD Billion)

9.3.2.9 Spain

9.3.2.9.1 Spain Wire & Cable Compounds Market Estimates and Forecasts, by Type (2020-2032) (USD Billion)

9.3.2.9.2 Spain Wire & Cable Compounds Market Estimates and Forecasts, by End-Use Industry (2020-2032) (USD Billion)

9.3.2.10 Netherlands

9.3.2.10.1 Netherlands Wire & Cable Compounds Market Estimates and Forecasts, by Type (2020-2032) (USD Billion)

9.3.2.10.2 Netherlands Wire & Cable Compounds Market Estimates and Forecasts, by End-Use Industry (2020-2032) (USD Billion)

9.3.2.11 Switzerland

9.3.2.11.1 Switzerland Wire & Cable Compounds Market Estimates and Forecasts, by Type (2020-2032) (USD Billion)

9.3.2.11.2 Switzerland Wire & Cable Compounds Market Estimates and Forecasts, by End-Use Industry (2020-2032) (USD Billion)

9.3.2.12 Austria

9.3.2.12.1 Austria Wire & Cable Compounds Market Estimates and Forecasts, by Type (2020-2032) (USD Billion)

9.3.2.12.2 Austria Wire & Cable Compounds Market Estimates and Forecasts, by End-Use Industry (2020-2032) (USD Billion)

9.3.2.13 Rest of Western Europe

9.3.2.13.1 Rest of Western Europe Wire & Cable Compounds Market Estimates and Forecasts, by Type (2020-2032) (USD Billion)

9.3.2.13.2 Rest of Western Europe Wire & Cable Compounds Market Estimates and Forecasts, by End-Use Industry (2020-2032) (USD Billion)

9.4 Asia Pacific

9.4.1 Trends Analysis

9.4.2 Asia Pacific Wire & Cable Compounds Market Estimates and Forecasts, by Country (2020-2032) (USD Billion)

9.4.3 Asia Pacific Wire & Cable Compounds Market Estimates and Forecasts, by Type (2020-2032) (USD Billion) 

9.4.4 Asia Pacific Wire & Cable Compounds Market Estimates and Forecasts, by End-Use Industry (2020-2032) (USD Billion)

9.4.5 China

9.4.5.1 China Wire & Cable Compounds Market Estimates and Forecasts, by Type (2020-2032) (USD Billion)

9.4.5.2 China Wire & Cable Compounds Market Estimates and Forecasts, by End-Use Industry (2020-2032) (USD Billion)

9.4.6 India

9.4.5.1 India Wire & Cable Compounds Market Estimates and Forecasts, by Type (2020-2032) (USD Billion)

9.4.5.2 India Wire & Cable Compounds Market Estimates and Forecasts, by End-Use Industry (2020-2032) (USD Billion)

9.4.5 Japan

9.4.5.1 Japan Wire & Cable Compounds Market Estimates and Forecasts, by Type (2020-2032) (USD Billion)

9.4.5.2 Japan Wire & Cable Compounds Market Estimates and Forecasts, by End-Use Industry (2020-2032) (USD Billion)

9.4.6 South Korea

9.4.6.1 South Korea Wire & Cable Compounds Market Estimates and Forecasts, by Type (2020-2032) (USD Billion)

9.4.6.2 South Korea Wire & Cable Compounds Market Estimates and Forecasts, by End-Use Industry (2020-2032) (USD Billion)

9.4.7 Vietnam

9.4.7.1 Vietnam Wire & Cable Compounds Market Estimates and Forecasts, by Type (2020-2032) (USD Billion)

9.2.7.2 Vietnam Wire & Cable Compounds Market Estimates and Forecasts, by End-Use Industry (2020-2032) (USD Billion)

9.4.8 Singapore

9.4.8.1 Singapore Wire & Cable Compounds Market Estimates and Forecasts, by Type (2020-2032) (USD Billion)

9.4.8.2 Singapore Wire & Cable Compounds Market Estimates and Forecasts, by End-Use Industry (2020-2032) (USD Billion)

9.4.9 Australia

9.4.9.1 Australia Wire & Cable Compounds Market Estimates and Forecasts, by Type (2020-2032) (USD Billion)

9.4.9.2 Australia Wire & Cable Compounds Market Estimates and Forecasts, by End-Use Industry (2020-2032) (USD Billion)

9.4.10 Rest of Asia Pacific

9.4.10.1 Rest of Asia Pacific Wire & Cable Compounds Market Estimates and Forecasts, by Type (2020-2032) (USD Billion)

9.4.10.2 Rest of Asia Pacific Wire & Cable Compounds Market Estimates and Forecasts, by End-Use Industry (2020-2032) (USD Billion)

9.5 Middle East and Africa

9.5.1 Middle East

9.5.1.1 Trends Analysis

9.5.1.2 Middle East Wire & Cable Compounds Market Estimates and Forecasts, by Country (2020-2032) (USD Billion)

9.5.1.3 Middle East Wire & Cable Compounds Market Estimates and Forecasts, by Type (2020-2032) (USD Billion) 

9.5.1.4 Middle East Wire & Cable Compounds Market Estimates and Forecasts, by End-Use Industry (2020-2032) (USD Billion)

9.5.1.5 UAE

9.5.1.5.1 UAE Wire & Cable Compounds Market Estimates and Forecasts, by Type (2020-2032) (USD Billion)

9.5.1.5.2 UAE Wire & Cable Compounds Market Estimates and Forecasts, by End-Use Industry (2020-2032) (USD Billion)

9.5.1.6 Egypt

9.5.1.6.1 Egypt Wire & Cable Compounds Market Estimates and Forecasts, by Type (2020-2032) (USD Billion)

9.5.1.6.2 Egypt Wire & Cable Compounds Market Estimates and Forecasts, by End-Use Industry (2020-2032) (USD Billion)

9.5.1.7 Saudi Arabia

9.5.1.7.1 Saudi Arabia Wire & Cable Compounds Market Estimates and Forecasts, by Type (2020-2032) (USD Billion)

9.5.1.7.2 Saudi Arabia Wire & Cable Compounds Market Estimates and Forecasts, by End-Use Industry (2020-2032) (USD Billion)

9.5.1.8 Qatar

9.5.1.8.1 Qatar Wire & Cable Compounds Market Estimates and Forecasts, by Type (2020-2032) (USD Billion)

9.5.1.8.2 Qatar Wire & Cable Compounds Market Estimates and Forecasts, by End-Use Industry (2020-2032) (USD Billion)

9.5.1.9 Rest of Middle East

9.5.1.9.1 Rest of Middle East Wire & Cable Compounds Market Estimates and Forecasts, by Type (2020-2032) (USD Billion)

9.5.1.9.2 Rest of Middle East Wire & Cable Compounds Market Estimates and Forecasts, by End-Use Industry (2020-2032) (USD Billion)

9.5.2 Africa

9.5.2.1 Trends Analysis

9.5.2.2 Africa Wire & Cable Compounds Market Estimates and Forecasts, by Country (2020-2032) (USD Billion)

9.5.2.3 Africa Wire & Cable Compounds Market Estimates and Forecasts, by Type (2020-2032) (USD Billion) 

9.5.2.4 Africa Wire & Cable Compounds Market Estimates and Forecasts, by End-Use Industry (2020-2032) (USD Billion)

9.5.2.5 South Africa

9.5.2.5.1 South Africa Wire & Cable Compounds Market Estimates and Forecasts, by Type (2020-2032) (USD Billion)

9.5.2.5.2 South Africa Wire & Cable Compounds Market Estimates and Forecasts, by End-Use Industry (2020-2032) (USD Billion)

9.5.2.6 Nigeria

9.5.2.6.1 Nigeria Wire & Cable Compounds Market Estimates and Forecasts, by Type (2020-2032) (USD Billion)

9.5.2.6.2 Nigeria Wire & Cable Compounds Market Estimates and Forecasts, by End-Use Industry (2020-2032) (USD Billion)

9.5.2.7 Rest of Africa

9.5.2.7.1 Rest of Africa Wire & Cable Compounds Market Estimates and Forecasts, by Component (2020-2032) (USD Billion)

9.5.2.7.2 Rest of Africa Wire & Cable Compounds Market Estimates and Forecasts, by Technology  (2020-2032) (USD Billion)

9.6 Latin America

9.6.1 Trends Analysis

9.6.2 Latin America Wire & Cable Compounds Market Estimates and Forecasts, by Country (2020-2032) (USD Billion)

9.6.3 Latin America Wire & Cable Compounds Market Estimates and Forecasts, by Type (2020-2032) (USD Billion) 

9.6.4 Latin America Wire & Cable Compounds Market Estimates and Forecasts, by End-Use Industry (2020-2032) (USD Billion)

9.6.5 Brazil

9.6.5.1 Brazil Wire & Cable Compounds Market Estimates and Forecasts, by Type (2020-2032) (USD Billion)

9.6.5.2 Brazil Wire & Cable Compounds Market Estimates and Forecasts, by End-Use Industry (2020-2032) (USD Billion)

9.6.6 Argentina

9.6.6.1 Argentina Wire & Cable Compounds Market Estimates and Forecasts, by Type (2020-2032) (USD Billion)

9.6.6.2 Argentina Wire & Cable Compounds Market Estimates and Forecasts, by End-Use Industry (2020-2032) (USD Billion)

9.6.7 Colombia

9.6.7.1 Colombia Wire & Cable Compounds Market Estimates and Forecasts, by Type (2020-2032) (USD Billion)

9.6.7.2 Colombia Wire & Cable Compounds Market Estimates and Forecasts, by End-Use Industry (2020-2032) (USD Billion)

9.6.8 Rest of Latin America

9.6.8.1 Rest of Latin America Wire & Cable Compounds Market Estimates and Forecasts, by Type (2020-2032) (USD Billion)

9.6.8.2 Rest of Latin America Wire & Cable Compounds Market Estimates and Forecasts, by End-Use Industry (2020-2032) (USD Billion)

10. Company Profiles

           10.1 DuPont de Nemours, Inc.

                          10.1.1 Company Overview

10.1.2 Financial

10.1.3 Products/ Services Offered

10.1.4 SWOT Analysis

           10.2 Evonik Industries AG

10.2.1 Company Overview

10.2.2 Financial

10.2.3 Products/ Services Offered

10.2.4 SWOT Analysis

10.3 Avient Corporation

10.3.1 Company Overview

10.3.2 Financial

10.3.3 Products/ Services Offered

10.3.4 SWOT Analysis

10.4 Exxon Mobil Corporation

10.4.1 Company Overview

10.4.2 Financial

10.4.3 Products/ Services Offered

10.4.4 SWOT Analysis

10.5 Trelleborg AB

             10.5.1 Company Overview

10.5.2 Financial

10.5.3 Products/ Services Offered

10.5.4 SWOT Analysis

10.6 Mitsubishi Chemical Corporation

             10.6.1 Company Overview

10.6.2 Financial

10.6.3 Products/ Services Offered

10.6.4 SWOT Analysis

10.7 Solvay S.A.

             10.7.1 Company Overview

10.7.2 Financial

10.7.3 Products/ Services Offered

10.7.4 SWOT Analysis

10.8 Borouge

             10.8.1 Company Overview

10.8.2 Financial

10.8.3 Products/ Services Offered

10.8.4 SWOT Analysis

10.9 Siam Cement Public Company Limited

             10.9.1 Company Overview

10.9.2 Financial

10.9.3 Products/ Services Offered

10.9.4 SWOT Analysis

10.10 Eastman Chemical Company

             10.10.1 Company Overview

10.10.2 Financial

10.10.3 Products/ Services Offered

10.10.4 SWOT Analysis

11. Use Cases and Best Practices

12. Conclusion


An accurate research report requires proper strategizing as well as implementation. There are multiple factors involved in the completion of good and accurate research report and selecting the best methodology to compete the research is the toughest part. Since the research reports we provide play a crucial role in any company’s decision-making process, therefore we at SNS Insider always believe that we should choose the best method which gives us results closer to reality. This allows us to reach at a stage wherein we can provide our clients best and accurate investment to output ratio.

Each report that we prepare takes a timeframe of 350-400 business hours for production. Starting from the selection of titles through a couple of in-depth brain storming session to the final QC process before uploading our titles on our website we dedicate around 350 working hours. The titles are selected based on their current market cap and the foreseen CAGR and growth.


The 5 steps process:

Step 1: Secondary Research:

Secondary Research or Desk Research is as the name suggests is a research process wherein, we collect data through the readily available information. In this process we use various paid and unpaid databases which our team has access to and gather data through the same. This includes examining of listed companies’ annual reports, Journals, SEC filling etc. Apart from this our team has access to various associations across the globe across different industries. Lastly, we have exchange relationships with various university as well as individual libraries.

Secondary Research

Step 2: Primary Research

When we talk about primary research, it is a type of study in which the researchers collect relevant data samples directly, rather than relying on previously collected data.  This type of research is focused on gaining content specific facts that can be sued to solve specific problems. Since the collected data is fresh and first hand therefore it makes the study more accurate and genuine.

We at SNS Insider have divided Primary Research into 2 parts.

Part 1 wherein we interview the KOLs of major players as well as the upcoming ones across various geographic regions. This allows us to have their view over the market scenario and acts as an important tool to come closer to the accurate market numbers. As many as 45 paid and unpaid primary interviews are taken from both the demand and supply side of the industry to make sure we land at an accurate judgement and analysis of the market.

This step involves the triangulation of data wherein our team analyses the interview transcripts, online survey responses and observation of on filed participants. The below mentioned chart should give a better understanding of the part 1 of the primary interview.

Primary Research

Part 2: In this part of primary research the data collected via secondary research and the part 1 of the primary research is validated with the interviews from individual consultants and subject matter experts.

Consultants are those set of people who have at least 12 years of experience and expertise within the industry whereas Subject Matter Experts are those with at least 15 years of experience behind their back within the same space. The data with the help of two main processes i.e., FGDs (Focused Group Discussions) and IDs (Individual Discussions). This gives us a 3rd party nonbiased primary view of the market scenario making it a more dependable one while collation of the data pointers.

Step 3: Data Bank Validation

Once all the information is collected via primary and secondary sources, we run that information for data validation. At our intelligence centre our research heads track a lot of information related to the market which includes the quarterly reports, the daily stock prices, and other relevant information. Our data bank server gets updated every fortnight and that is how the information which we collected using our primary and secondary information is revalidated in real time.

Data Bank Validation

Step 4: QA/QC Process

After all the data collection and validation our team does a final level of quality check and quality assurance to get rid of any unwanted or undesired mistakes. This might include but not limited to getting rid of the any typos, duplication of numbers or missing of any important information. The people involved in this process include technical content writers, research heads and graphics people. Once this process is completed the title gets uploader on our platform for our clients to read it.

Step 5: Final QC/QA Process:

This is the last process and comes when the client has ordered the study. In this process a final QA/QC is done before the study is emailed to the client. Since we believe in giving our clients a good experience of our research studies, therefore, to make sure that we do not lack at our end in any way humanly possible we do a final round of quality check and then dispatch the study to the client.

Key Segments:

By Type

  • Halogenated Polymers

  • Non-Halogenated Polymers

By End-Use Industry

  • Construction

  • Wind Energy

  • Power

  • Communication

  • Automotive

  • Others

Request for Segment Customization as per your Business Requirement: Segment Customization Request

Regional Coverage:

North America

  • US

  • Canada

  • Mexico

Europe

  • Eastern Europe

    • Poland

    • Romania

    • Hungary

    • Turkey

    • Rest of Eastern Europe

  • Western Europe

    • Germany

    • France

    • UK

    • Italy

    • Spain

    • Netherlands

    • Switzerland

    • Austria

    • Rest of Western Europe

Asia Pacific

  • China

  • India

  • Japan

  • South Korea

  • Vietnam

  • Singapore

  • Australia

  • Rest of Asia Pacific

Middle East & Africa

  • Middle East

    • UAE

    • Egypt

    • Saudi Arabia

    • Qatar

    • Rest of Middle East

  • Africa

    • Nigeria

    • South Africa

    • Rest of Africa

  • Latin America

  • Brazil

  • Argentina

  • Colombia

  • Rest of Latin America

Request for Country Level Research Report: Country Level Customization Request

Available Customization

With the given market data, SNS Insider offers customization as per the company’s specific needs. The following customization options are available for the report:

  • Product Analysis

  • Criss-Cross segment analysis (e.g. Product X Application)

  • Product Matrix which gives a detailed comparison of the product portfolio of each company

  • Geographic Analysis

  • Additional countries in any of the regions

  • Company Information

  • Detailed analysis and profiling of additional market players (Up to five)


  •            5000 (33% Discount)


  •            8950 (40% Discount)


  •            3050 (23% Discount)

Start a Conversation

Hi! Click one of our member below to chat on Phone